
Table 1
Mean half-hourly GWh electricity consumption by year, 2017–19.
| YEAR | EARLY MORNING | MORNING PEAK | DAYTIME | EVENING PEAK | LATE EVENING |
|---|---|---|---|---|---|
| 2017 | 12.49 | 16.19 | 17.63 | 18.14 | 14.56 |
| 2018 | 12.50 | 16.21 | 17.65 | 18.02 | 14.45 |
| 2019 | 12.29 | 15.92 | 17.32 | 17.62 | 14.27 |
| 1 January–30 June 2020 | 11.67 | 14.77 | 16.31 | 16.73 | 13.63 |
Table 2
Mean half-hourly MtCO2e by year, 2017–19.
| YEAR | EARLY MORNING | MORNING PEAK | DAYTIME | EVENING PEAK | LATE EVENING |
|---|---|---|---|---|---|
| 2017 | 3.13 | 4.62 | 4.77 | 5.43 | 4.02 |
| 2018 | 2.68 | 4.16 | 4.29 | 4.96 | 3.49 |
| 2019 | 2.37 | 3.74 | 3.85 | 4.33 | 3.14 |
| 1 January–30 June 2020 | 1.97 | 2.92 | 3.00 | 3.60 | 2.65 |
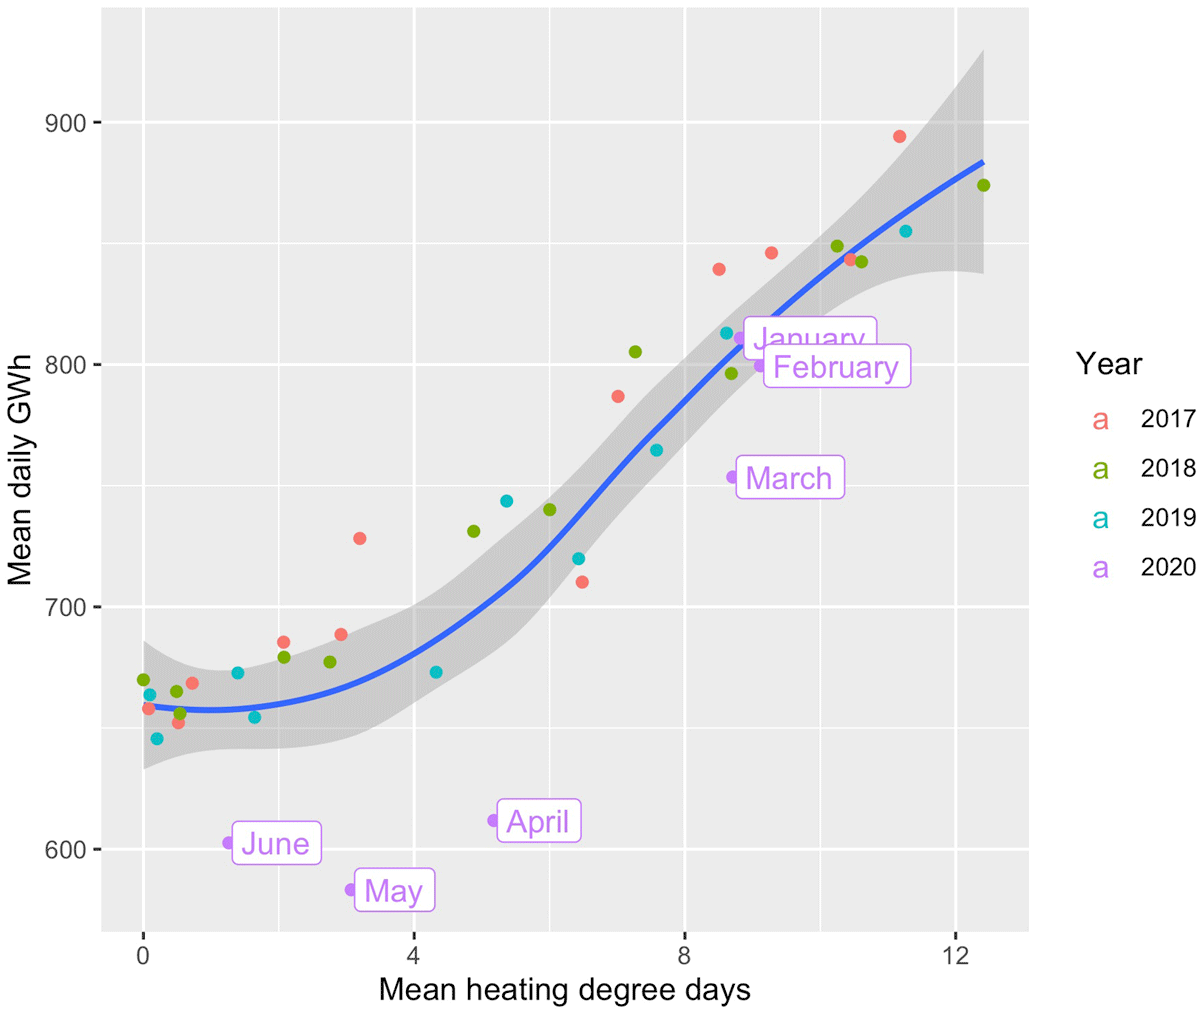
Figure 1
Plot of mean daily GB electricity consumption (GWh) against average monthly heating degree-days, 1 January 2017–30 June 2020.a
Note: a Smoothed fit line for all years except 2020 via locally estimated scatterplot smoothing (LOESS). Implemented via geom_smooth() from the R ggplot2 package (Wickham 2009).
Sources: Authors’ calculations using National Grid Electricity System Operator (ESO) data and average temperatures and heating degree-days and deviations from the long-term mean (ET 7.1) (BEIS 2020b).
Table 3
Lockdown periods derived from the Oxford Covid-19 Government Response Tracker stringency index.
| DATE | PERIOD | RATIONALE |
|---|---|---|
| Up to 22 March 2020 | Pre-lockdown | No or minor restrictions (not enforced) |
| 23 March–12 May 2020 | Period 1 | Major restrictions on travel, closure of non-essential workplaces and schools |
| 13–27 May 2020 | Period 2 | Some relaxation of ‘stay at home’ on 13 May, but schools and non-essential workplaces remain closed |
| 28 May–30 June 2020 | Period 3 | All Period 2 restrictions remain; workplaces start to reopen |
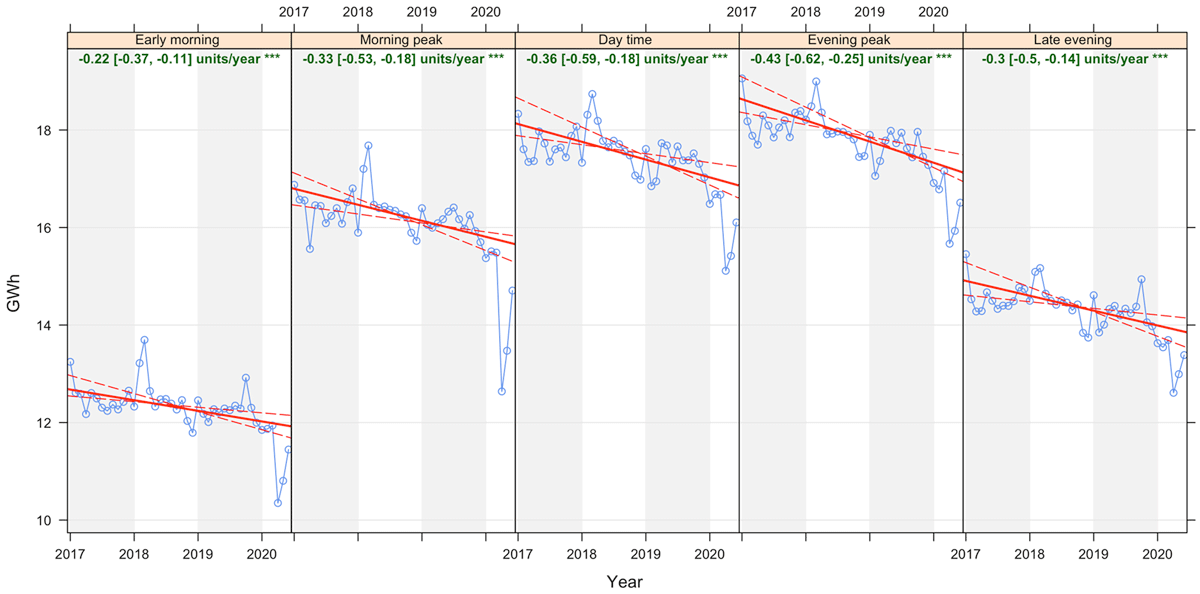
Figure 2
Theil–Sen plot of de-seasoned mean half-hourly GB electricity generation, 1 January 2017–30 June 2020.
Source: Authors’ calculations. Solid lines are the median trend; dotted lines are bootstrapped 95% confidence intervals.
Table 4
Percentage above/below the expected mean half-hourly GWh by month.
| MONTH IN 2020 | EARLY MORNING | MORNING PEAK | DAYTIME | EVENING PEAK | LATE EVENING |
|---|---|---|---|---|---|
| January | –1.4 | –2.8 | –3.2 | –2.4 | –2.6 |
| February | –1.1 | –1.7 | –1.8 | –2.9 | –3.0 |
| March | –0.4 | –1.7 | –1.8 | –0.6 | –1.8 |
| April | –13.5 | –19.6 | –10.8 | –9.0 | –9.4 |
| May | –9.6 | –14.2 | –8.8 | –7.3 | –6.5 |
| June | –4.1 | –6.2 | –4.6 | –3.7 | –3.5 |
[i] Note: Percentages are based on central (point) estimates and are rounded to reflect the uncertainty represented in Figure 2.
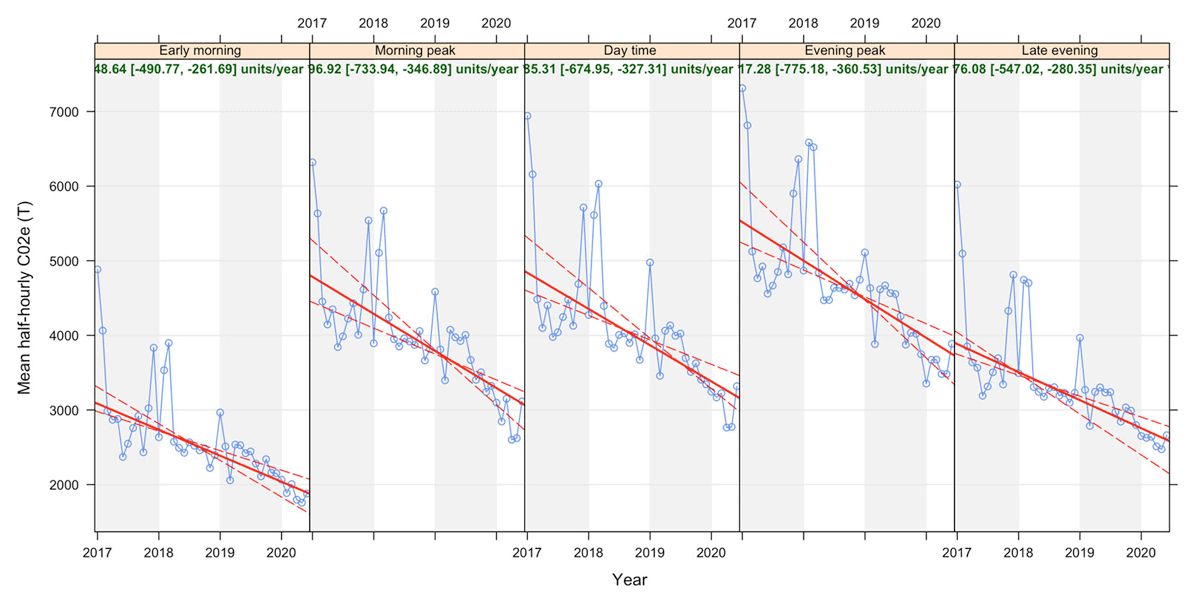
Figure 3
Theil–Sen plot of de-seasoned mean half-hourly GB TCO2e, 1 January 2017–30 June 2020.
Source: Authors’ calculations. Solid lines are the median trend; dotted lines are bootstrapped 95% confidence intervals.
Table 5
Percentage above/below the expected mean half-hourly total CO2e by month.
| MONTH IN 2020 | EARLY MORNING | MORNING PEAK | DAYTIME | EVENING PEAK | LATE EVENING |
|---|---|---|---|---|---|
| January | 1.3 | –6.0 | –4.1 | –15.4 | –3.8 |
| February | –6.1 | –12.5 | –5.2 | –6.4 | –3.6 |
| March | 1.3 | –1.9 | –2.3 | –5.3 | –2.0 |
| April | –7.9 | –18.0 | –15.3 | –9.2 | –5.7 |
| May | –8.6 | –16.2 | –13.9 | –8.3 | –6.0 |
| June | –0.7 | 0.9 | 4.3 | 3.6 | 2.4 |
[i] Note: Percentages are based on central (point) estimates and are rounded to reflect the uncertainty represented in Figure 3.
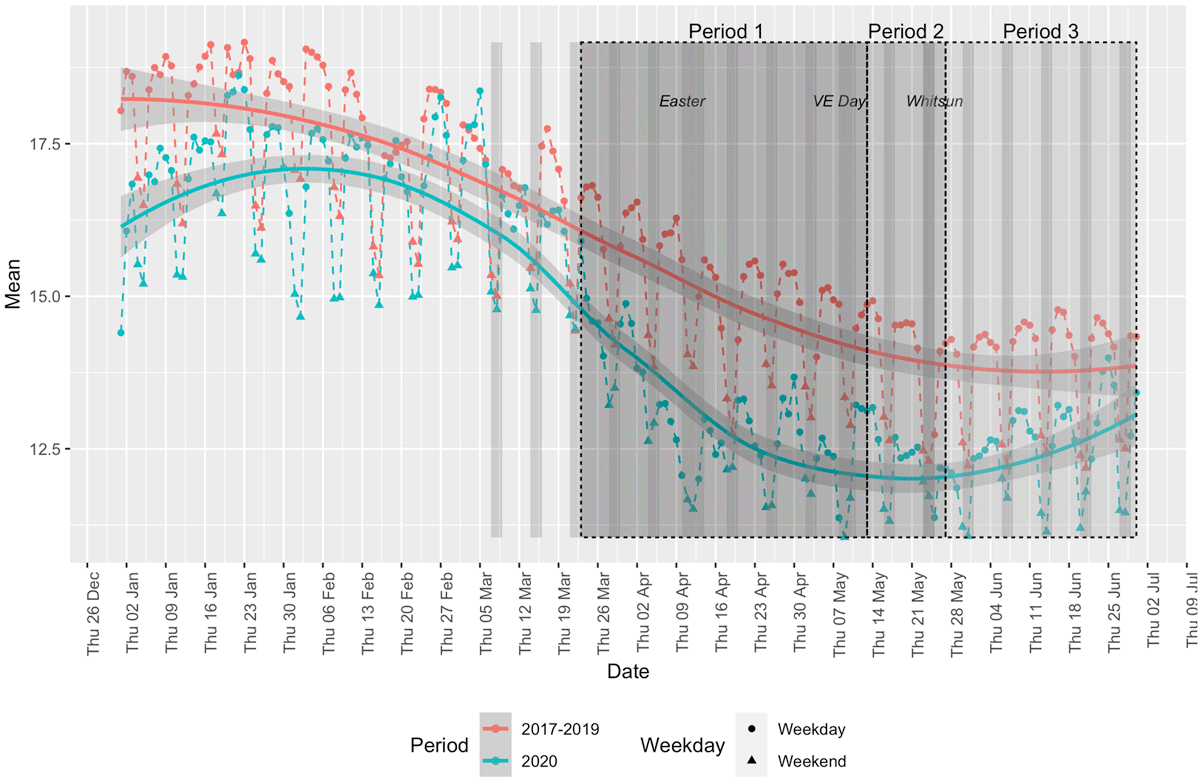
Figure 4
Mean half-hourly electricity consumption (GWh)/day, 1 January–30 June for 2017–19 (mean) and 2020.
Note: Box = UK Covid-19 lockdown to date.
Source: Authors’ calculations.
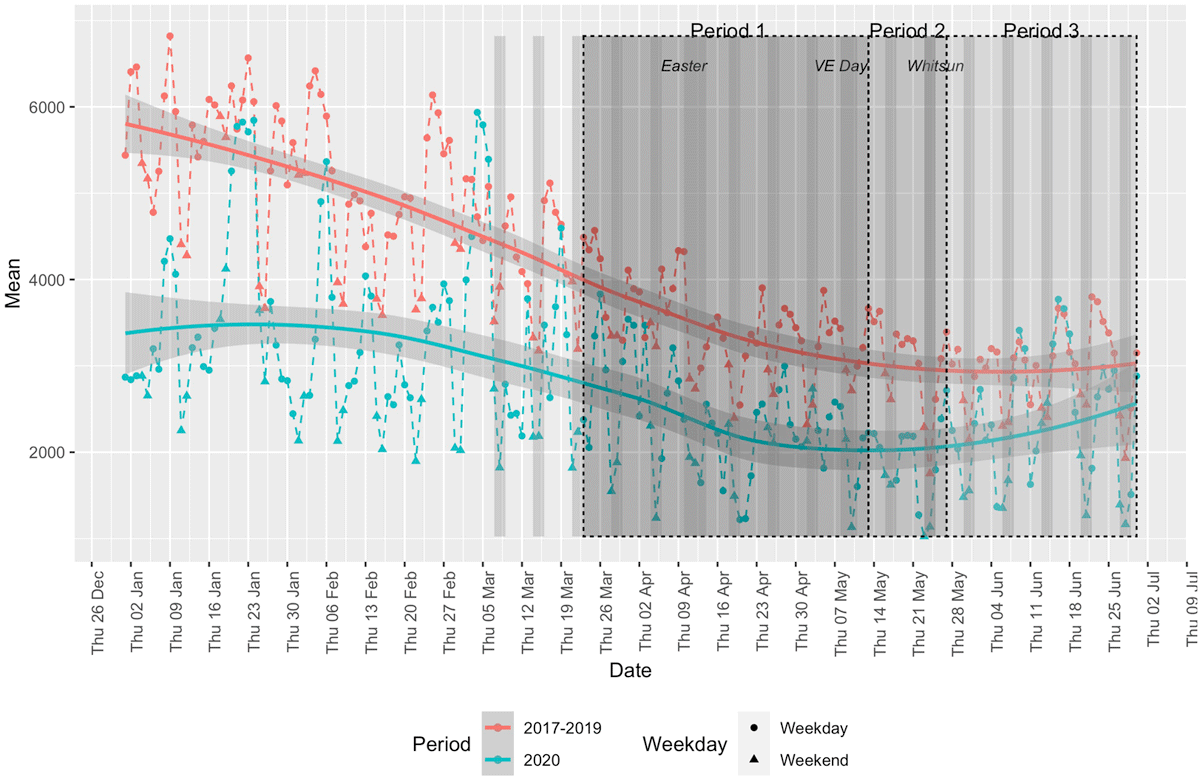
Figure 5
Mean half-hourly emissions (TCO2e/day, 1 January–30 June for 2017–19 (mean) and 2020.
Note: Box = UK Covid-19 lockdown to date.
Source: Authors’ calculations.
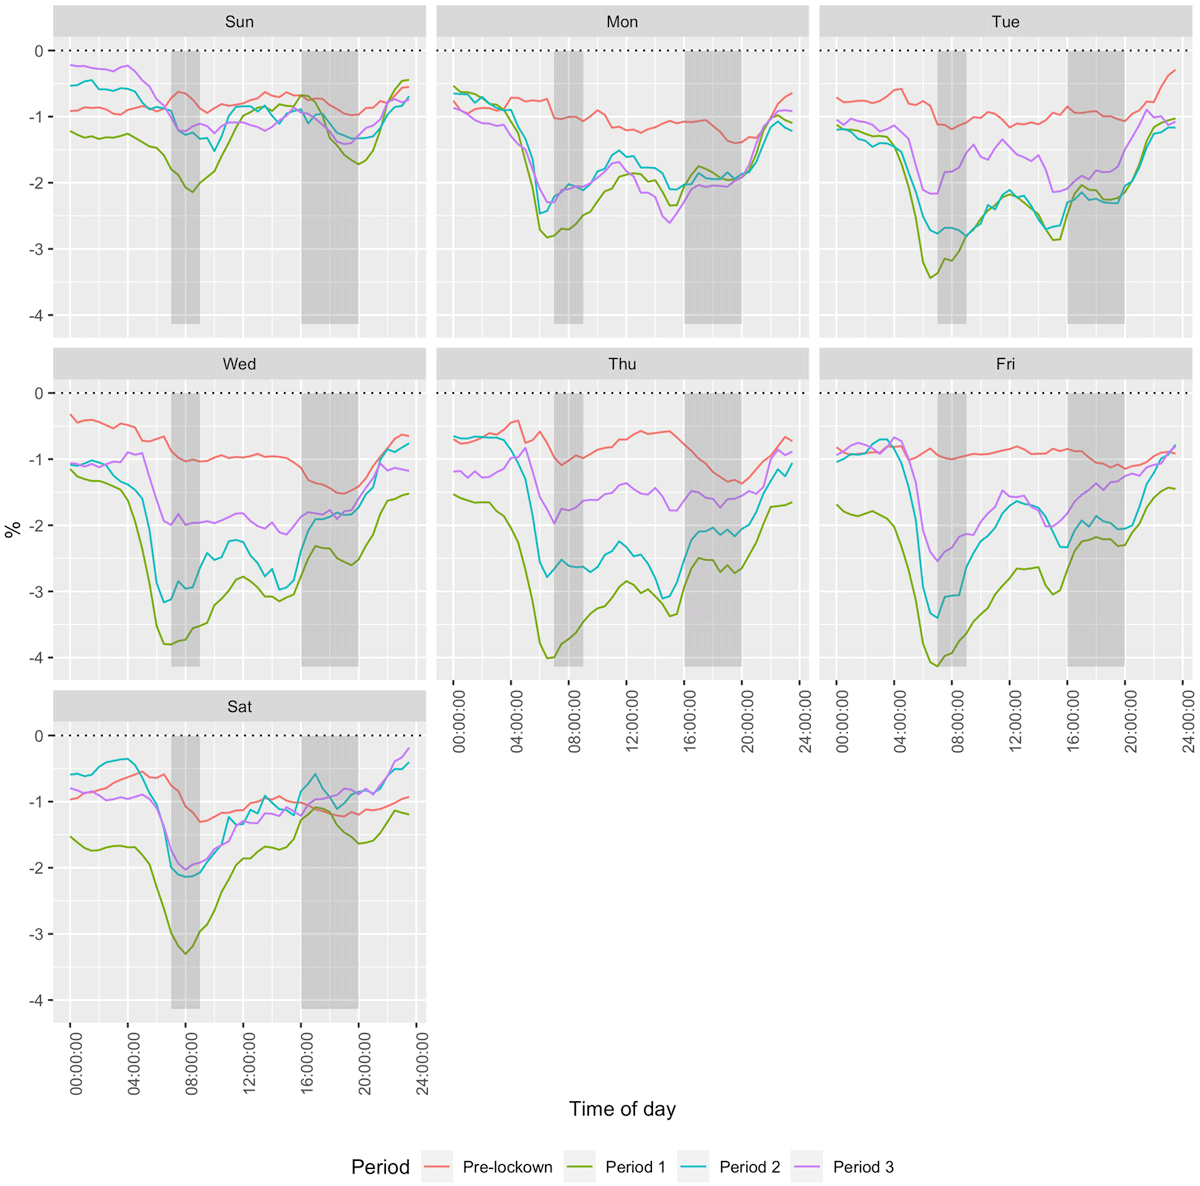
Figure 6
Percentage change in half-hourly GB electricity consumption (GWh) by day of the week and time of day from 1 January to 30 June for 2017–19 versus 2020 by lockdown period.
Note: Normal ‘peak’ demand periods are shaded. The dotted line = 0% reference.
Source: Authors’ calculations.
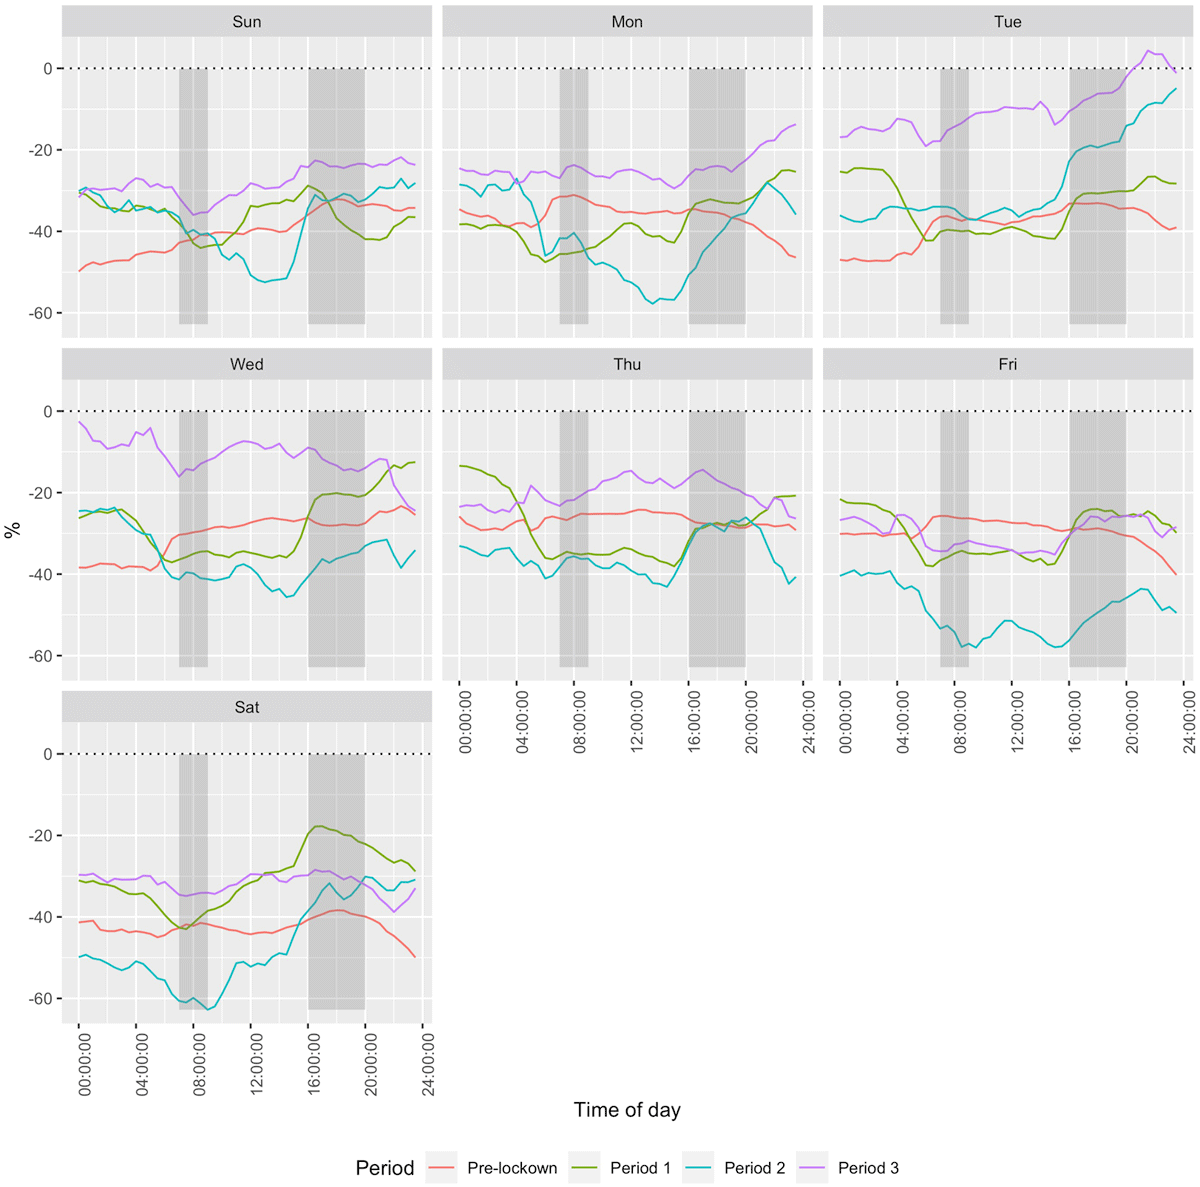
Figure 7
Percentage change in mean half-hourly emissions by day of the week and time day from 1 January to 30 June for 2017–19 versus 2020 by lockdown period.
Note: ‘Peak’ demand periods are shaded. The dotted line = 0% reference.
Source: Authors’ calculations.
Table 6
Top 10 English and Wales local areas (middle layer super output areas—MSOAs) by the percentage of households with electric central heating and percentage with at least one dimension of deprivation.
| AREA | LOCAL AUTHORITY | NUMBER OF HOUSEHOLDS | % WITH > 1 DEPRIVATION DIMENSION | DEPRIVATION QUANTILE | % WITH ELECTRIC HEATING |
|---|---|---|---|---|---|
| Central | Birmingham | 3433 | 67.78% | 25% most deprived | 82.32% |
| Castlefield & Deansgate | Manchester | 3087 | 52.74% | Other | 81.63% |
| Pier Head | Liverpool | 2782 | 51.47% | Other | 81.45% |
| Leeds City Centre | Leeds | 3569 | 63.80% | Other | 78.40% |
| Piccadilly & Ancoats | Manchester | 3885 | 63.40% | Other | 76.42% |
| Cardiff Bay | Cardiff | 3654 | 48.41% | Other | 74.44% |
| Leicester City Centre | Leicester | 2961 | 74.47% | 25% most deprived | 70.01% |
| Cathedral & Kelham | Sheffield | 3270 | 73.64% | 25% most deprived | 64.86% |
| City Centre North & Collyhurst | Manchester | 3368 | 68.59% | 25% most deprived | 60.84% |
| Central & Islington | Liverpool | 3201 | 66.26% | 25% most deprived | 59.39% |
[i] Source: Census 2011, QS415EW and QS119E.