
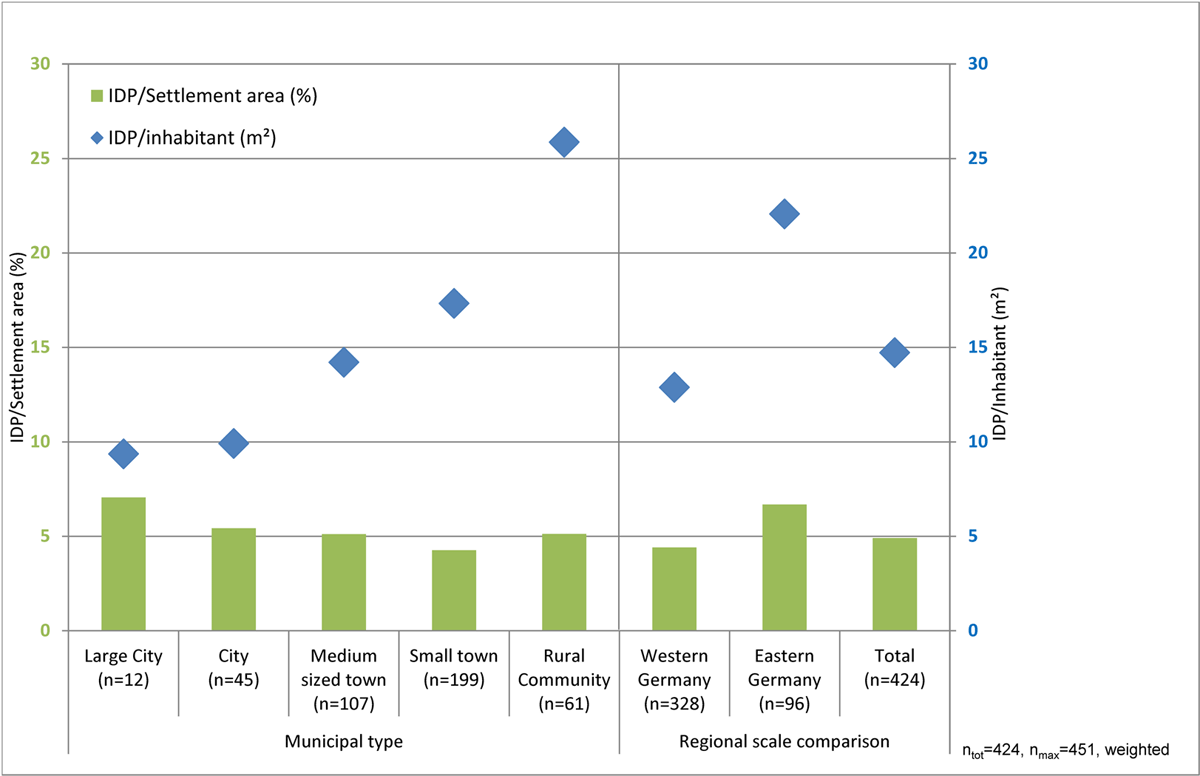
Figure 1
Infill development potential (IDP) in Germany by type of municipality and by region.
Note: ntot = Number of respondents answering to this question; nmax = number of returned valid questionnaires. (This notation also applies to the following figures.)
Source: Authors.
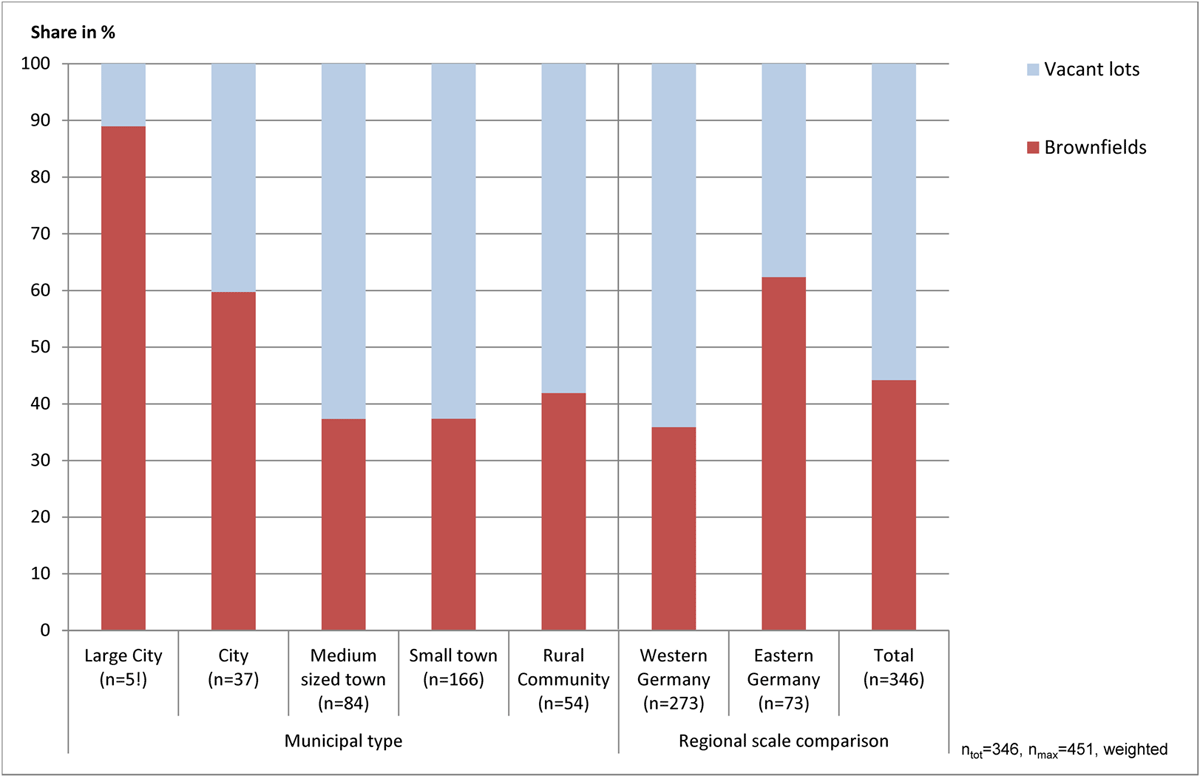
Figure 2
Share of brownfields and vacant lots with infill development potential (IDP) in Germany by type of municipality and by region.
Source: Authors.
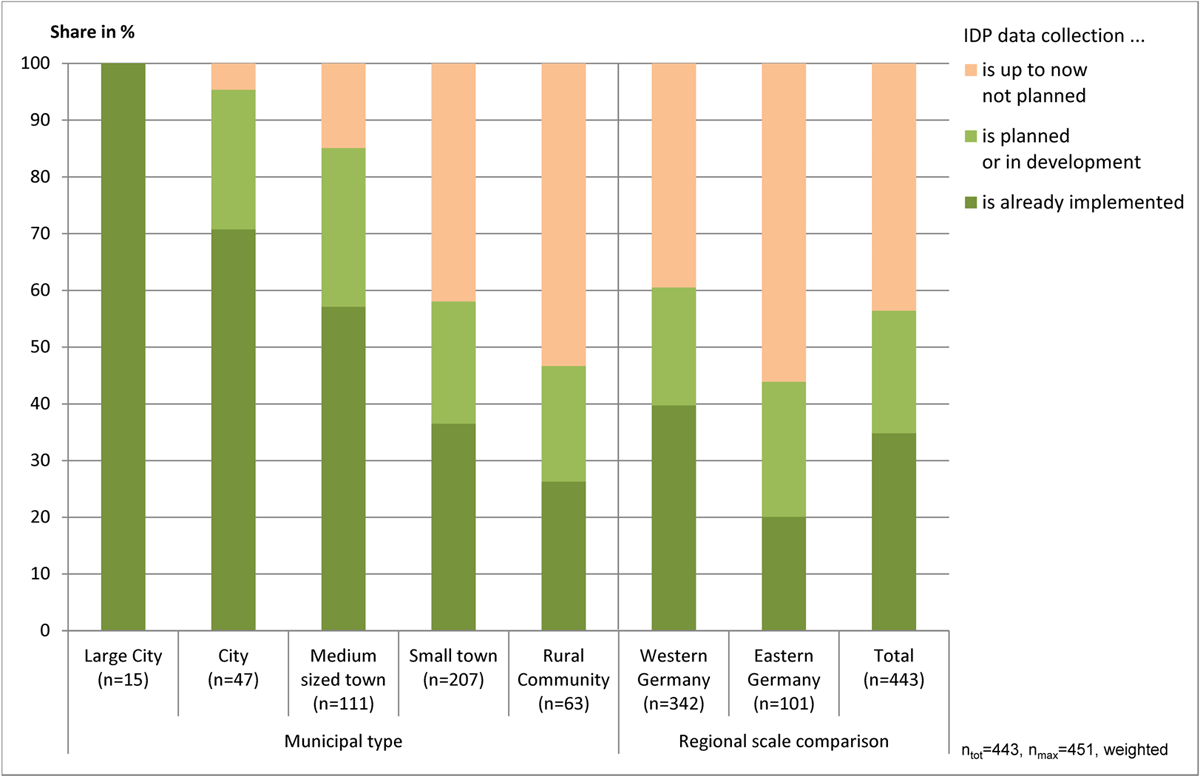
Figure 3
Reported activities to capture infill development potential (IDP) data by type of municipality and by region.
Source: Authors.
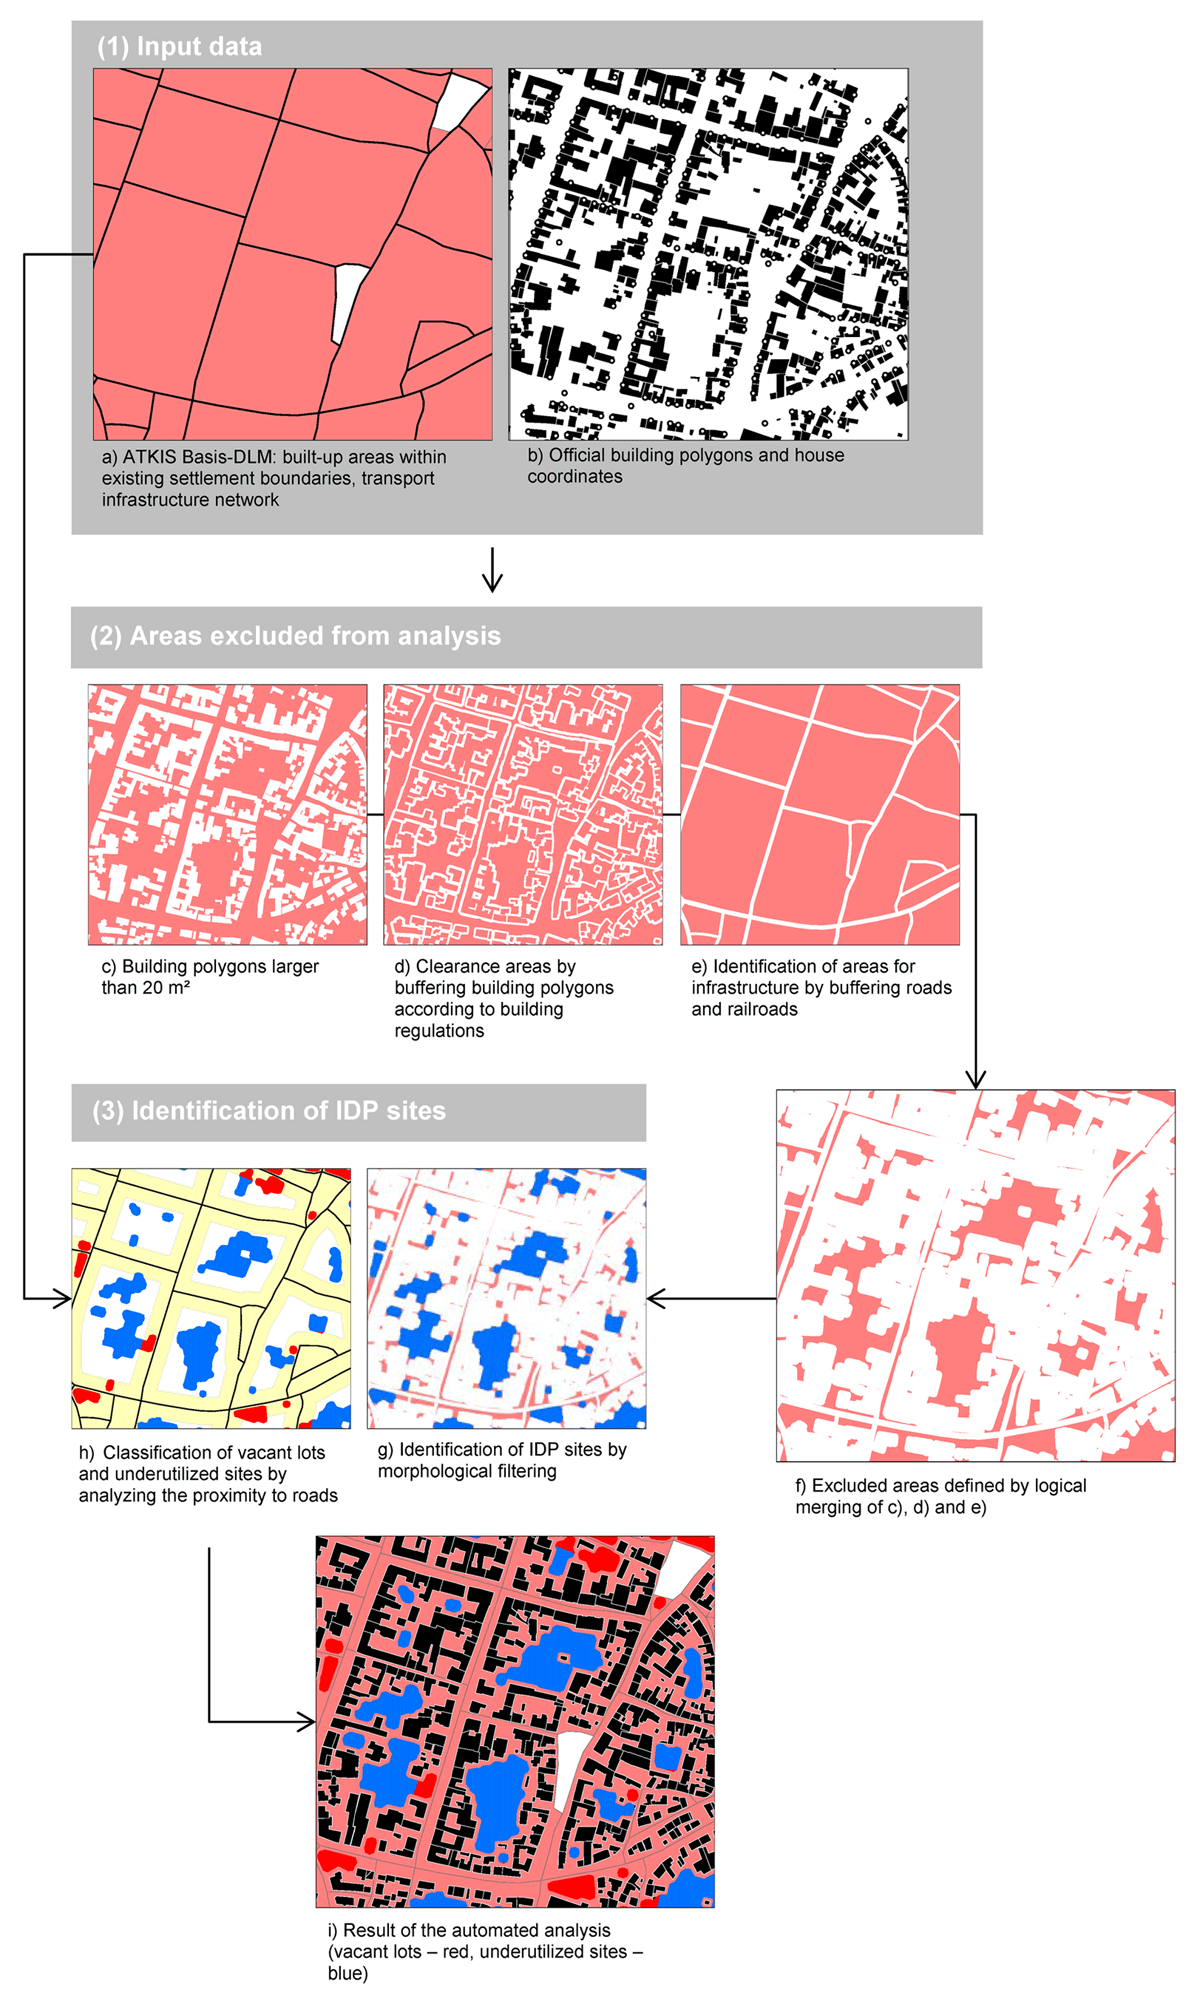
Figure 4
Workflow of the automated analysis of infill development potential (IDP).
Source: Authors.
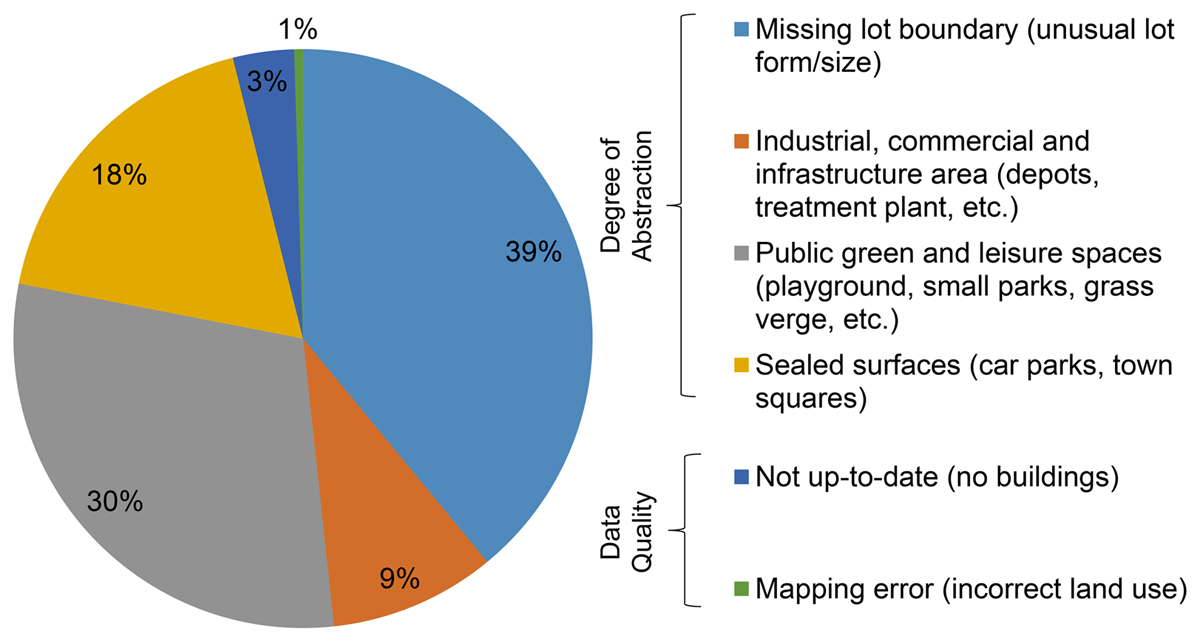
Figure 5
Categories of identified errors in the Authoritative Topographic Cartographic Information System (ATKIS)-based infill development potential (IDP) detection procedure.
Source: Authors.
Table 1
Infill development potential (IDP) of vacant lots based on the questionnaire survey and automated detection procedure
| CASE STUDY | SETTLEMENT AREA (BUILDINGS AND ASSOCIATED OPEN SPACE) (HA) | IDP ON VACANT LOTS (HA) | ABSOLUTE DIFFERENCE (ADP – QS) (HA) | RELATIVE DIFFERENCE (%) | |
|---|---|---|---|---|---|
| QUESTIONNAIRE SURVEY (QS) | AUTOMATED DETECTION PROCEDURE (ADP) | ||||
| 1 | 54 | 3.0 | 2.8 | –0.2 | –6.7% |
| 2 | 108 | 2.5 | 3.3 | 0.8 | 32.0% |
| 3 | 132 | 1.0 | 3.1 | 2.1 | 210.0% |
| 4 | 1088 | 14.0 | 61.9 | 47.9 | 342.1% |
| 5 | 990 | 17.0 | 52.3 | 35.3 | 207.7% |
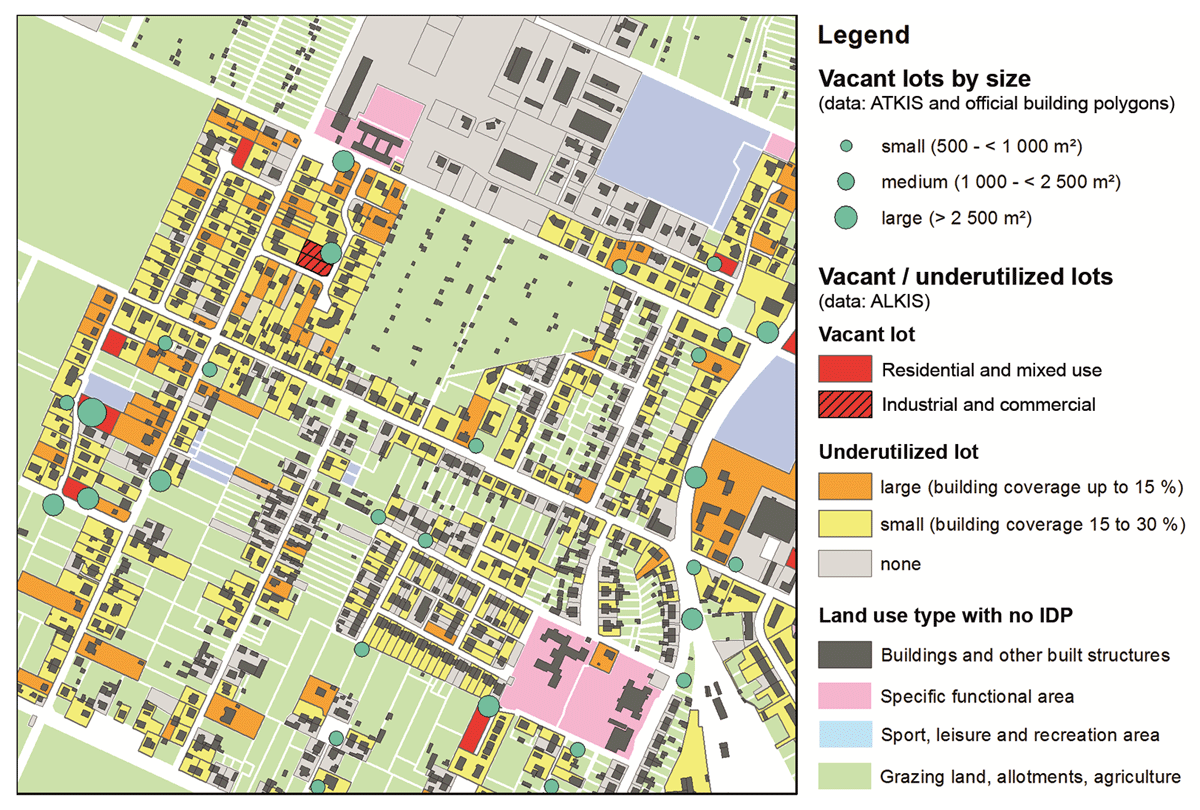
Figure 6
Improved identification of vacant and underused lots for a case study town using Authoritative Real Estate Cadastre Information System (ALKIS®) data compared with an approach using Authoritative Topographic Cartographic Information System (ATKIS) data.
Source: Authors.