
Table 1
Definitions of the building typologies considered in this study.
| USAGE CATEGORY | DESCRIPTION |
|---|---|
| Residential | Multistorey residential buildings |
| Office | Multistorey office buildings |
| Retail | Commercial buildings dedicated to selling goods and services directly to consumers; may include high street shops, shopping centres, lifestyle centres and strip malls (enclosed or open air) |
| Parking and logistics | Unheated or only partially climatised structures for storing vehicles (parking) or goods (logistics) |
| Industry | Climatised logistics halls used for industrial purposes |
| Science | Laboratories and research facilities, including specialised production buildings with high structural and climatisation needs |
| Health | Hospitals, clinics and other specialised healthcare facilities |
| Culture | Museums, theatres, libraries and similar cultural venues with significant structural and climatisation requirements |
Table 2
Deutsche Gesellschaft für Nachhaltiges Bauen (DGNB)-embodied CO2e reference values.
| BUILDING CLASS | DESCRIPTION | ANNUAL (kg CO2e/m2/yr) | 50-YEAR TOTAL (kg CO2e/m2) | PERCENTAGE DIFFERENCE RELATIVE TO CLASS 1 |
|---|---|---|---|---|
| Class 1 | Administrative buildings, schools | 12.0 | 600 | ±0% |
| Class 2 | Laboratory buildings, event buildings | 12.5 | 625 | –4% |
| Class 3 | Hospitals | 13.5 | 675 | –13% |
| Class 4 | Enclosed storage rooms, production facilities | 9.0 | 450 | 25% |
| Class 5 | Sports halls | 10.5 | 525 | 13% |
[i] Note: DGNB-adjusted multipliers: embodied CO2e reference values by building class, shown as annual and total emissions over a 50-year period. Differences are relative to Class 1 (Administrative buildings, schools) as the baseline.
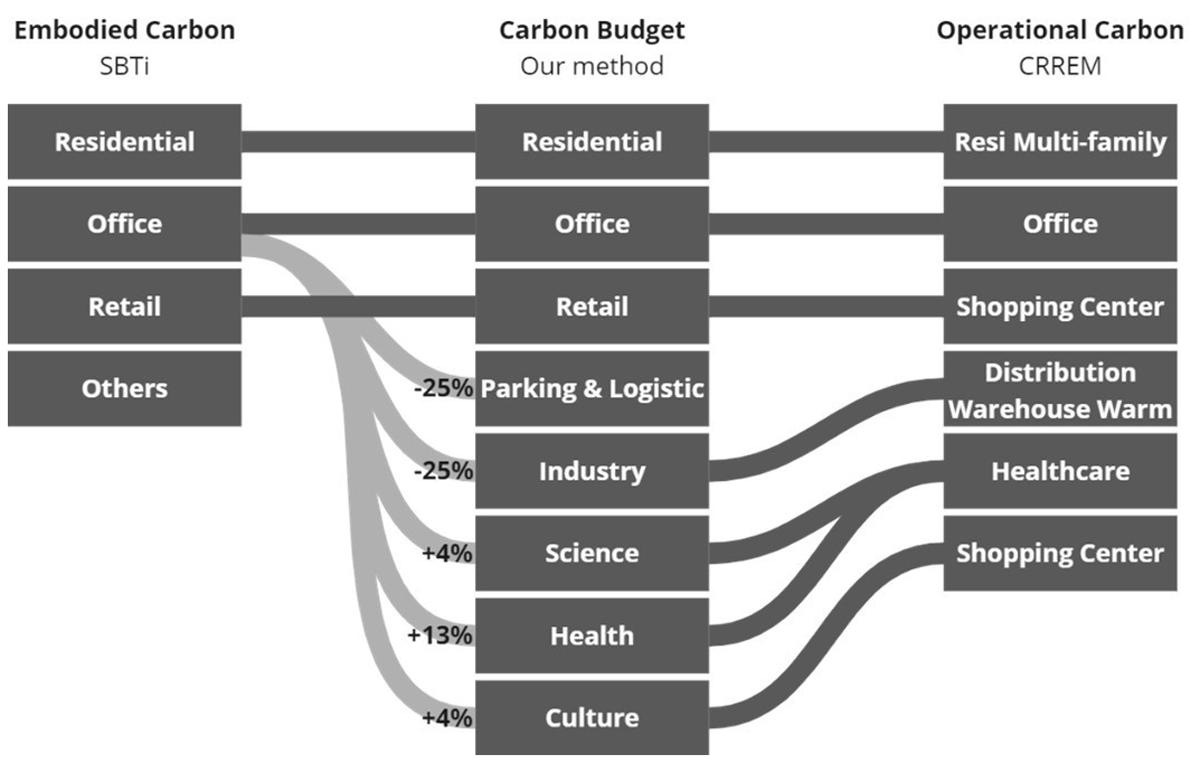
Figure 1
Derivation of the building uses definitions based on the Science-Based Targets initiative (SBTi) and Carbon Risk Real Estate Monitor (CRREM).
Note: Light grey indicates that the SBTi values have been modified based on the Deutsche Gesellschaft für Nachhaltiges Bauen (DGNB)-derived multipliers. The percentage variation is shown next to the respective uses.
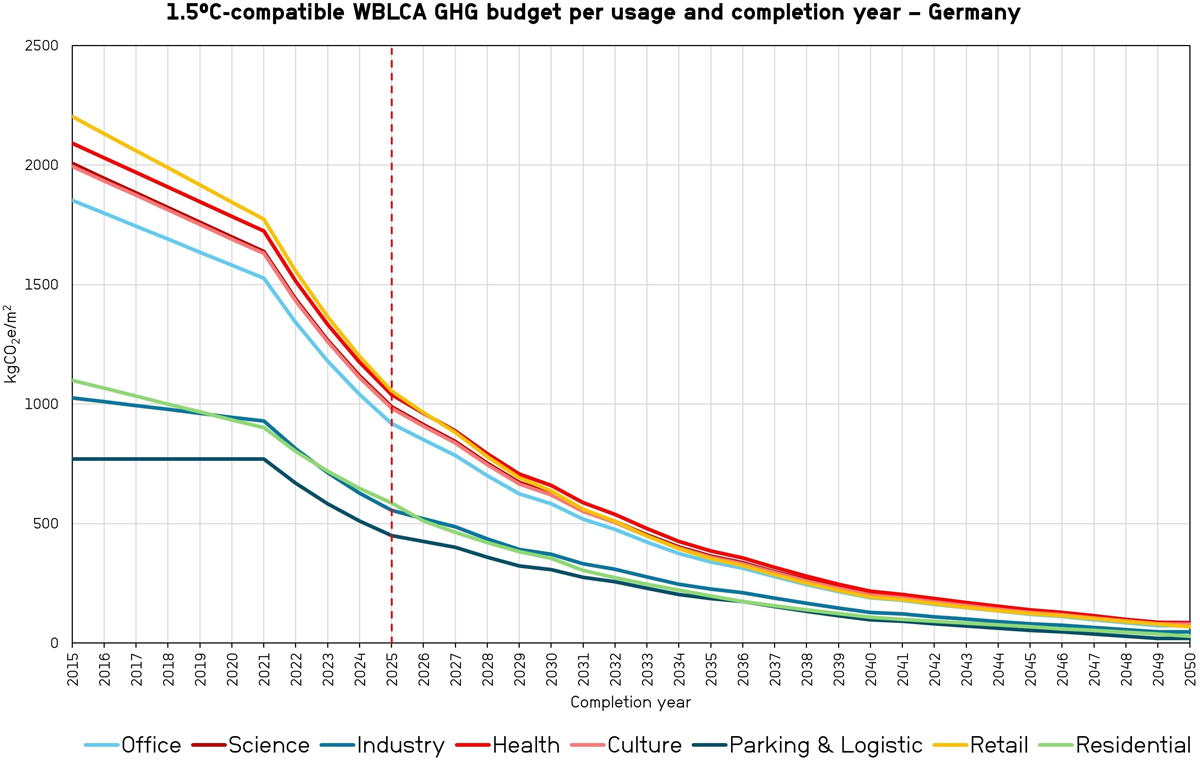
Figure 2
Greenhouse gas (GHG)-reduction pathways per m2 for each building use for Germany.
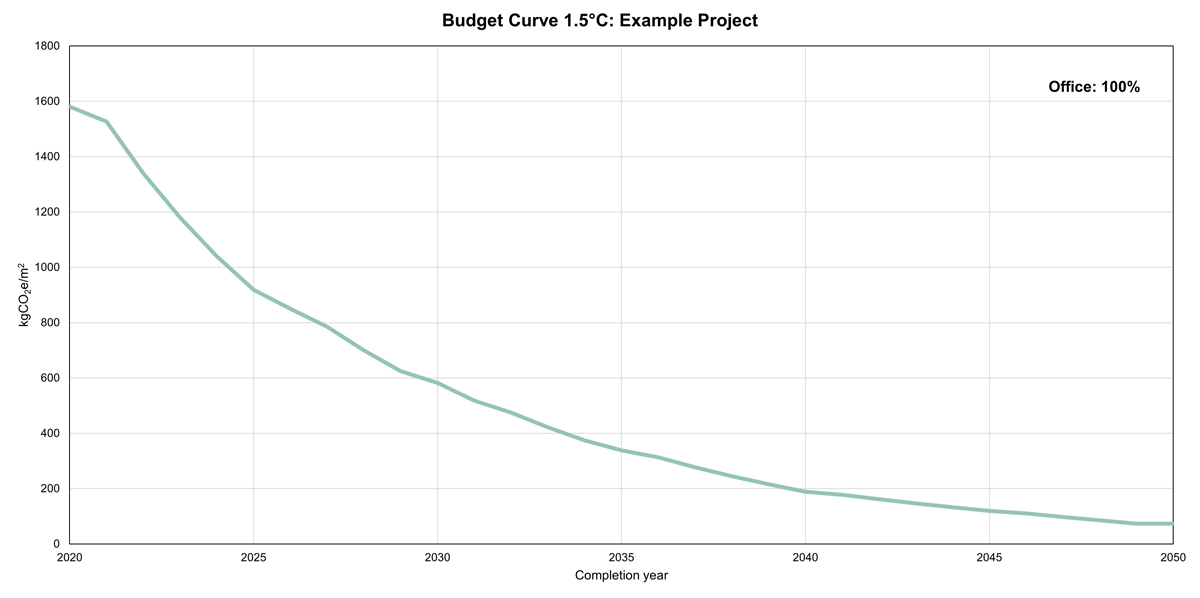
Figure 3
Single-use scenario: the curve shows the reduction in the carbon budget for an office building of 25,000 m2 net floor area (NFA) for Germany.
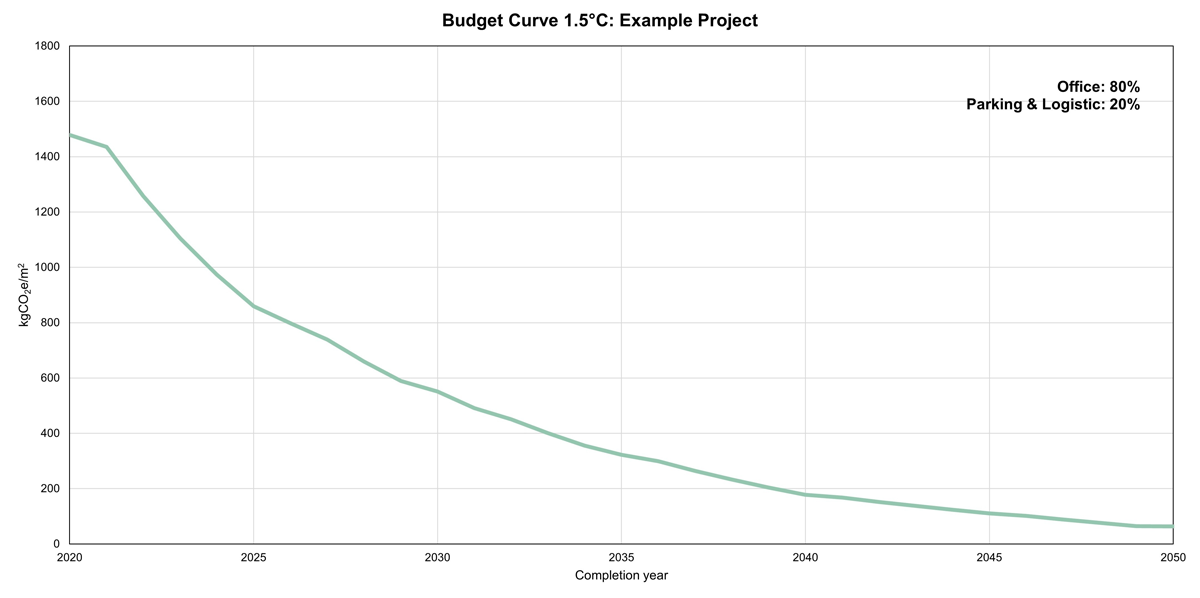
Figure 4
Mixed-use scenario: the curve shows the reduction in the carbon budget for an office building (20,000 m2 net floor area—NFA) with associated parking (5000 m2 NFA) for Germany.
Table 3
Estimated periods for halving carbon intensity by usage category, based on an analysis of the decarbonisation pathways from 2025 to 2050.
| BUILDING USE | HALVING PERIOD (YEARS) |
|---|---|
| Office | 7.15 |
| Science | 7.03 |
| Industry | 8.30 |
| Health | 7.14 |
| Culture | 7.05 |
| Parking and logistic | 9.72 |
| Retail | 6.37 |
| Residential | 6.65 |
| Average | 7.43 |
[i] Note: The period for halving represents the years required for the embodied carbon intensity to reduce by 50% within each usage category. Shorter halving periods indicate faster rates of decarbonisation.
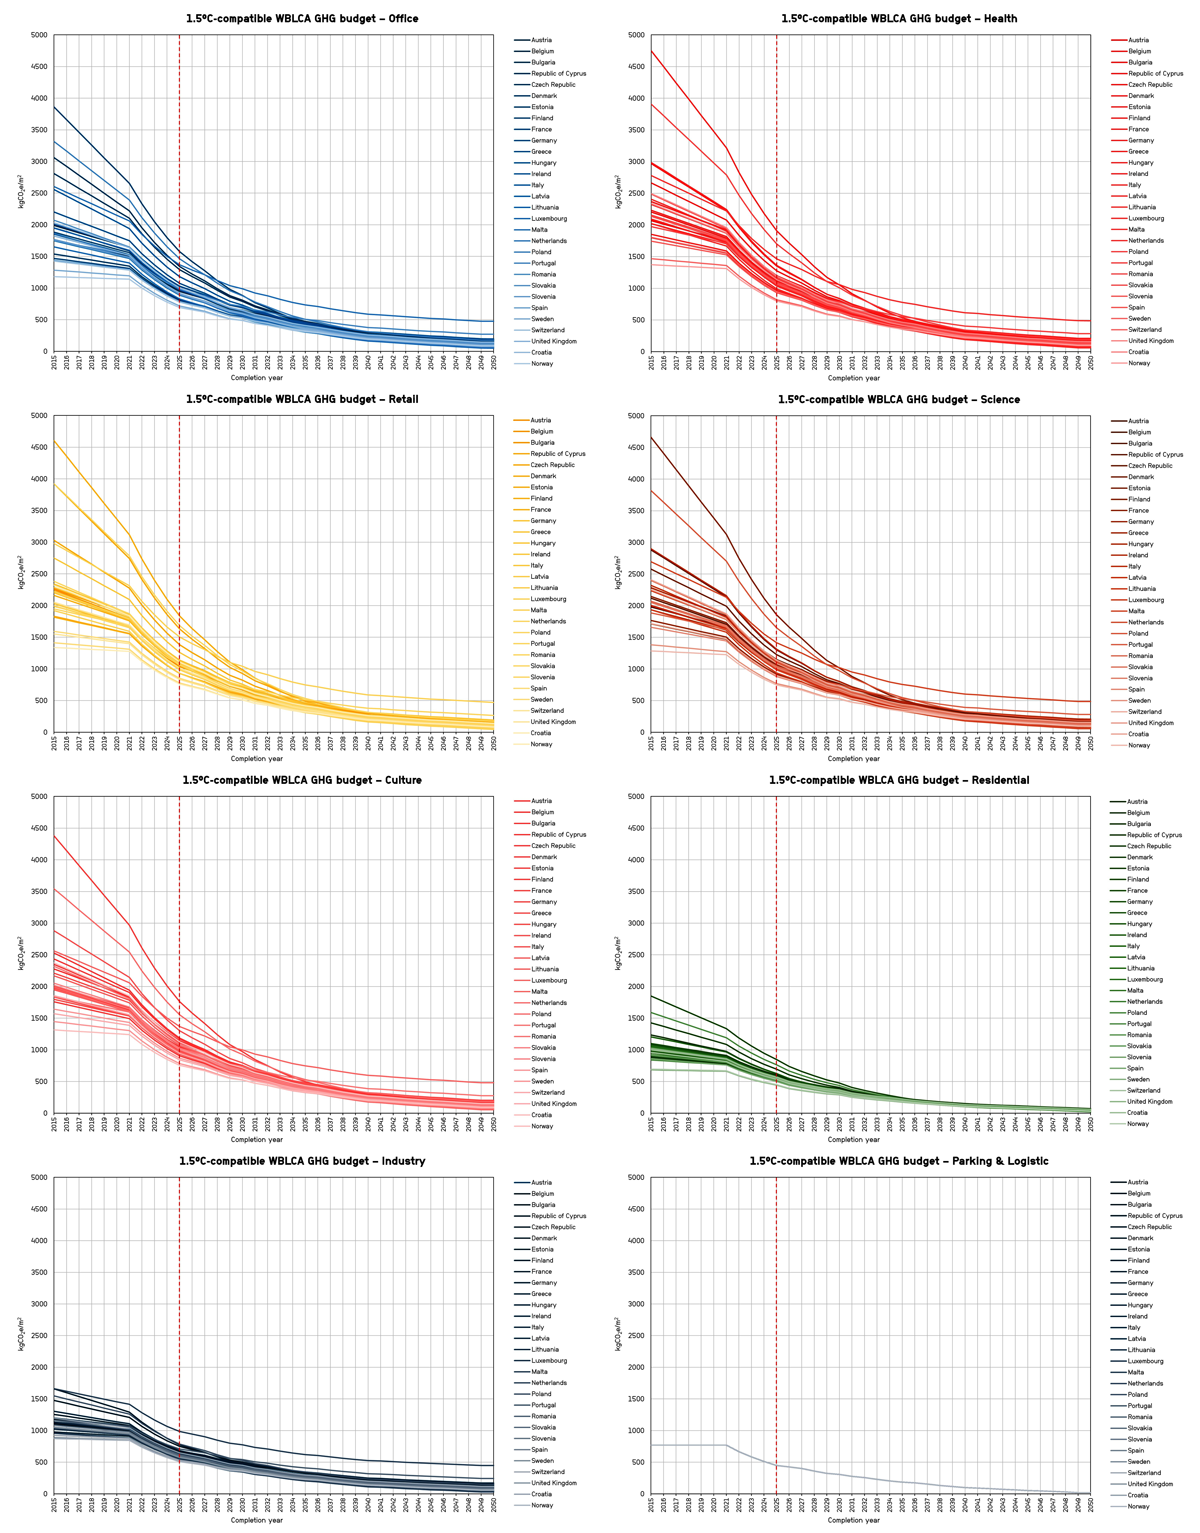
Figure 5
Calculated carbon limits per completion year and usage category across 30 European countries.
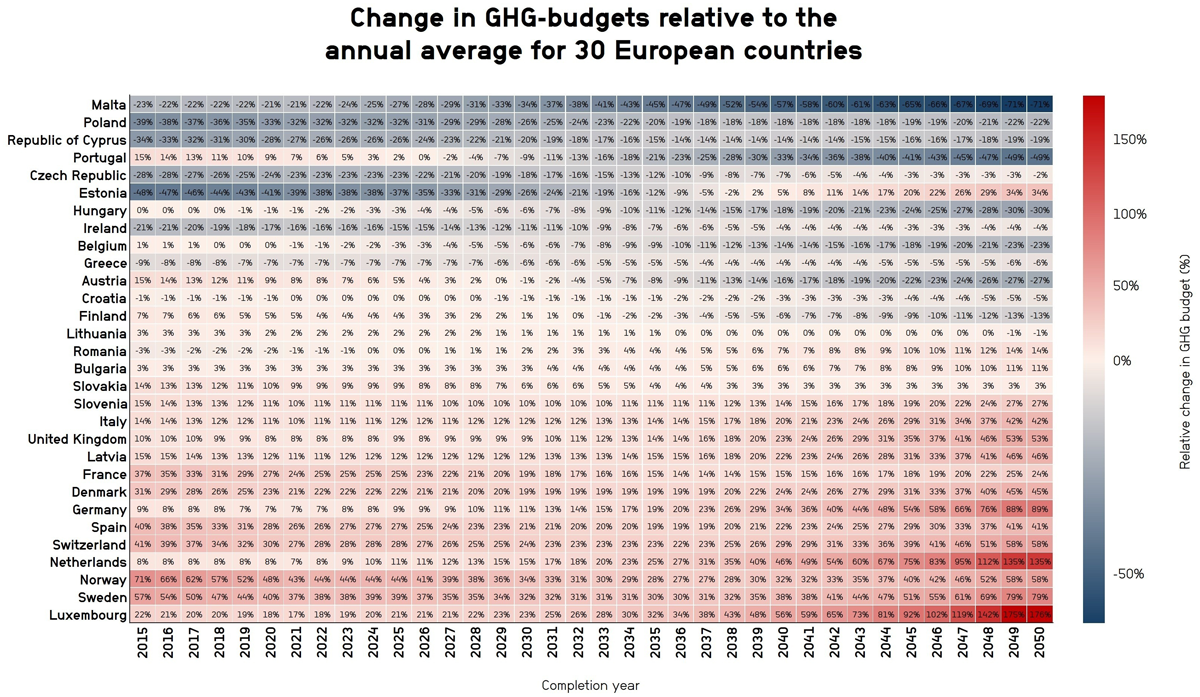
Figure 6
Relative variation in annual national greenhouse gas (GHG) intensity trajectories for the office usage category compared with the average scenario.