
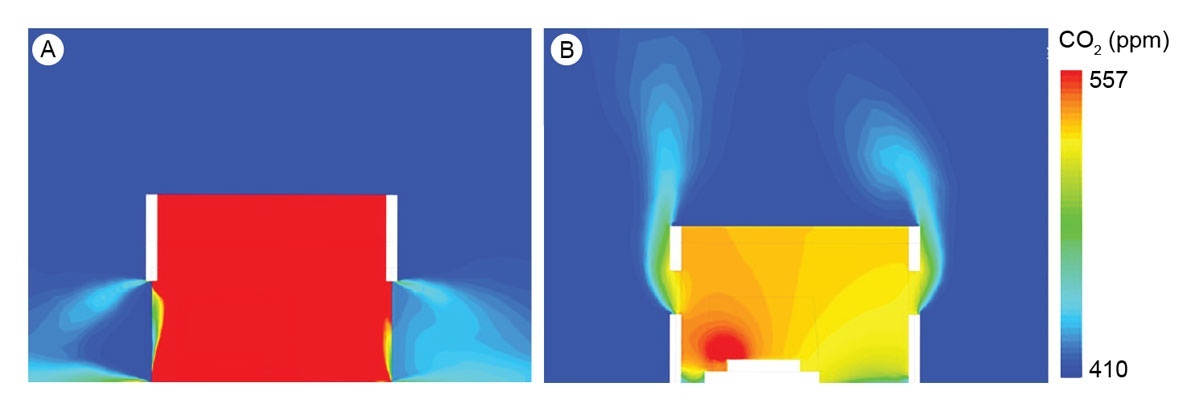
Figure 1
Computational fluid dynamics simulations of CO2 produced from two sleeping adults in unscreened and screened houses with two badly fitting doors in windless conditions.
Note: (i) shows a section through the doors of a house without screened doors or windows and (ii) shows a section through the windows of a house with both screened windows and doors. The simulations show increased concentrations of CO2 leaving through the openings, which could be traceable by host-seeking mosquitoes.
Source: Jatta et al. (2021).
Table 1
Biting behaviours and diseases carried in Africa from the three primary genera of mosquito vectors
| AEDES SPECIES | ANOPHELES SPECIES | CULEX SPECIES |
|---|---|---|
| Morning peak: 06:00–10:00 | Primary peak: 18:00–22:00 | Increased activity at dusk and continues throughout the night |
| Evening peak: 16:00–19:00 | Secondary peak: 03:00–05:00 | Peak biting activity: 22:00–03:00 |
| Yellow fever, dengue, chikungunya, Zika | Malaria, lymphatic filariasis | West Nile fever, Rift Valley fever, lymphatic filariasis |
[i] Note: Exact peak biting times of all mosquito genera can vary depending on the specific species, geographic location, season and environmental conditions.
Sources: Aedes (Chadee 1988, 2013; Muhammad et al. 2020), Anopheles (Sherrard-Smith et al. 2019; Sougoufara et al. 2014), Culex (Chen et al. 2017; Ryan et al. 2017).
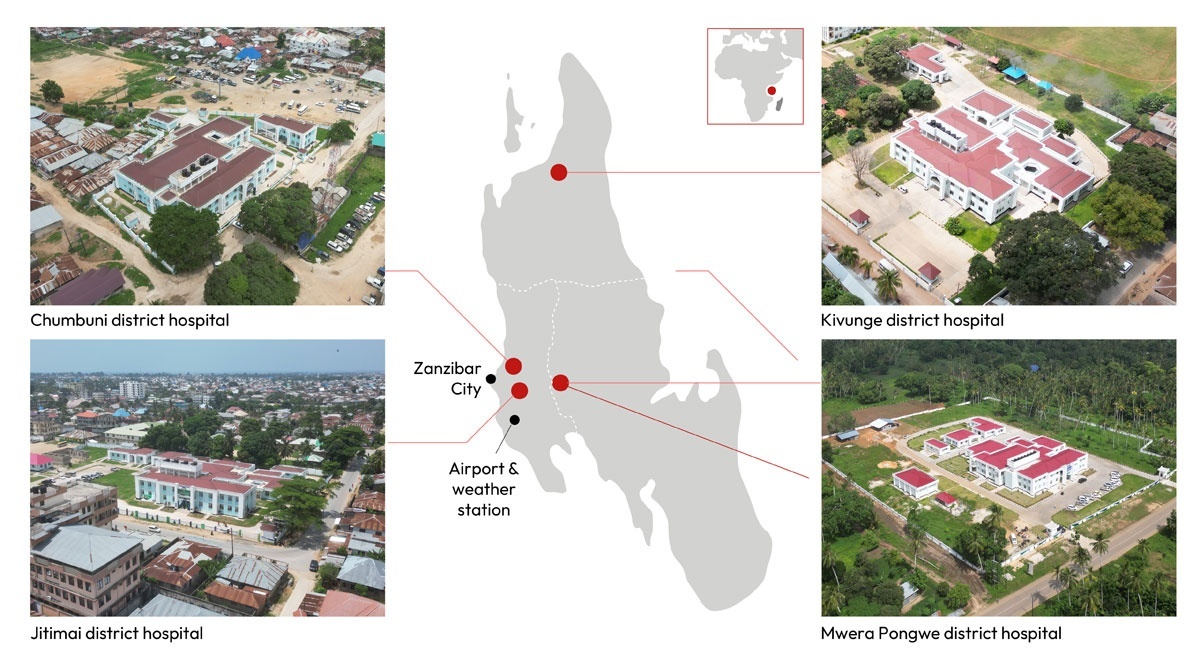
Figure 2
Map of Unguja Island in Zanzibar, showing the locations of the four hospital sites, drone photos of each hospital and airport weather station location.
Source: Author.
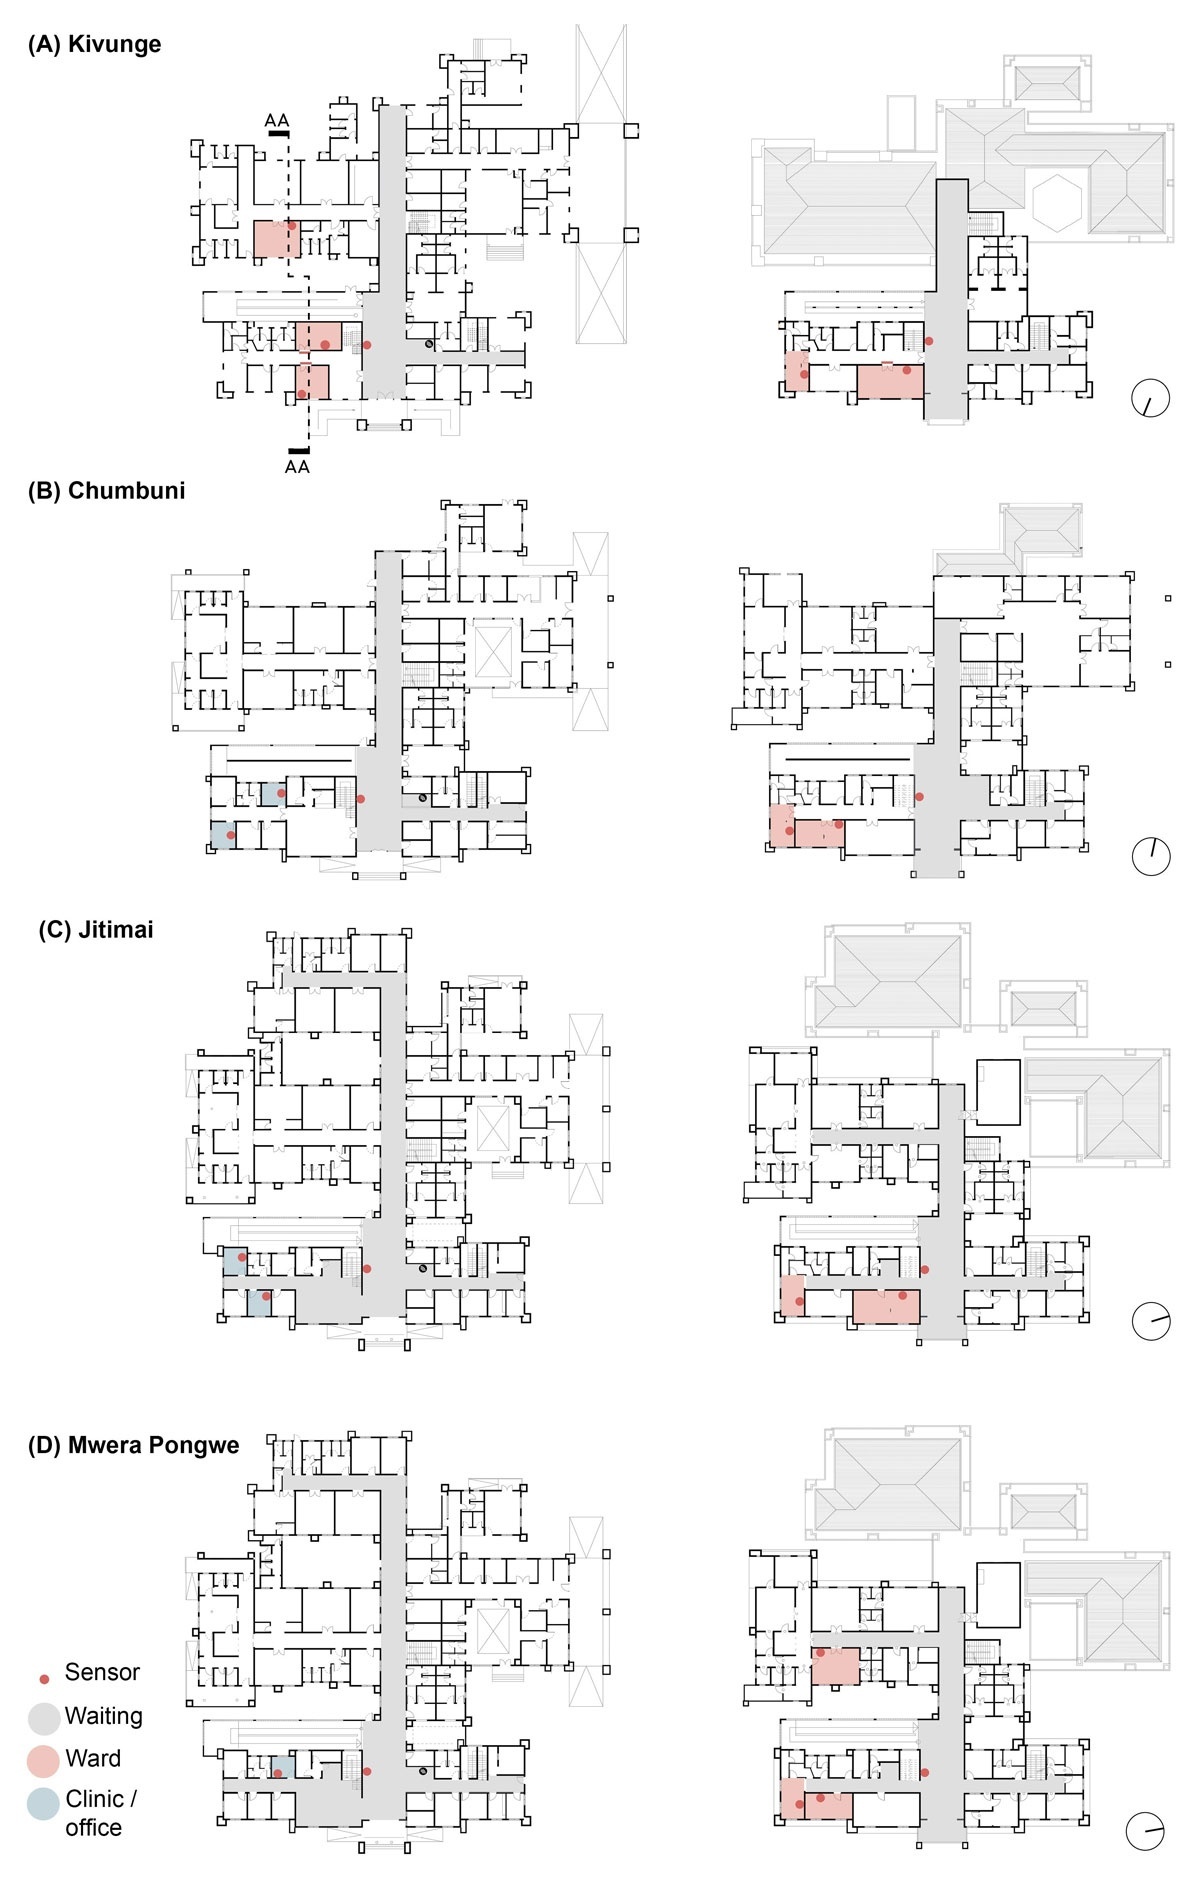
Figure 3
Ground floor (left) and first floor (right) plans of all district study hospitals including sensor locations.
Note: Names of rooms where sensors are located is provided in the supplemental data (file 2: sensor locations).
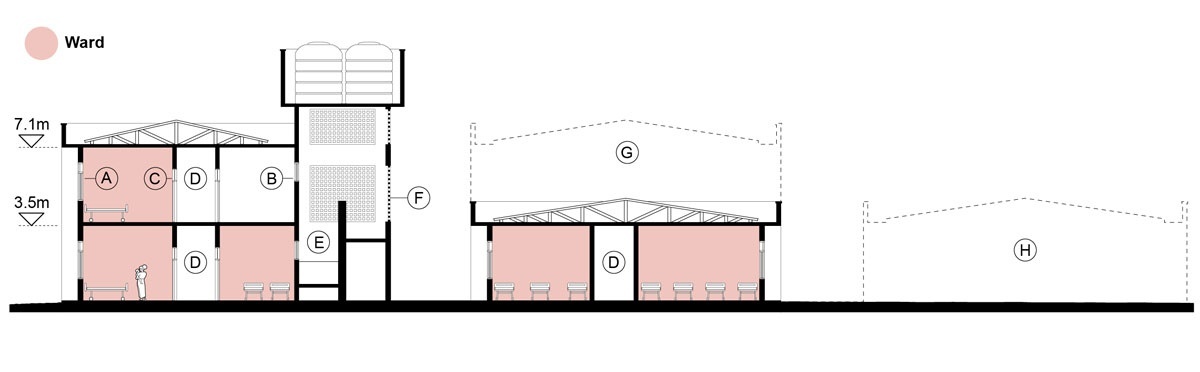
Figure 4
Cross-section AA of Kivunge Hospital (section line shown in Figure 3A).
Note: A = Sliding aluminium window with fly-mesh screen panel; B = Sliding aluminium clerestory window; C = Standard ward door with glazed panel above; D = Double-height stacked corridors; E = Ramp connecting ground-floor waiting area to first floor, with no separating doors; F = Unscreened perforated façade; G = Dashed line indicates additional built area present in Chumbuni, Jitimai and Mwera Pongwe hospitals; H = Dashed line indicates further additional built area in Jitimai and Mwera Pongwe hospitals only, reflecting larger site footprints.
Table 2
Measurement instruments, sensor ranges, accuracy and logging frequencies for indoor environmental monitoring
| VARIABLE | SENSOR OR MEASUREMENT INSTRUMENT | RANGE | ACCURACY | LOGGING FREQUENCY |
|---|---|---|---|---|
| Temperature | Aranet4 PRO | 0–50°C | ±0.3°C | 10 minutes |
| Relative humidity | Aranet4 PRO | 0–85% | ±3% | 10 minutes |
| CO2 | Aranet4 PRO | 0–9999 ppm | ±30 ppm + 3% | 10 minutes |
| Door-opening | Aranet Dry Contact Hour Meter | — | 4.3 sec/day | 1 minute |
| Surface temperature | Flir Edge Pro | –20°C–120°C | ±3°C or ±5% | — |
Table 3
The percentage of mean hourly values for PPD across four study hospitals in Zanzibar
| SENSOR LOCATION | % HOURS WITH PPD < 20% | % HOURS WITH PPD < 50% | % HOURS WITH CO2 PPM > 530 | % HOURS WITH CO2 PPM > 700 |
|---|---|---|---|---|
| Mwera Pongwe Hospital | ||||
| GF – Family Planning (AC) | 7.2% | 91.9% | 11.7% | 1.6% |
| GF – Isolation Ward | 0.6% | 52.3% | 50.8% | 5.9% |
| FF – Surgical Ward | 2.1% | 53.4% | 44.7% | 15.1% |
| FF – Isolation Ward | 12.6% | 66.3% | 17.8% | 3.9% |
| GF – Waiting Room | 28.8% | 89.2% | 60.5% | 0.0% |
| FF – Waiting Room | 23.3% | 75.4% | 2.6% | 0.0% |
| Kivunge Hospital | ||||
| GF – Medical Ward | 0.5% | 40.6% | 70.8% | 26.3% |
| GF – Medical Ward (AC) | 0.0% | 51.8% | 54.3% | 17.7% |
| GF – Surgical Ward | 0.0% | 5.4% | 98.3% | 60.7% |
| FF – Medical Ward | 0.0% | 22.4% | 30.0% | 3.5% |
| FF – Isolation Ward | 0.3% | 26.9% | 9.9% | 0.5% |
| GF – Waiting Room | 7.6% | 81.3% | 5.8% | 0.1% |
| FF – Waiting Room | 16.1% | 75.0% | 4.1% | 0.0% |
| Jitimai Hospital | ||||
| GF – Doctors Room | 0.0% | 31.7% | 34.1% | 12.7% |
| FF – Isolation Ward | 3.8% | 56.8% | 15.8% | 3.2% |
| FF – Medical Ward | 0.0% | 33.9% | 57.1% | 21.3% |
| GF – Office (AC) | 85.6% | 100.0% | 93.3% | 70.0% |
| GF – Waiting Room | 4.8% | 66.9% | 5.3% | 0.0% |
| FF – Waiting Room | 12.0% | 66.2% | 0.0% | 0.0% |
| Chumbuni Hospital | ||||
| GF – Vaccination | 0.7% | 68.5% | 5.3% | 0.9% |
| GF – Family Planning (AC) | 0.0% | 46.6% | 26.4% | 15.3% |
| FF – Isolation Ward | 5.4% | 67.0% | 8.2% | 0.8% |
| FF – Surgical Ward | 1.2% | 45.7% | 41.8% | 15.9% |
| GF – Waiting Room | 17.7% | 83.8% | 15.1% | 0.0% |
| FF – Waiting Room | 34.3% | 82.2% | 0.5% | 0.0% |
[i] Note: The table reports the proportion of hours with PPD below 20% (the ASHRAE 55 standard) and below 50%, as well as the percentage of hours with carbon dioxide (CO2) concentrations exceeding 530 ppm (the estimated threshold detectable by mosquitoes) and 700 ppm. GF = ground floor, FF = first floor.
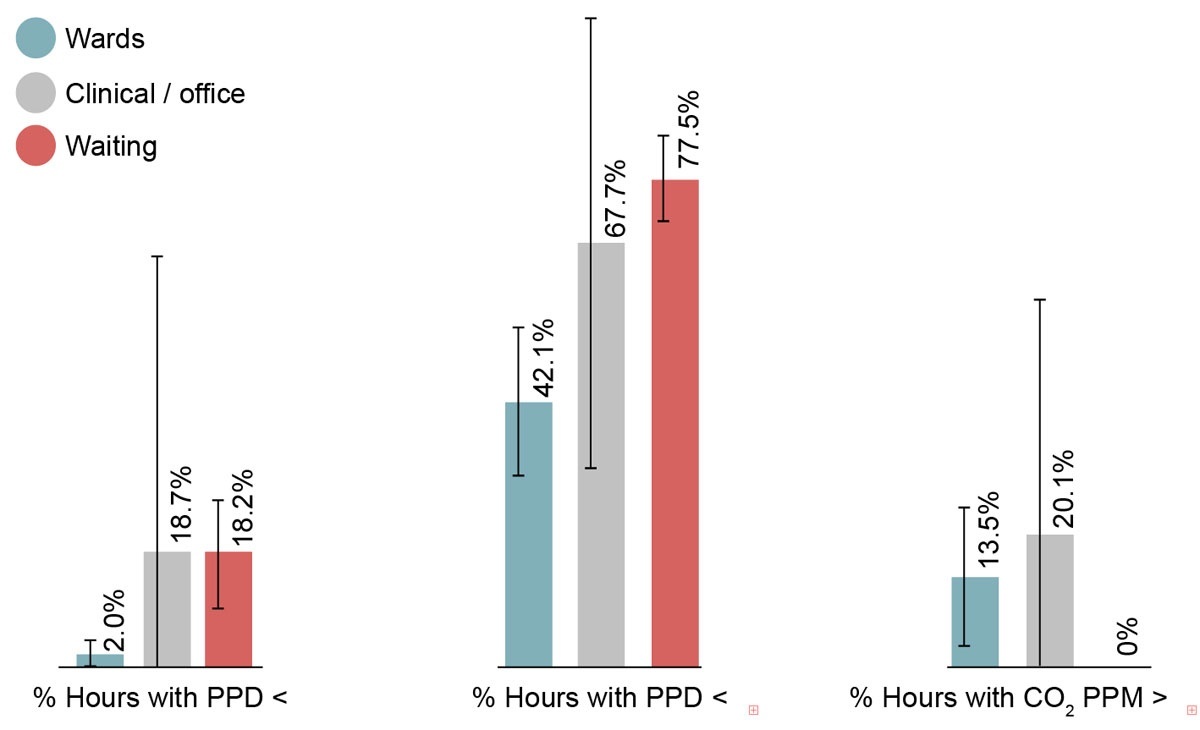
Figure 5
Percentage of hours during the study period in which PPD values fell below 20% and below 50%, and in which CO2 concentrations exceeded 700 ppm, shown across all ward, clinical and office spaces.
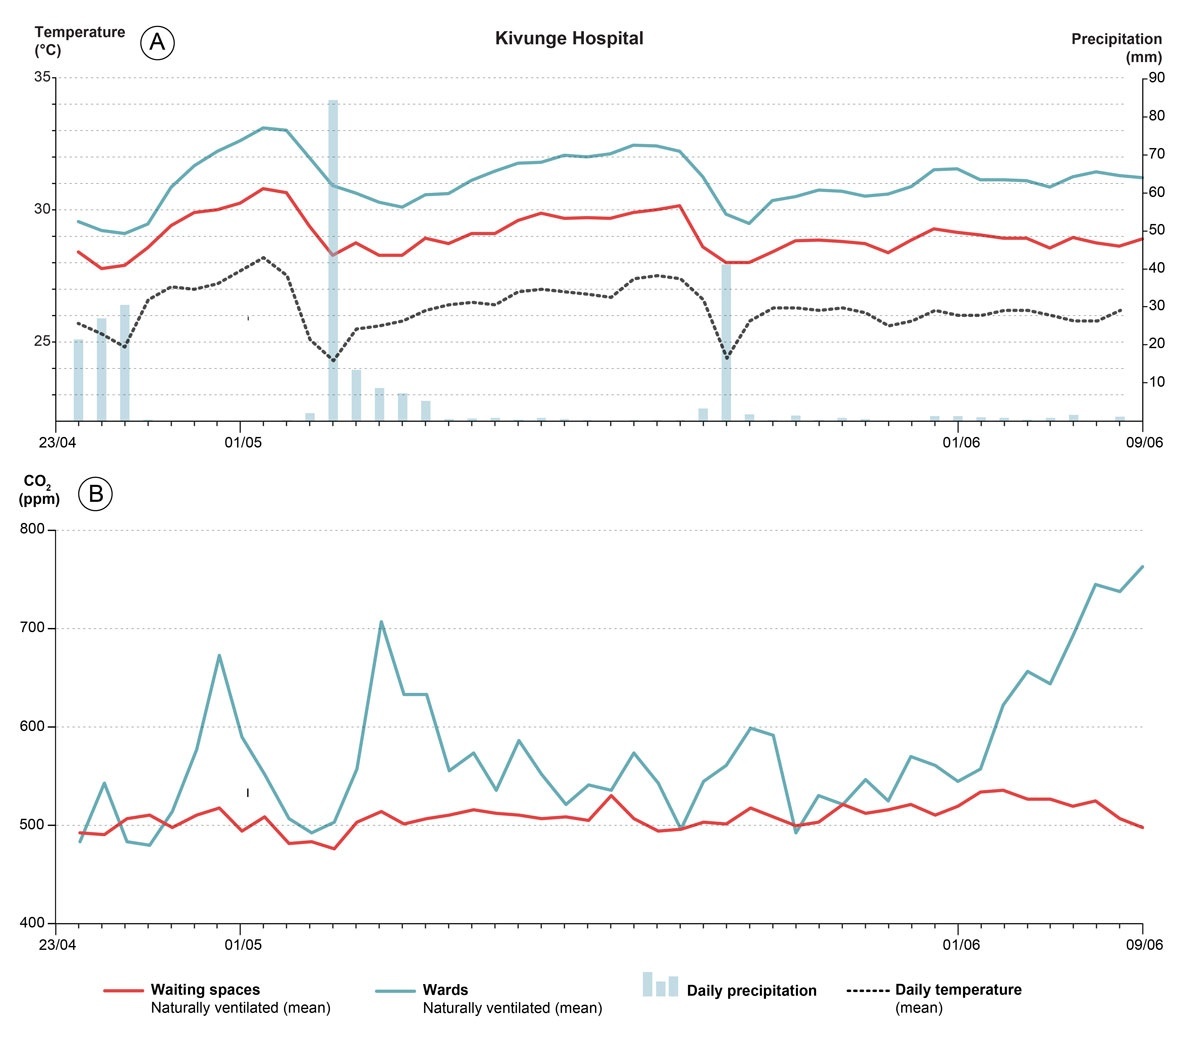
Figure 6
Graph A: mean daily indoor temperature at Kivunge Hospital during the study period, with concurrent weather station data. Graph B: mean daily CO2 levels at Kivunge Hospital during the study period for the same spaces.
Note: The group average for naturally ventilated ward spaces (n = 3) is shown as a blue line and waiting spaces (n = 2) as a red line. The black dashed line indicates mean temperature was recorded at the nearest weather station. Precipitation is shown as a light blue bar chart with axis on the right-hand side.
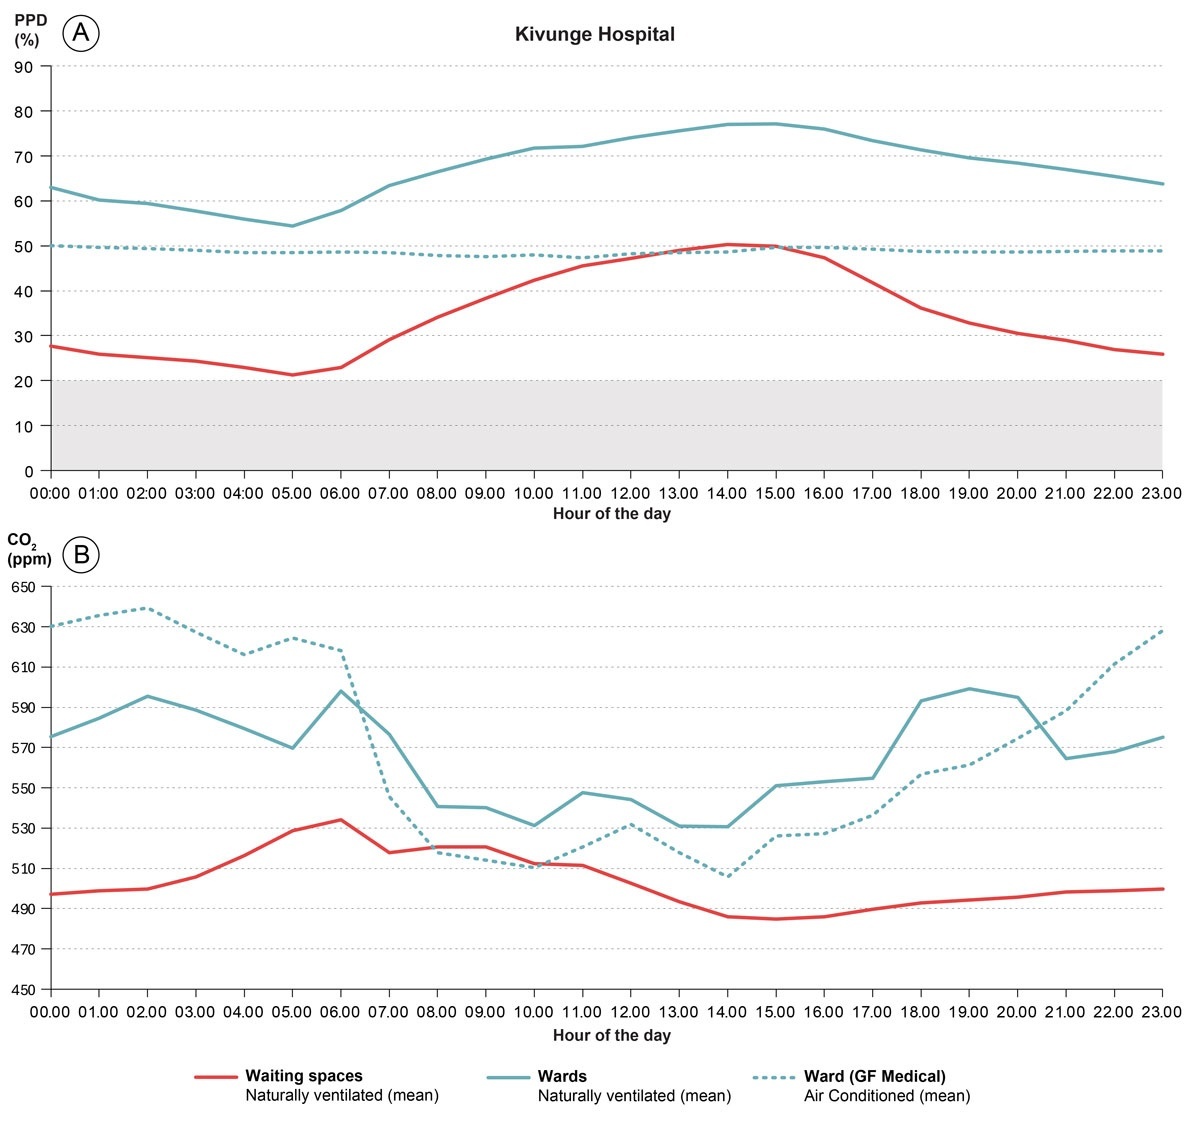
Figure 7
Graph A: group mean average PPD for naturally ventilated wards (n = 3), waiting spaces (n = 2) and the air-conditioned ward (n = 1) for each hour of the 24-hour cycle for Kivunge Hospital only. Graph B mean CO2 levels for each hour of the 24-hour cycle.
Note: The grey hatched area represents the ASHRAE 55 minimum standard (20%).
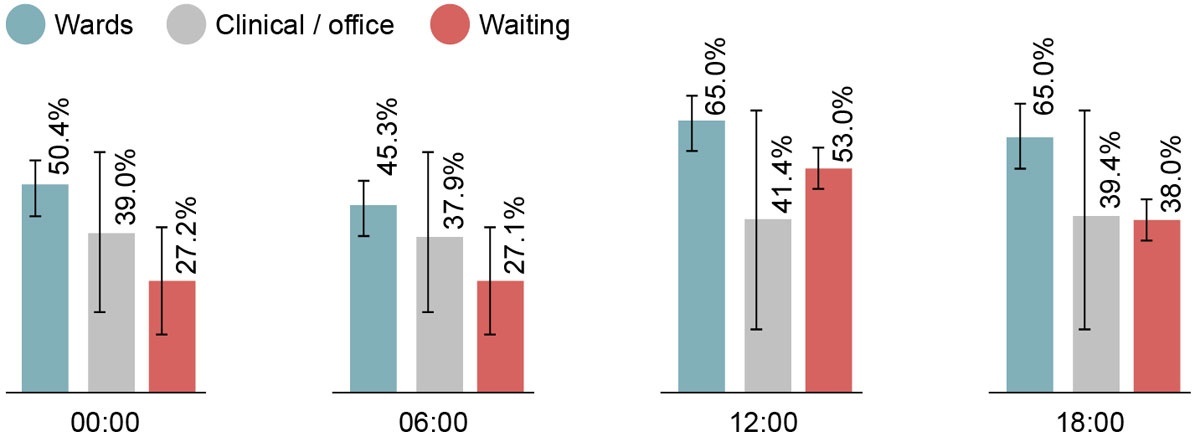
Figure 8
Combined mean hourly percentage for PPD levels across the four hospitals for the ward, office and clinic spaces and waiting spaces at 12am, 6am, 12pm and 6pm.
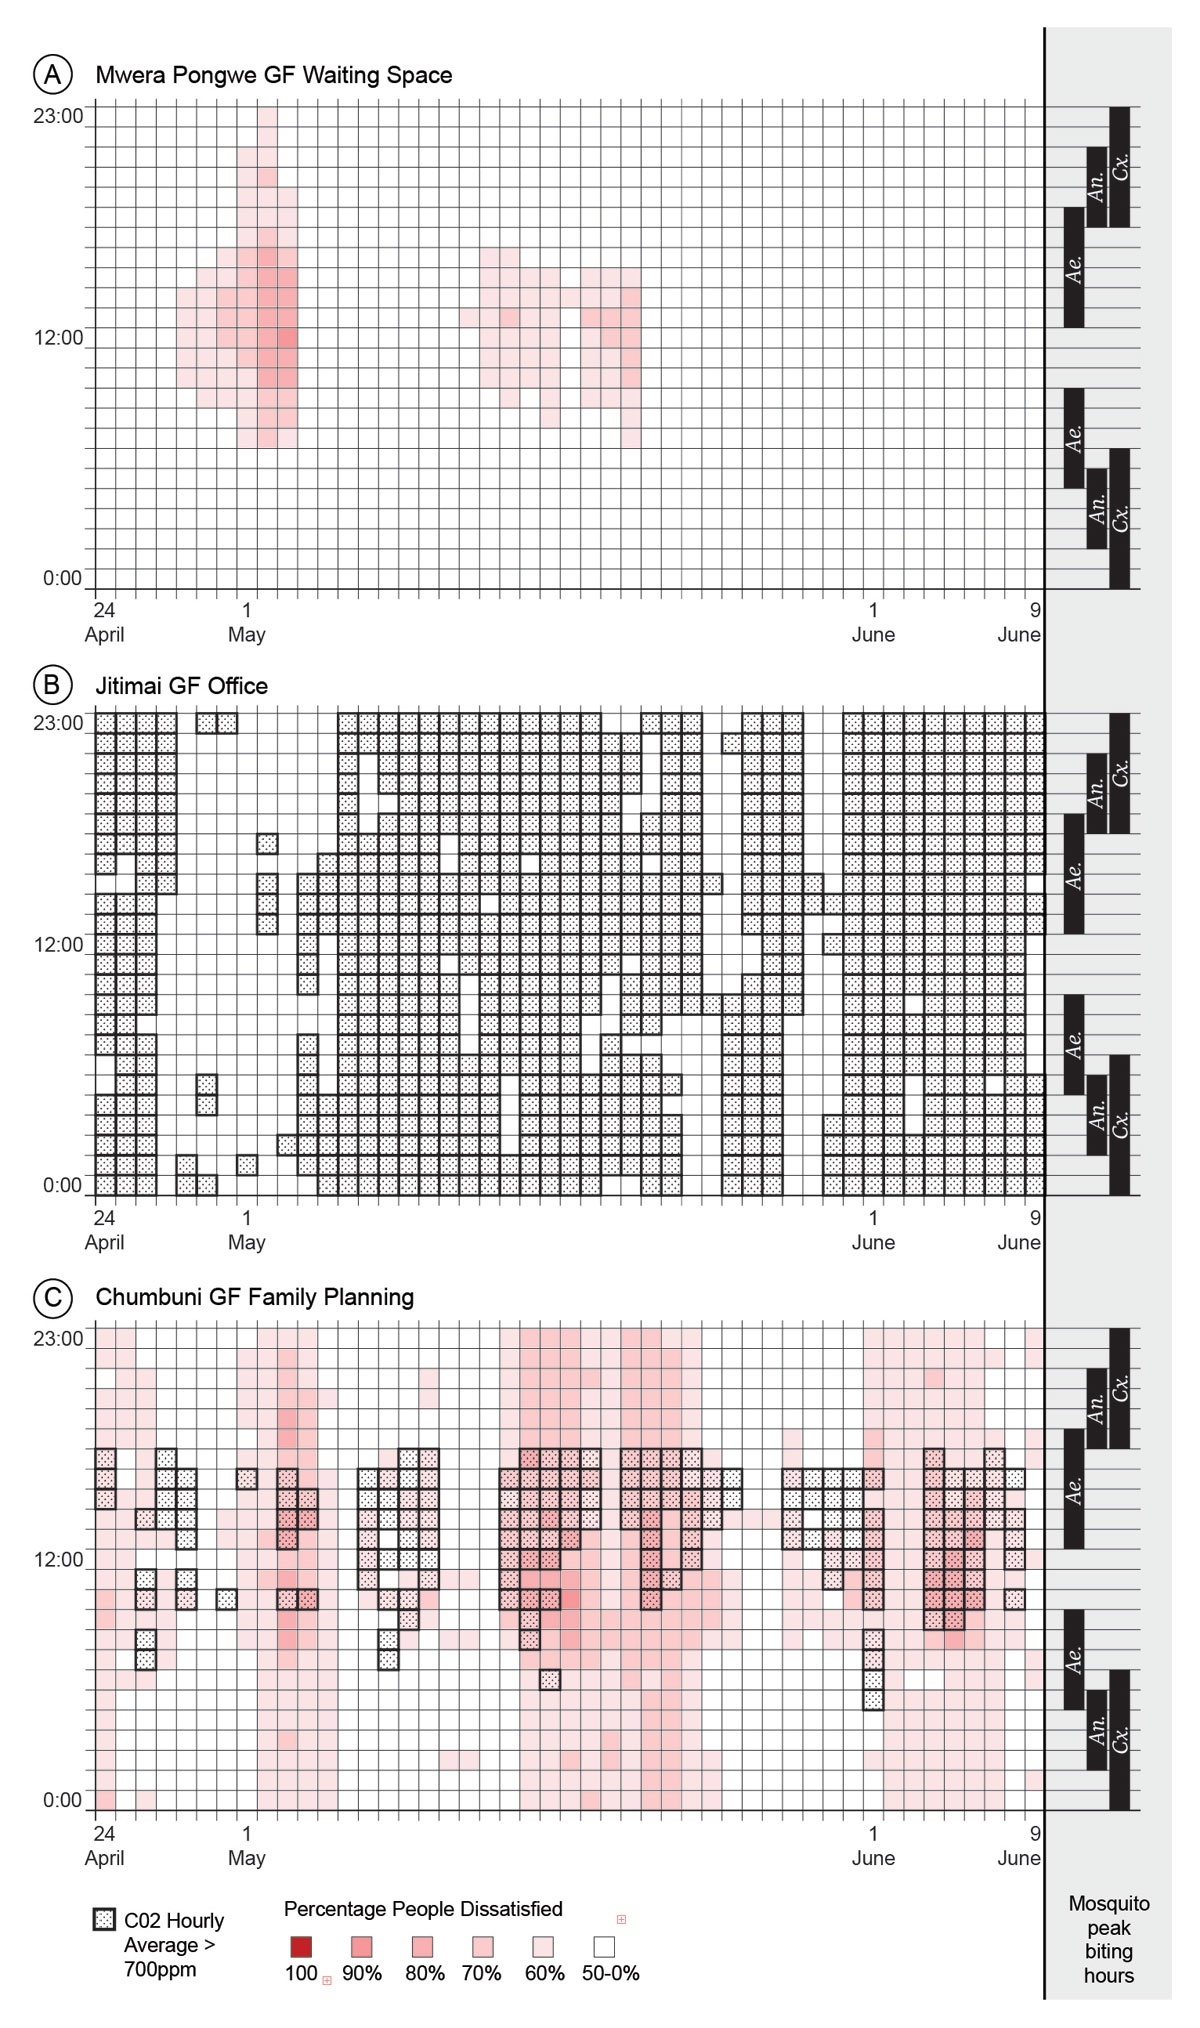
Figure 9
Heatmaps of mean hourly Predicted Percentage of Dissatisfied (PPD) values across the 48-day study period for: (A) Mwera Pongwe Ground Floor Waiting, (B) Jitimai Ground Floor Office and (C) Chumbuni Ground Floor Family Planning.
Note: Each cell represents one hour; days are shown on the x-axis and the 24-hour cycle on the y-axis. PPD values exceeding 50% are shaded pink to red; hours in which CO2 concentrations exceeded 700 ppm are indicated by a dotted black hatched overlay. Peak biting hours for each mosquito species recorded in the study (see Table 1) are indicated on the right-hand y-axis. Ae. = Aedes; An. = Anopheles; Cx. = Culex.
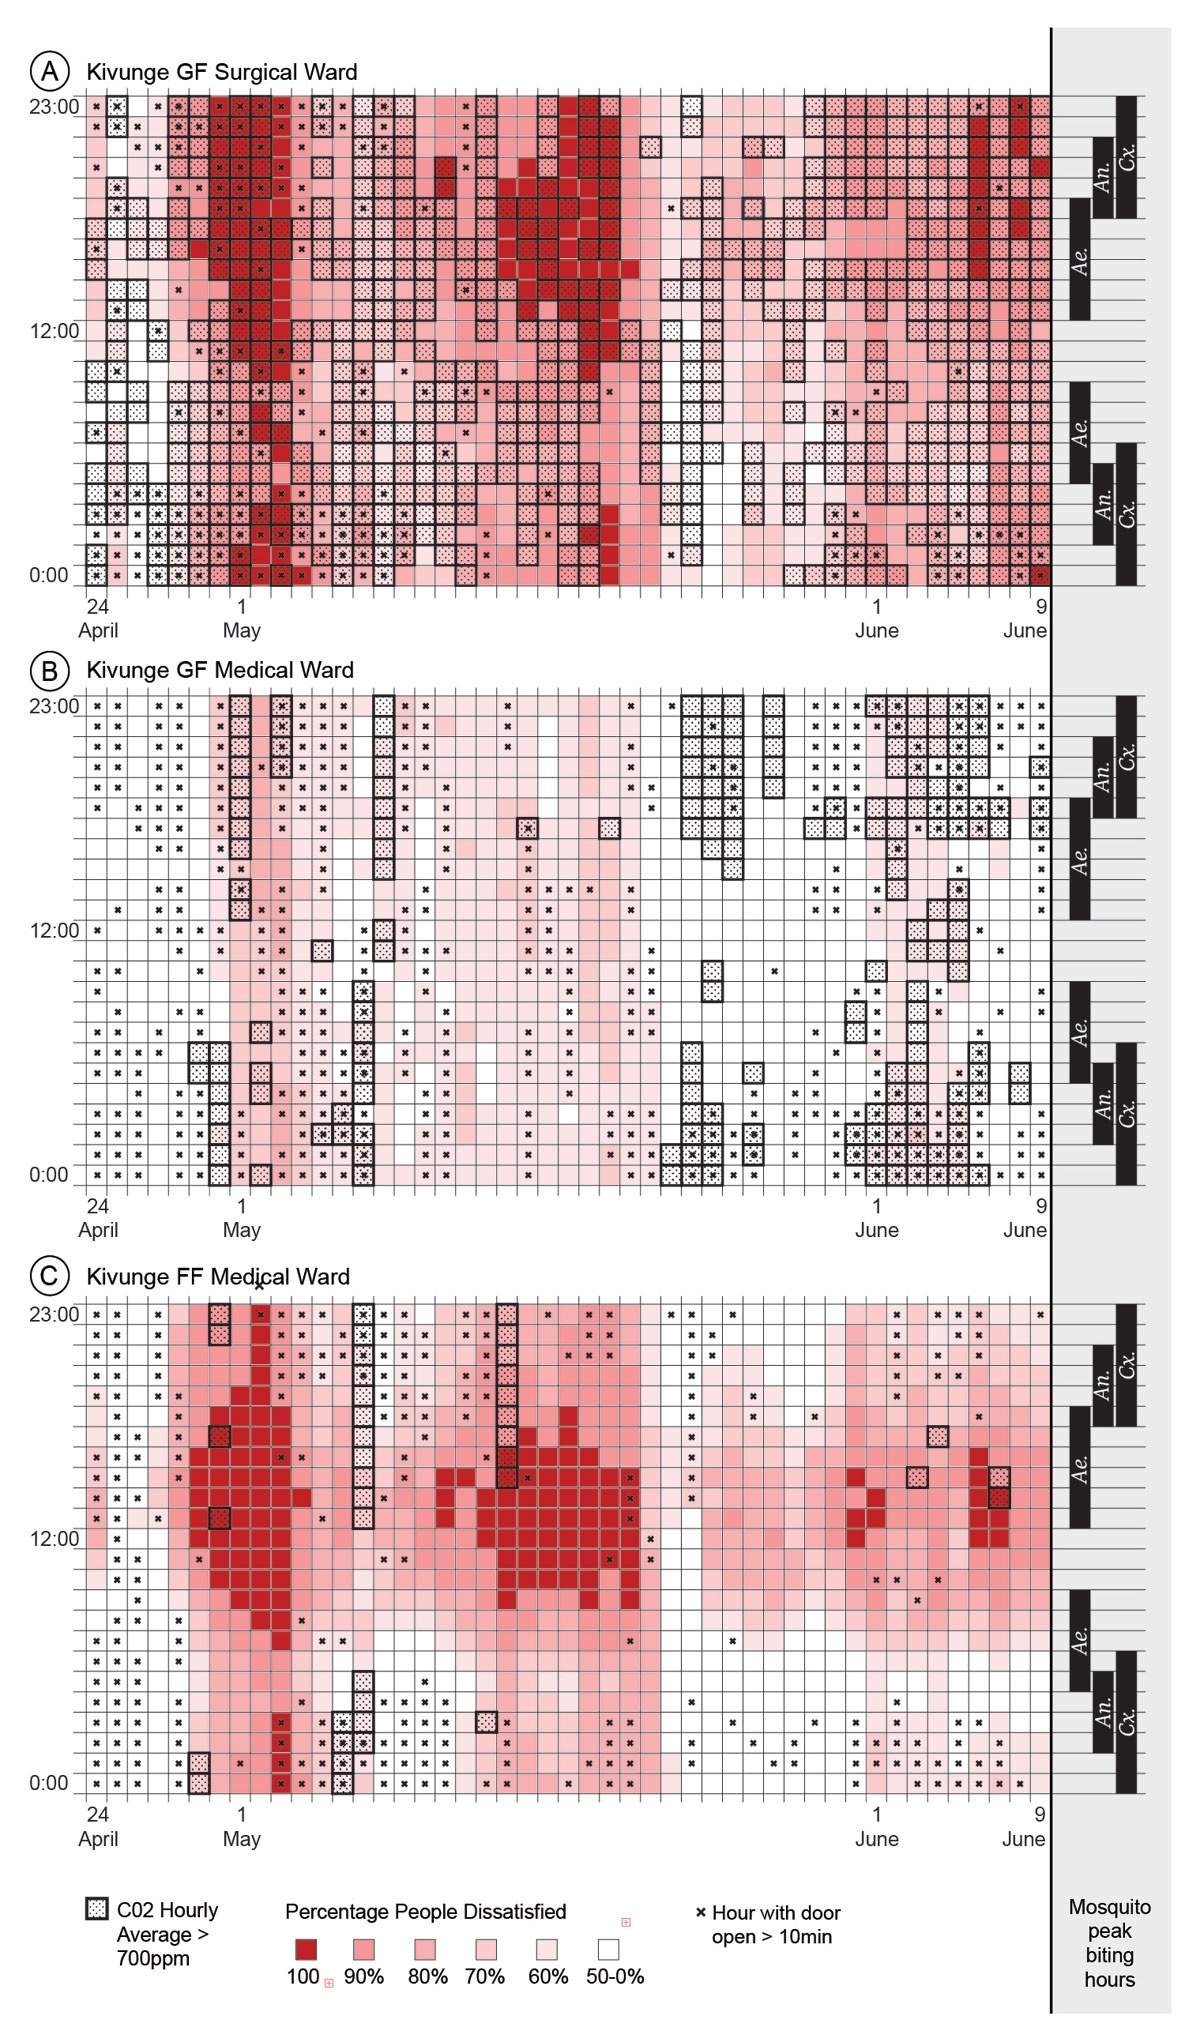
Figure 10
Heatmaps of mean hourly PPD values across the 48-day study period for three wards in Kivunge Hospital where door loggers had been installed.
Note: (A) = Ground Floor Surgical Ward; (B) = Ground Floor Medical Ward; (C) = First Floor Medical Ward. Each cell represents one hour; days are shown on the x-axis and the 24-hour cycle on the y-axis. PPD values exceeding 50% are shaded pink to red; hours in which CO2 concentrations exceeded 700 ppm are indicated by a grey hatched overlay. Hours where the door was open for more than 10 minutes or more than 10 times in the hours are marked with an ‘X’. Peak biting hours for each mosquito species (Ae. = Aedes; An. = Anopheles; Cx. = Culex) are indicated on the right-hand y-axis.
Table 4
Relationship between prolonged door-opening, PPD and CO2 levels in three wards of Kivunge Hospital
| DESCRIPTION OF CORRELATION | GF MEDICAL WARD | FF MEDICAL WARD | GF SURGICAL WARD |
|---|---|---|---|
| Correlation: PPD and door-opening | –0.0447 | –0.2901 | –0.0357 |
| Correlation: CO2 and door-opening | 0.0318 | –0.0879 | 0.0546 |
| Average PPD when door is open | 47.71% | 55.96% | 72.69% |
| Average PPD when door is closed | 48.65% | 68.88% | 74.02% |
| Average CO2 when door is open | 585ppm | 491ppm | 861ppm |
| Average CO2 when door is closed | 573ppm | 508ppm | 814ppm |
| PPD t-test p-value | 0.1291 | < 0.001 | 0.2266 |
| CO2 t-test p-value | 0.2810 | 0.0028 | 0.0638 |
[i] Notes: Prolonged opening is defined as > 10 minutes/hour. Mean PPD and CO2 values are presented for open versus closed door periods, with correlation coefficients and t-test p-values. GF = ground floor, FF = first floor.
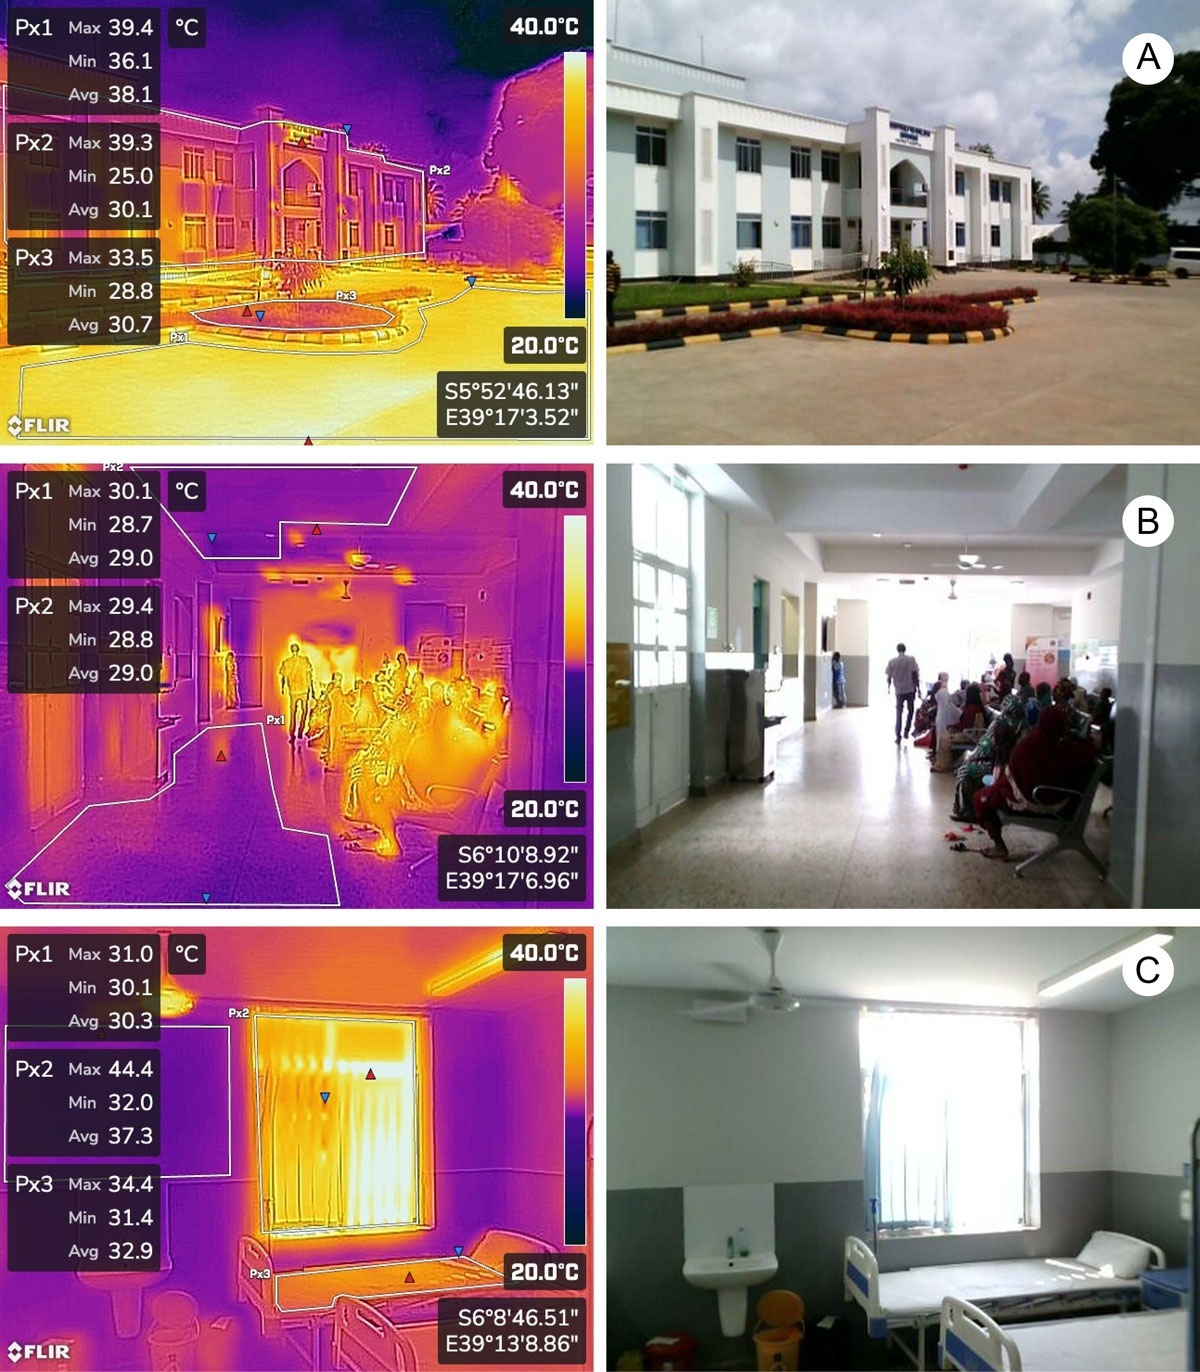
Figure 11
Thermal images indicating sources of heat gain in hospital spaces at three study hospitals, captured on 16 August 2024. (A) = Exterior entrance of Kivunge Hospital, 09:57; (B) = Ground-floor waiting area, Mwera Pongwe Hospital, 08:48; (C) = Ground-floor ward, Chumbuni Hospital, 12:40.
Note: Maximum, minimum and mean surface temperatures are shown for areas delineated by white polylines.
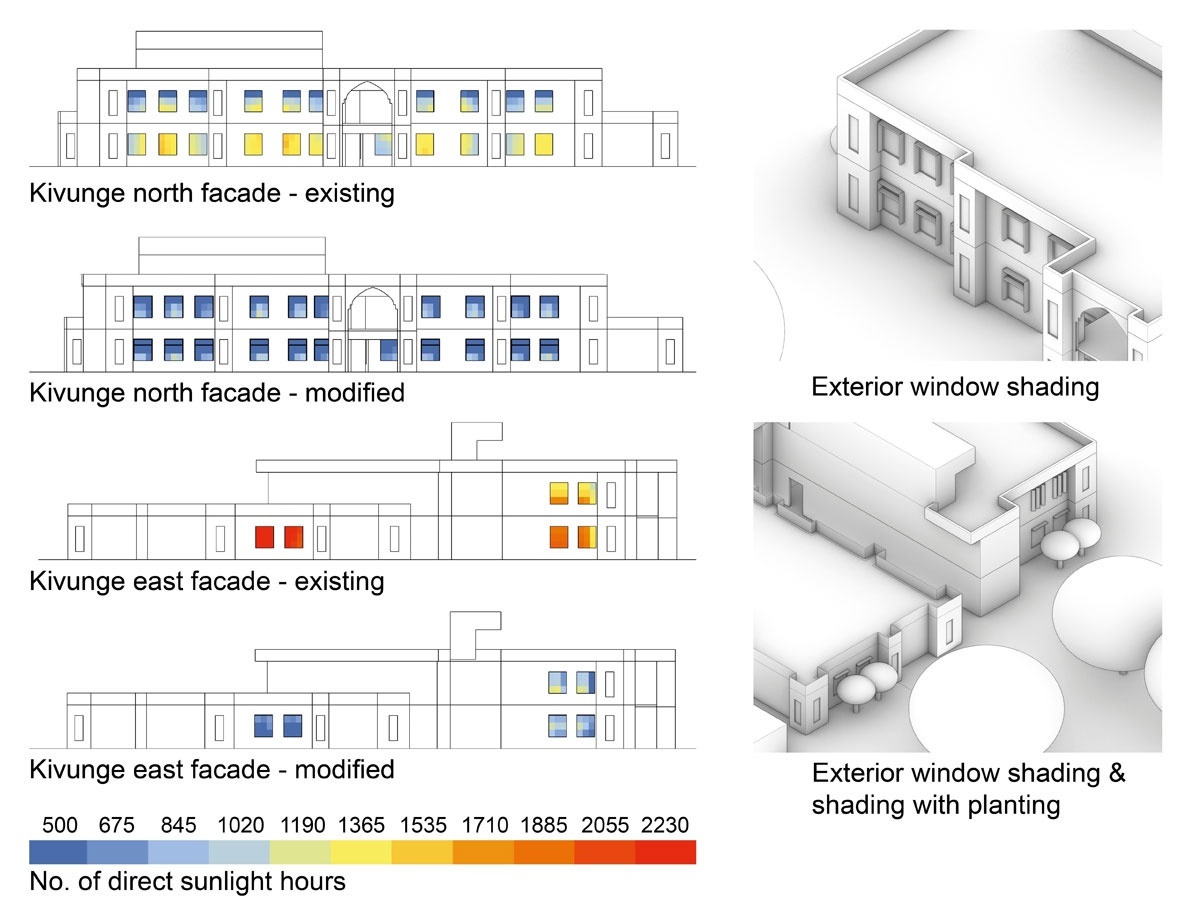
Figure 12
Direct sunlight simulation conducted using Ladybug software for Kivunge Hospital, showing direct sunlight exposure on the windows of the north façade (top) and east façades (bottom), for daylight hours from 06:00 to 18:00 for the full year (4380 hours).
Note: The gradient indicates the number of hours of direct sunlight the surface receives over this period. The modified façades show the addition of exterior shading strategies including horizontal and vertical shading and strategic planting.
Table 5
Feedback from semi-structured interviews with inpatients and relatives describing thermal comfort, fan use and window and door-opening behaviour in hospital wards
| The air is terrible, really terrible. Hot, and the room is small with four people […] and given the condition of those patients, they can’t handle those [ceiling] fans. | Relative of inpatient in Male Ward, Kivunge |
| The air this month has been hot, this is the end of the hot period. But inside there are fans. | Inpatient in Female Ward, Kivunge |
| [It’s] very hot. The fan doesn’t reach here. This ward is supposed to have four fans. | Inpatient in Male Ward, Chumbuni |
| It’s okay. Because the fans are working well, and sometimes we open the windows and let them stand open. We also get fresh air that way. | Inpatient in Female Ward, Mwera Pongwe |
| We close the windows. The doors, not always, because you know, you close it and someone comes in, someone goes out. | Parent of inpatient in Pediatric Ward, Mwera Pongwe |
| Mosquitoes come one by one. You know, the door stays open, people come in and go out – mosquitoes will inevitably enter. But by the time evening comes, we try to close the door ourselves, so it’s manageable. | Inpatient in Female Ward, Kivunge |
Table 6
Feedback from brainstorm workshops with hospital staff, patients and other specialists.
| REASON FOR WINDOWS AND DOORS IN WARDS BEING LEFT OPEN | COUNT |
|---|---|
| Air circulation, fresh air, breeze or ventilation | 22 |
| Access, movement or keeping doors open for patients, staff, equipment or emergencies | 11 |
| Reduce heat, hot weather, lack of cooling or discomfort with fans | 8 |
| Reduce bad smells, odours or chemical smells | 8 |
| Broken or missing screens, windows, doors, locks or closers | 7 |
| Education or low understanding about how to use window screens/closing practices | 5 |
| Habits, forgetting, attitudes or general behaviour | 5 |
| Cleaning-related activities | 4 |
| Increase light | 2 |
| Disease transmission or patient safety concerns | 2 |
| To see the outdoor environment | 1 |
| To reduce dust or get dust out | 1 |
| Children opening doors/windows | 1 |
| Opened to call someone outside the building | 1 |
| To avoid the door being locked | 1 |
| To throw trash outside | 1 |