
1. BACKGROUND
Mosquito-borne diseases (MBDs) like dengue and yellow fever, transmitted by Aedes aegypti mosquitoes, pose an increasing risk in Zanzibar and across sub-Saharan Africa (Weetman et al. 2018). Recent malaria outbreaks spread by Anopheline mosquitoes have been reported in Zanzibar (Kooiman et al. 2025; Nachilongo 2024) and the archipelago has a long history of lymphatic filariasis spread by Culex quinquefasciatus (Jones et al. 2012). Studies using models incorporating climate change scenarios to predict emerging risk areas for dengue epidemics anticipate that coastal regions of Tanzania, including Zanzibar, will remain at high risk for dengue epidemic through to 2050 (Mweya et al. 2016). MBD transmission risk in Zanzibar is compounded by limited local infrastructure for MBD detection, management and control (Saleh et al. 2021, 2022) and by a high volume of incoming travellers from mainland Tanzania and abroad, raising the risk of MBD importation (Le Menach et al. 2011; Muller et al. 2025). Hospitals in Zanzibar may represent a particularly high-risk setting for MBD transmission. Studies from contexts with comparable climates and health care environments demonstrate that MBDs may spread between infectious patients and into the communities they serve (Almeida-Nunes et al. 2016; Candida-Silva et al. 2026; Chiuya et al. 2021; Ehelepola & Wijesinghe 2018; Krokovsky et al. 2022).
Between 2022 and 2023, the Revolutionary Government of Zanzibar undertook its largest health care infrastructure upgrade in recent history. Nine new district hospitals of the same design and one regional hospital were constructed across the archipelago’s three main islands, funded by an International Monetary Fund Rapid Credit Facility to support Tanzania’s COVID-19 recovery plans (National Audit Office 2023). These new district hospitals represent both a significant improvement to health care access in Zanzibar and a critical opportunity to address MBD transmission risk and develop preventative interventions that could be scaled across multiple hospital sites.
The interplay between mosquito behaviour, ventilation and thermal comfort may influence MBD transmission in hospitals. Thermal comfort is defined as the condition of mind expressing satisfaction with the thermal environment encompasses temperature, humidity, air movement and radiant heat. Thermal comfort is influenced by building design through factors such as shading, window opening size and placement, thermal mass and insulation (Bradshaw 2010). Thermal discomfort may reduce bednet use (Pulford et al. 2011) and drive behavioural adaptations such as window- and door-opening (Arsad et al. 2023), inadvertently creating entry points for mosquitoes. The Predicted Percentage of Dissatisfied (PPD) index, used in this study to quantify thermal comfort, estimates the proportion of occupants likely to be dissatisfied with these conditions.
The concentration of CO2 can be used to assess ventilation in hospital settings (Ha et al. 2022). Inadequate ventilation further compounds the risk of MBD transmission by enabling the accumulation of airborne mosquito attractants, including odour and CO2 molecules (Carrasco-Tenezaca et al. 2023; Mmbando et al. 2022). Mosquitoes can detect CO2 levels as low as 108 to 133 ppm above ambient levels (Grant and O’Connell. 2007) and computational fluid dynamics simulations, as shown in Figure 1, demonstrate that this accumulation may create areas of increased attractant concentration near building envelope openings like doors and windows, potentially guiding mosquitoes to human hosts (Jatta et al. 2021).
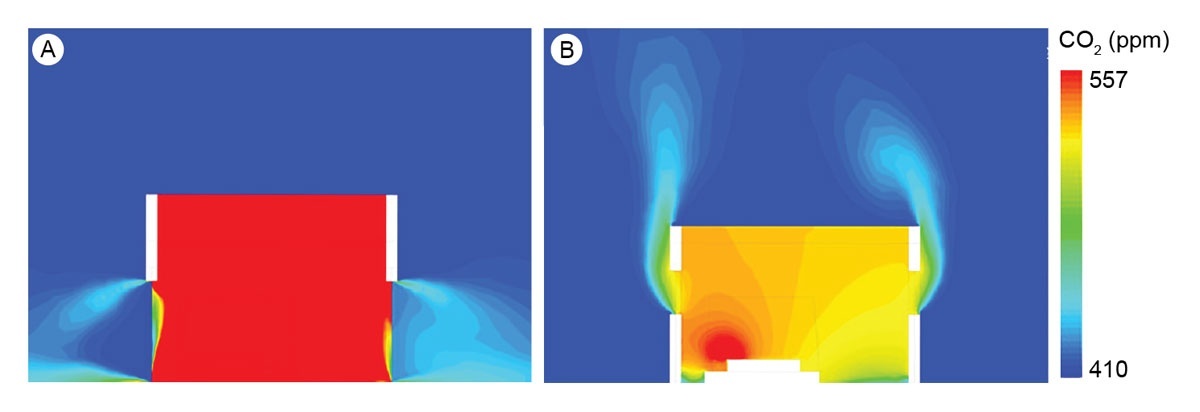
Figure 1
Computational fluid dynamics simulations of CO2 produced from two sleeping adults in unscreened and screened houses with two badly fitting doors in windless conditions.
Note: (i) shows a section through the doors of a house without screened doors or windows and (ii) shows a section through the windows of a house with both screened windows and doors. The simulations show increased concentrations of CO2 leaving through the openings, which could be traceable by host-seeking mosquitoes.
Source: Jatta et al. (2021).
The biting activity of mosquitoes varies by genus and species across the 24-hour cycle. For example, Anopheles spp. and Culex spp. are typically more active at dusk and nighttime hours (Sherrard-Smith et al. 2019; Sougoufara et al. 2014; Chen et al. 2017; Ryan et al. 2017), while Aedes spp. are most active in the daytime during early morning and late afternoon (Chadee 1988, 2013; Muhammad et al. 2020). Peak mosquito biting hours for Aedes, Anopheles and Culex genera, drawn from entomological literature, are summarised in Table 1. Biting risk is exclusive to adult female mosquitoes, which require blood meals to support egg development as part of a life-cycle comprising egg, larval, pupal and adult stages (Clements 2011). Notably, hours of peak biting activity may coincide with periods of thermal discomfort in hospital wards, when behavioural adaptations such as window- and door-opening could increase mosquito entry risk.
Table 1
Biting behaviours and diseases carried in Africa from the three primary genera of mosquito vectors
| AEDES SPECIES | ANOPHELES SPECIES | CULEX SPECIES |
|---|---|---|
| Morning peak: 06:00–10:00 | Primary peak: 18:00–22:00 | Increased activity at dusk and continues throughout the night |
| Evening peak: 16:00–19:00 | Secondary peak: 03:00–05:00 | Peak biting activity: 22:00–03:00 |
| Yellow fever, dengue, chikungunya, Zika | Malaria, lymphatic filariasis | West Nile fever, Rift Valley fever, lymphatic filariasis |
[i] Note: Exact peak biting times of all mosquito genera can vary depending on the specific species, geographic location, season and environmental conditions.
Sources: Aedes (Chadee 1988, 2013; Muhammad et al. 2020), Anopheles (Sherrard-Smith et al. 2019; Sougoufara et al. 2014), Culex (Chen et al. 2017; Ryan et al. 2017).
Despite this potential link between thermal comfort, ventilation and MBD transmission, empirical data on indoor climatic conditions from hospital buildings in tropical Africa remain scarce (Beauchamp-Davies et al. 2026), leaving the relationship between building design and MBD transmission risk poorly understood.
The main objective of this exploratory pilot study was to investigate how building design, thermal comfort, ventilation and human behaviour may affect the risk of MBD transmission in hospital settings in Zanzibar. This study was conducted as a precursor to a longer-term pre–post study evaluating co-created interventions designed to reduce MBD transmission risk across the same hospitals (The MBD-Free Project; Sloan Wood et al. 2025; see also https://vimeo.com/1130826797).
Specifically, thermal comfort (PPD) and ventilation (CO2 levels) were assessed across different hospital space types, and the relationship between PPD, CO2 levels and door-opening frequency was examined during the peak biting hours identified in the literature of Aedes, Anopheles and Culex mosquitoes, respectively. Direct sunlight simulations and thermal imaging were additionally used to identify how building design influenced thermal comfort, and to explore possible shading adaptations to reduce heat gains.
2. MATERIALS AND METHODS
2.1 STUDY DESIGN
The study employed a longitudinal observational design to assess environmental conditions and thermal comfort in four district hospitals in Zanzibar over a 48-day period. The research integrated continuous indoor climate monitoring with analyses of door-opening events, solar radiation simulations and thermal imaging.
2.2 STUDY SITE
Zanzibar is composed of two islands, Unguja and Pemba, which are situated in the south-western Indian Ocean off the east coast of Tanzania. The study was conducted at four district hospitals: Kivunge, Mwera Pongwe, Jitimai and Chumbuni, located on Unguja island (see Figure 2).
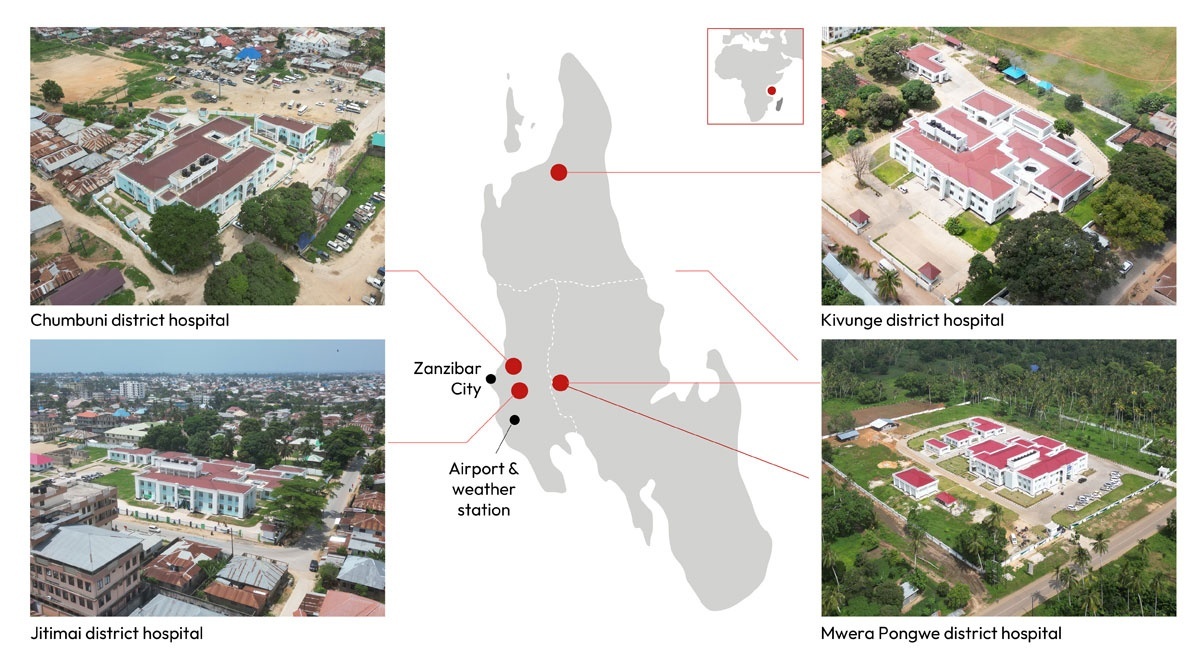
Figure 2
Map of Unguja Island in Zanzibar, showing the locations of the four hospital sites, drone photos of each hospital and airport weather station location.
Source: Author.
2.3 CLIMATE
Unguja island has a tropical humid climate. Seasonal variation is driven by two distinct rainy seasons, the long rains (masika, March–May) (Kijazi & Reason 2005) and the short rains (vuli, October–December) (Osima & Kijazi 2020). Average monthly temperature data, collected from Zanzibar weather station located at Zanzibar airport, show lows ranging from 20.5 to 24.1°C (June to August) and highs of between 31.6 and 33.0°C (December to February) (Adam et al. 2020).
2.4 DESCRIPTION OF STUDY HOSPITAL SITES
The four selected hospitals, built between 2022 and 2023, share the same design with minor differences in spatial configuration. Chumbuni and Jitimai District Hospitals are located in the more densely populated Urban West Region, close to Zanzibar’s urban centre. Kivunge District Hospital is situated in a rural town in the North Region, on a site shared with older hospital buildings and surrounded by some housing and institutional buildings. Mwera Pongwe District Hospital, in the South Region, is the most isolated of the four study hospitals, set largely within farmland. The main construction consists of a concrete frame with concrete foundation and floor, ceiling slabs and concrete block walls. The study hospitals are arranged over two storeys, with central waiting areas off the main entrance that lead to double-stacked corridors, from which wards, offices and clinical spaces are accessed (see Figures 3 and 4). External windows in the wards are multipanel aluminium sliding with a sliding fly-mesh panel, allowing half the window area to be fully open or screened. The hospitals are primarily passively cooled, assisted by ceiling fans located in the centre of spaces, with air conditioning units installed in some clinical and office areas.
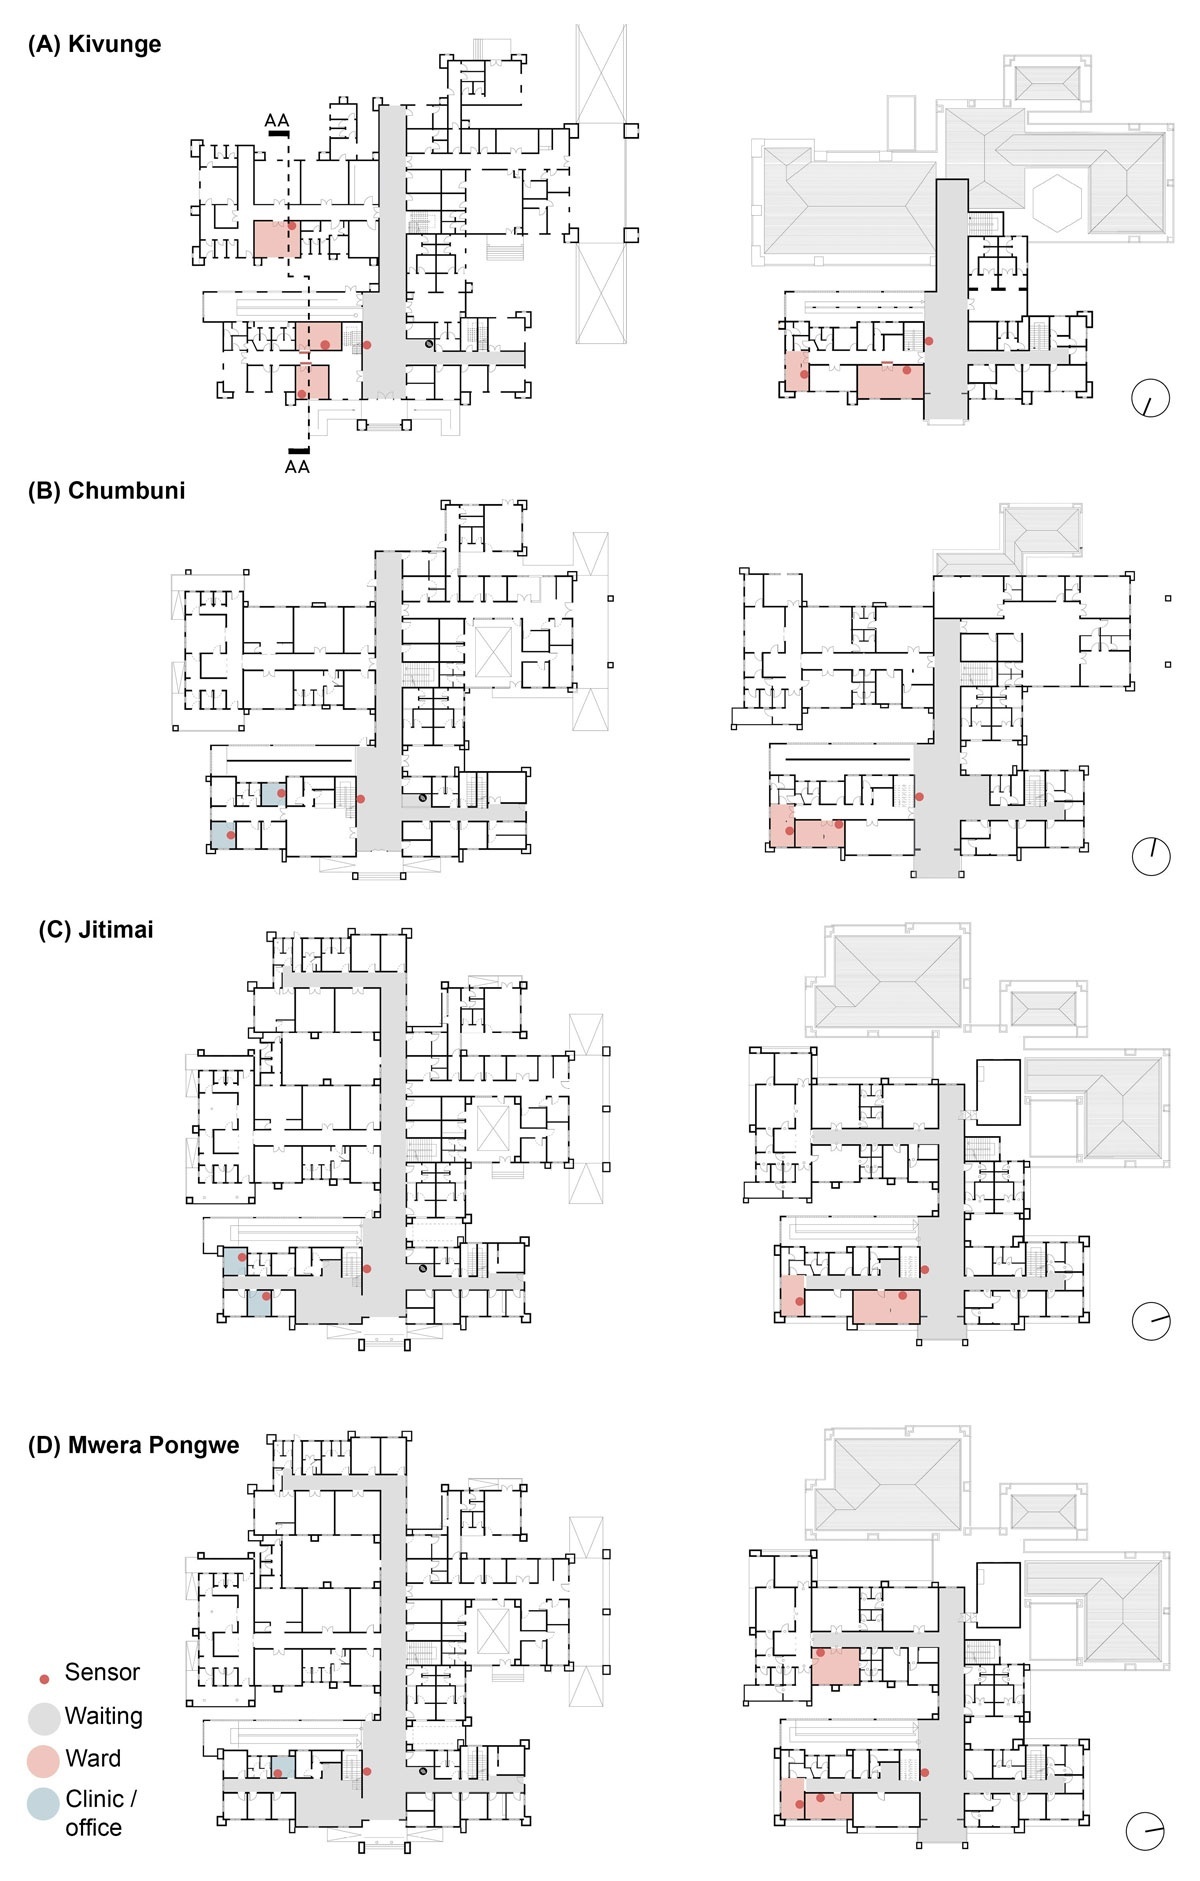
Figure 3
Ground floor (left) and first floor (right) plans of all district study hospitals including sensor locations.
Note: Names of rooms where sensors are located is provided in the supplemental data (file 2: sensor locations).
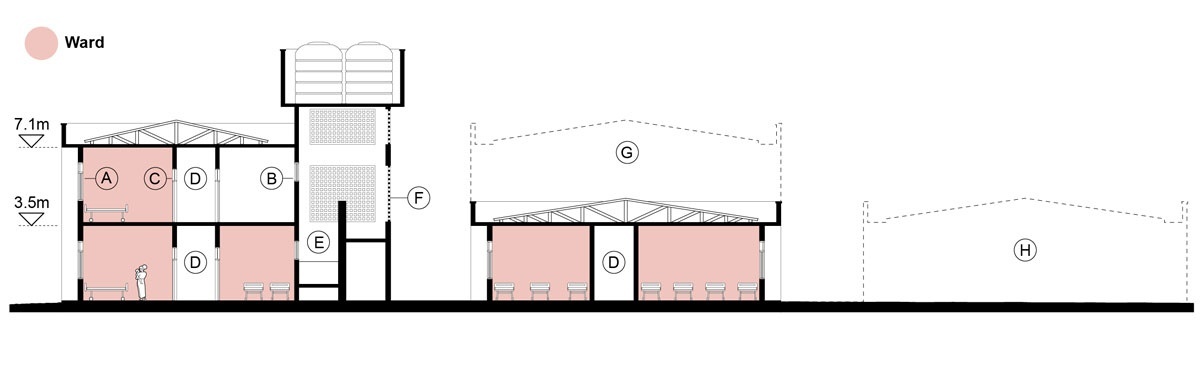
Figure 4
Cross-section AA of Kivunge Hospital (section line shown in Figure 3A).
Note: A = Sliding aluminium window with fly-mesh screen panel; B = Sliding aluminium clerestory window; C = Standard ward door with glazed panel above; D = Double-height stacked corridors; E = Ramp connecting ground-floor waiting area to first floor, with no separating doors; F = Unscreened perforated façade; G = Dashed line indicates additional built area present in Chumbuni, Jitimai and Mwera Pongwe hospitals; H = Dashed line indicates further additional built area in Jitimai and Mwera Pongwe hospitals only, reflecting larger site footprints.
Three hospital space typologies were studied: inpatient wards, waiting areas and outpatient clinical and office spaces. Three inpatient ward subtypes were monitored: medical wards, providing general inpatient care for patients with a range of medical conditions; surgical wards, accommodating patients awaiting or recovering from surgical procedures; and isolation wards, designated for patients with communicable diseases or used as overflow capacity when no infectious patients are present.
2.5 INDOOR CLIMATE AND DOOR-OPENING DATA COLLECTION
Indoor climatic data were recorded in 25 spaces across the four study hospitals. Indoor air temperature (°C), relative humidity (%) and CO2 concentration (ppm) were recorded in each space using a single Aranet4 PRO sensor, installed at a height of 800–1300 mm above floor level and positioned away from direct sunlight. Sensors were used with factory calibration settings. Prior to installation, sensors were checked against each other to confirm comparable readings across units. Sensor locations in all hospitals can be found in the supplemental data online (file 2: sensor locations).
Door-opening was recorded using Aranet Dry Hour Meters connected to a magnetic reed switch attached to the doors. Data were logged every 10 minutes over a 48-day period from 23 April 2024 to 9 June 2024. Specifications of all sensors and measurement instruments are included in Table 2. Drawings of sensor installation can be found in supplemental data online (file 1: sensor installation).
Table 2
Measurement instruments, sensor ranges, accuracy and logging frequencies for indoor environmental monitoring
| VARIABLE | SENSOR OR MEASUREMENT INSTRUMENT | RANGE | ACCURACY | LOGGING FREQUENCY |
|---|---|---|---|---|
| Temperature | Aranet4 PRO | 0–50°C | ±0.3°C | 10 minutes |
| Relative humidity | Aranet4 PRO | 0–85% | ±3% | 10 minutes |
| CO2 | Aranet4 PRO | 0–9999 ppm | ±30 ppm + 3% | 10 minutes |
| Door-opening | Aranet Dry Contact Hour Meter | — | 4.3 sec/day | 1 minute |
| Surface temperature | Flir Edge Pro | –20°C–120°C | ±3°C or ±5% | — |
2.6 WEATHER DATA COLLECTION
Outdoor climatic data were obtained from the Open-Meteo Historical Weather API (Zippenfenig 2023). Daily data from a government weather station located in the airport (see Figure 2 for location) were retrieved for the period 23 April to 10 June 2024. Variables included daily mean air temperature at 2 m height (°C) and precipitation (mm).
2.7 DATA MANAGEMENT
Climate and door-opening data from each sensor were transmitted every 10 minutes via radio signal to an internet-connected base station, which then uploaded the data to a secure cloud server, for download as CSV files. Prior to analysis, data files were screened for missing values, sensor dropouts and anomalous readings.
2.8 THERMAL COMFORT CALCULATION
PPD was used to assess thermal comfort. PPD predicts the percentage of occupants who will be dissatisfied with thermal conditions based on the Predicted Mean Vote (PMV) model developed by P. O. Fanger (Fanger 1970). The PMV calculation incorporates air temperature and relative humidity, along with other factors such as airspeed, clothing level and metabolic rate. For this study, an assumed internal airspeed of 0.1 m/s, a clothing level of 0.6 (equivalent to wearing trousers and a long-sleeved shirt) and a metabolic rate of 1.0 (equivalent to being seated) were used. The PPD was derived from the PMV using Equation (1). The coefficients of PMV4 and PMV2 are 0.03353 and 0.2179, respectively.
2.9 ESTIMATING THE CO2 LEVEL DETECTABLE BY MOSQUITOES
An estimate of 530 ppm was used as a conservative, indicative reference point above which indoor CO2 may contribute to mosquito attractant accumulation, calculated by adding the lowest CO2 levels detected by mosquitoes (108–133 ppm; Grant and O’Connell 2007) to average atmospheric CO2 levels (419–421 ppm; CenCO2PIP 2023).
2.10 ESTIMATING THE CO2 LEVEL IMPACTING HUMAN BUILDING OCCUPANTS
A literature review of low-level CO2 exposure in indoor environments reported building-related symptoms to begin at 700 ppm (Azuma et al. 2018). Mean hourly values above this absolute threshold were plotted to identify periods during which occupants may be exposed to concentrations that could impact their health and comfort.
2.11 EXTENDED DOOR-OPENING THRESHOLD
Extended door-opening was defined as greater than 10 minutes open per hour or more than 10 opening events per hour. An hourly representation was used to allow direct comparison with mean hourly PPD and CO2 levels presented in the heatmap figures. These thresholds were defined by the study authors to distinguish incidental door use from sustained or repeated opening patterns that may present meaningful opportunities for mosquito entry.
2.12 STATISTICAL ANALYSIS OF ENVIRONMENTAL FACTORS AND DOOR-OPENING
A custom Python script (SciPy, pandas) was used to examine associations between prolonged door-opening, PPD and CO2 levels across three wards. A binary door-status variable was derived from door logger data (open = 1, closed = 0). Point-biserial Pearson correlation coefficients and two-sample independent Student’s t-tests (equal variances assumed, two-tailed) were used to identify broad associations between door status and each environmental parameter. Results are presented as means and p-values (5%).
2.13 VISUALISATION OF ENVIRONMENTAL AND BEHAVIOURAL DATA
A custom Python script was developed for this study to analyse and visualise environmental and behavioural data. The script utilised multiple Python libraries including pandas for data manipulation, matplotlib and seaborn for visualisation and numpy for numerical operations. Input data, including temperature, humidity and CO2 measurements, were processed from CSV files. PMV and PPD were calculated using functions based on Fanger’s thermal comfort model, as described in ASHRAE Standard 55 (ASHRAE 2017). Hourly mean PPD values above the ASHRAE recommendations (>20%) were analysed, as well as hours with PPD values estimating the majority occupant dissatisfied (>50%). The Python scripts generated PDF visualisations comprising heatmaps of hourly PPD, CO2 levels and door logger data, as well as daily mean temperature and CO2 levels, and hourly mean PPD and CO2 levels. Hourly heatmaps were developed as a novel method of visualisation to map hourly environmental conditions against known mosquito peak biting times described in Table 1. Door logger data was incorporated in applicable wards to indicate periods of extended door-opening (>10 minutes/hour or >10 opens/hour).
All Python scripts have been made open-source and are available here: https://doi.org/10.5281/zenodo.21378274.
2.14 SIMULATION AND THERMAL IMAGERY
Direct solar radiation simulations and thermal images were utilised to analyse factors influencing the thermal environment in the hospitals. A digital 3D model of Kivunge Hospital was created using Rhinoceros 3D including the surrounding context and simplified tree models. The software package Ladybug was used to estimate the number of direct sunlight hours entering the glazed openings over the study period. EnergyPlus Weather files for Zanzibar were downloaded from https://www.ladybug.tools/epwmap/. Infrared images of Chumbuni, Kivunge and Mwera Pongwe hospital interiors and exteriors were taken on 16 August 2024, after the study period, using a Flir Edge One Pro camera, and analysed using Flir One Ignite.
2.15 SEMI-STRUCTURED INTERVIEWS WITH WARD INPATIENTS
Semi-structured interviews were conducted with ward patients (n = 10) and patient relatives (n = 1) across four study hospitals, covering eight wards, between August and October 2024. Interviewees were asked to describe the thermal conditions of the ward, whether they had observed mosquitoes indoors, and what protective measures had been available to them. It should be noted that some interviews are from wards where environmental data were not collected. Interviews were conducted in Swahili, audio-recorded with the consent of all participants, transcribed, and translated into English. All personally identifying information was removed prior to analysis.
2.16 WORKSHOP: WINDOW AND DOOR-OPENING IN WARDS
As part of the co-creation activities of the MBD-Free Project, a workshop activity was conducted with patients, hospital staff and relevant specialists to explore the reasons why windows and doors are left open in hospital wards (Sloan Wood et al. 2025). Participants were presented with a physical model of a typical ward and invited to brainstorm reasons why windows and doors might remain open, given that these represent potential mosquito entry points. Reasons were recorded during the activity, and the frequency with which each reason was raised was counted to indicate relative prominence across participants.
3. RESULTS
3.1 COMBINED PERCENTAGE OF HOURS FOR ABOVE ESTABLISHED MEAN PPD AND CO2 THRESHOLDS
Table 3 shows the percentage of mean hourly values for PPD less than 20% (ASHRAE 55 standard), PPD less than 50% (predicted majority of occupants satisfied), CO2 levels greater than 530 ppm (estimated detectable threshold for mosquitoes) and CO2 levels greater than 700 ppm (estimated threshold where occupants start experiencing building-related symptoms) across the four study sites. Excluding the air-conditioned ground-floor office in Jitimai Hospital (PPD < 20% for 85.6% of monitored hours), all spaces were outside ASHRAE 55 recommendations for thermal comfort (PPD < 20%) for the majority of the hours recorded. Majority occupant thermal comfort (PPD < 50%), where over half of the occupants should be thermally comfortable, was achieved for 22.4% to 100% of the monitored time. Kivunge Hospital’s surgical ward performed worst, achieving majority satisfied PPD comfort levels (PPD < 50%) for only 5.4% of the monitored time.
Table 3
The percentage of mean hourly values for PPD across four study hospitals in Zanzibar
| SENSOR LOCATION | % HOURS WITH PPD < 20% | % HOURS WITH PPD < 50% | % HOURS WITH CO2 PPM > 530 | % HOURS WITH CO2 PPM > 700 |
|---|---|---|---|---|
| Mwera Pongwe Hospital | ||||
| GF – Family Planning (AC) | 7.2% | 91.9% | 11.7% | 1.6% |
| GF – Isolation Ward | 0.6% | 52.3% | 50.8% | 5.9% |
| FF – Surgical Ward | 2.1% | 53.4% | 44.7% | 15.1% |
| FF – Isolation Ward | 12.6% | 66.3% | 17.8% | 3.9% |
| GF – Waiting Room | 28.8% | 89.2% | 60.5% | 0.0% |
| FF – Waiting Room | 23.3% | 75.4% | 2.6% | 0.0% |
| Kivunge Hospital | ||||
| GF – Medical Ward | 0.5% | 40.6% | 70.8% | 26.3% |
| GF – Medical Ward (AC) | 0.0% | 51.8% | 54.3% | 17.7% |
| GF – Surgical Ward | 0.0% | 5.4% | 98.3% | 60.7% |
| FF – Medical Ward | 0.0% | 22.4% | 30.0% | 3.5% |
| FF – Isolation Ward | 0.3% | 26.9% | 9.9% | 0.5% |
| GF – Waiting Room | 7.6% | 81.3% | 5.8% | 0.1% |
| FF – Waiting Room | 16.1% | 75.0% | 4.1% | 0.0% |
| Jitimai Hospital | ||||
| GF – Doctors Room | 0.0% | 31.7% | 34.1% | 12.7% |
| FF – Isolation Ward | 3.8% | 56.8% | 15.8% | 3.2% |
| FF – Medical Ward | 0.0% | 33.9% | 57.1% | 21.3% |
| GF – Office (AC) | 85.6% | 100.0% | 93.3% | 70.0% |
| GF – Waiting Room | 4.8% | 66.9% | 5.3% | 0.0% |
| FF – Waiting Room | 12.0% | 66.2% | 0.0% | 0.0% |
| Chumbuni Hospital | ||||
| GF – Vaccination | 0.7% | 68.5% | 5.3% | 0.9% |
| GF – Family Planning (AC) | 0.0% | 46.6% | 26.4% | 15.3% |
| FF – Isolation Ward | 5.4% | 67.0% | 8.2% | 0.8% |
| FF – Surgical Ward | 1.2% | 45.7% | 41.8% | 15.9% |
| GF – Waiting Room | 17.7% | 83.8% | 15.1% | 0.0% |
| FF – Waiting Room | 34.3% | 82.2% | 0.5% | 0.0% |
[i] Note: The table reports the proportion of hours with PPD below 20% (the ASHRAE 55 standard) and below 50%, as well as the percentage of hours with carbon dioxide (CO2) concentrations exceeding 530 ppm (the estimated threshold detectable by mosquitoes) and 700 ppm. GF = ground floor, FF = first floor.
CO2 concentrations varied across locations. Seven of the 25 recorded spaces experienced CO2 levels above 530 ppm for more than 50% of the monitored period. CO2 levels above 700 ppm were less frequent but still notable in some areas, such as Jitimai Hospital’s office (70% of the time) and Kivunge Hospital’s surgical ward (60.7% of monitored time).
Waiting areas in all four hospitals generally exhibited better thermal comfort and lower CO2 levels than ward spaces, with 77.5% of hours achieving PPD < 50% and no hours exceeding 700 ppm CO2. Ward spaces showed the lowest percentage of hours with PPD < 20% (2.0%) and the highest CO2 levels above 700 ppm (13.5% of hours). Clinical and office spaces had the highest mean percentage of hours with CO2 above 700 ppm. These results are summarised across space types in Figure 5; data from all individual hospital spaces can be found in the supplemental data online (file 3: environmental data all hospitals).
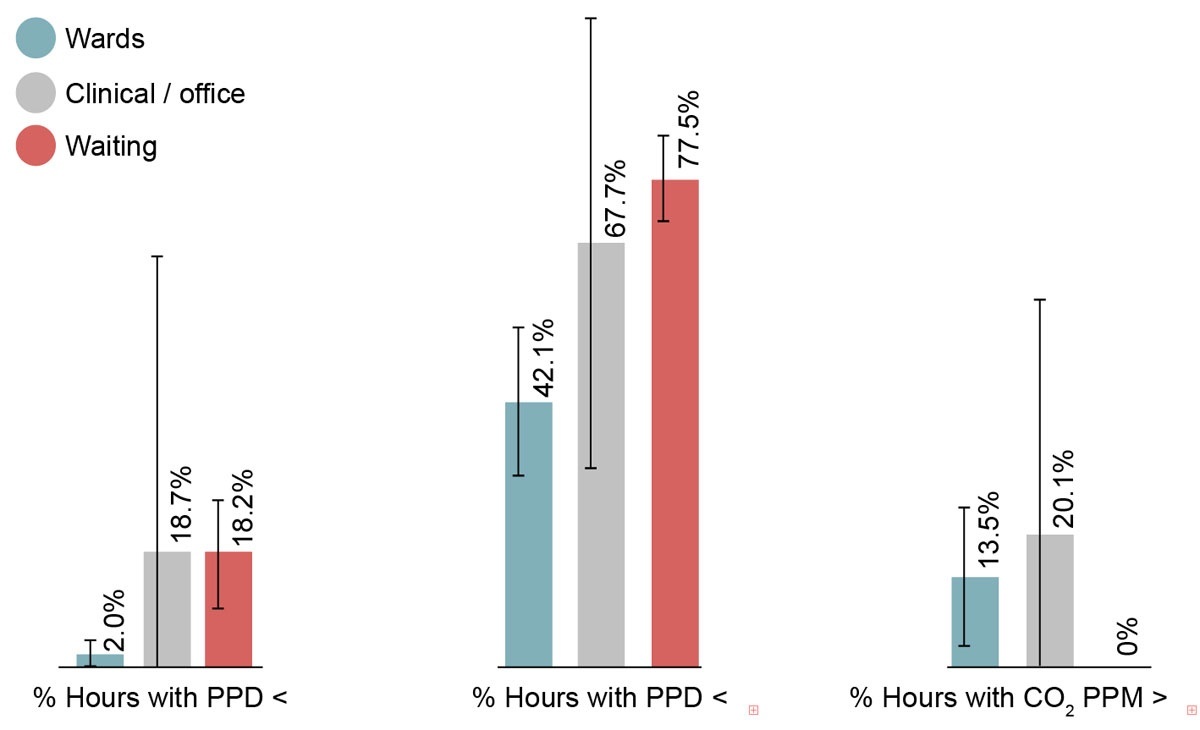
Figure 5
Percentage of hours during the study period in which PPD values fell below 20% and below 50%, and in which CO2 concentrations exceeded 700 ppm, shown across all ward, clinical and office spaces.
3.2 MEAN HOURLY TEMPERATURE AND CO2
Figure 6 illustrates the mean daily temperature and CO2 levels during the study period at Kivunge Hospital. Similar patterns were observed in the other hospitals; graphs for all recorded hospital spaces are available in the supplemental data online (file 3: environmental data all hospitals). All non-air-conditioned spaces exhibited similar seasonal temperature fluctuations. However, ward spaces consistently remained 1–3°C warmer than waiting areas. Ward spaces experienced greater fluctuations and peaks in CO2 levels, frequently exceeding 530 ppm and 700 ppm. Five of 25 monitored spaces (Kivunge: GF Medical Ward; Chumbuni: FF Surgical Wards; Jitimai: Office and FF Medical Ward; Mwera Pongwe: FF Surgical Ward) experienced hours with mean CO2 levels that exceeded the ASHRAE recommendations of 700 ppm over the outdoor level (ASHRAE 2019), based on an average atmospheric 419–421 ppm (CenCO2PIP 2023). In contrast, CO2 levels in waiting spaces remained relatively low, typically ranging between 450–575 ppm for most of the study period. Indoor temperature in ward and waiting spaces was reduced during days with rain.
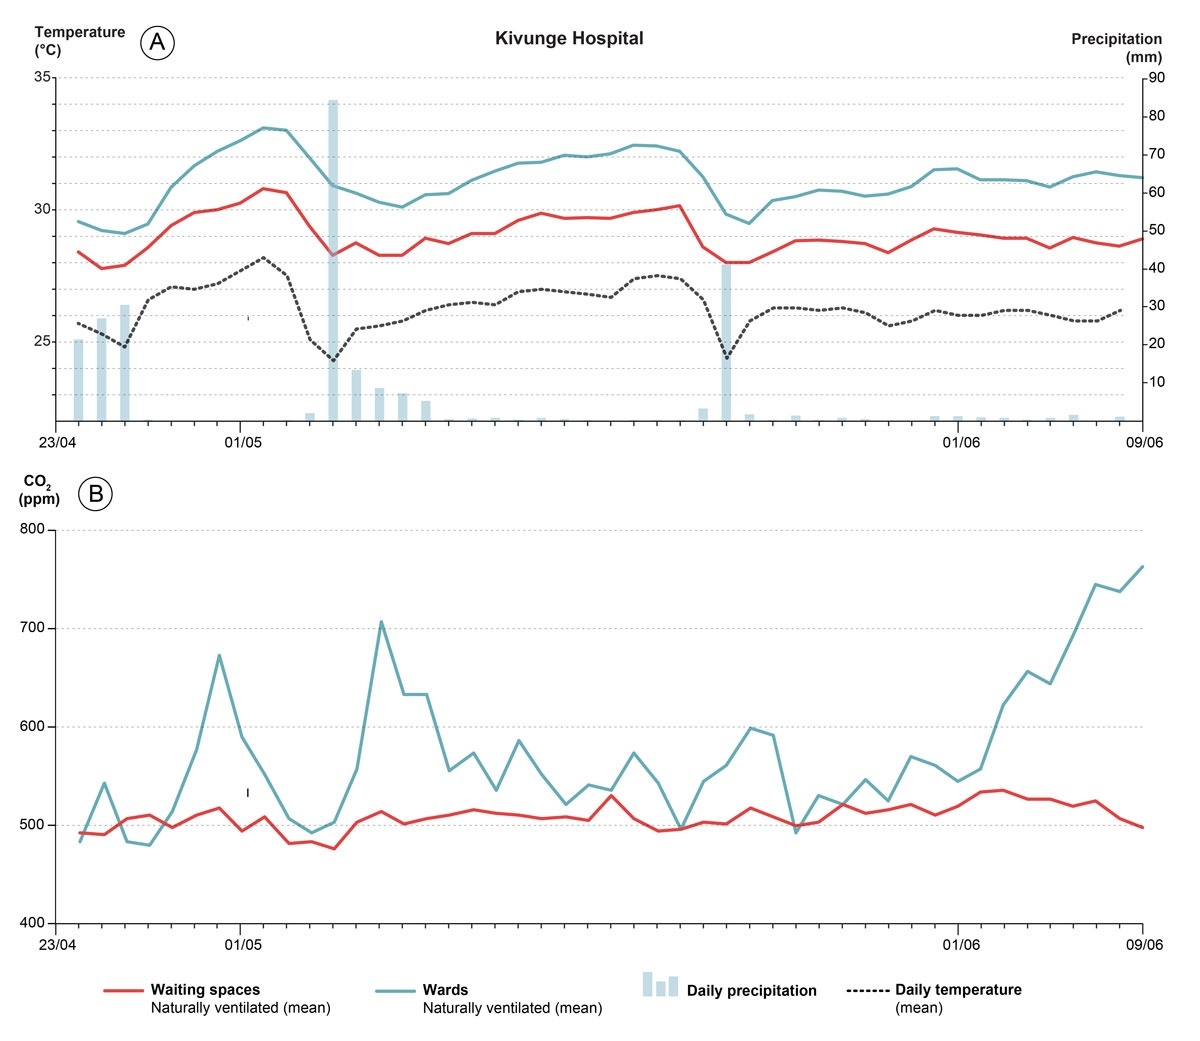
Figure 6
Graph A: mean daily indoor temperature at Kivunge Hospital during the study period, with concurrent weather station data. Graph B: mean daily CO2 levels at Kivunge Hospital during the study period for the same spaces.
Note: The group average for naturally ventilated ward spaces (n = 3) is shown as a blue line and waiting spaces (n = 2) as a red line. The black dashed line indicates mean temperature was recorded at the nearest weather station. Precipitation is shown as a light blue bar chart with axis on the right-hand side.
3.3 MEAN HOURLY AVERAGE FOR PPD AND CO2
Figure 7 shows mean PPD and CO2 values for each hour of the 24-hour cycle across spaces in Kivunge Hospital. All non-air-conditioned spaces show a similar daily PPD pattern, increasing during daylight hours to its highest between 13:00 and 16:00. Average hourly PPD for all spaces was above the ASHRAE 55 20% recommendation. Average hourly PPD is typically 20–25% lower in the waiting spaces compared with the ward spaces. CO2 levels in ward spaces were relatively consistent throughout the day, with increased levels in the evening hours between 18:00 and 06:00. The air-conditioned ground-floor medical ward had fewer temperature fluctuations (Figure 6) but PPD remains higher on average than in waiting areas.
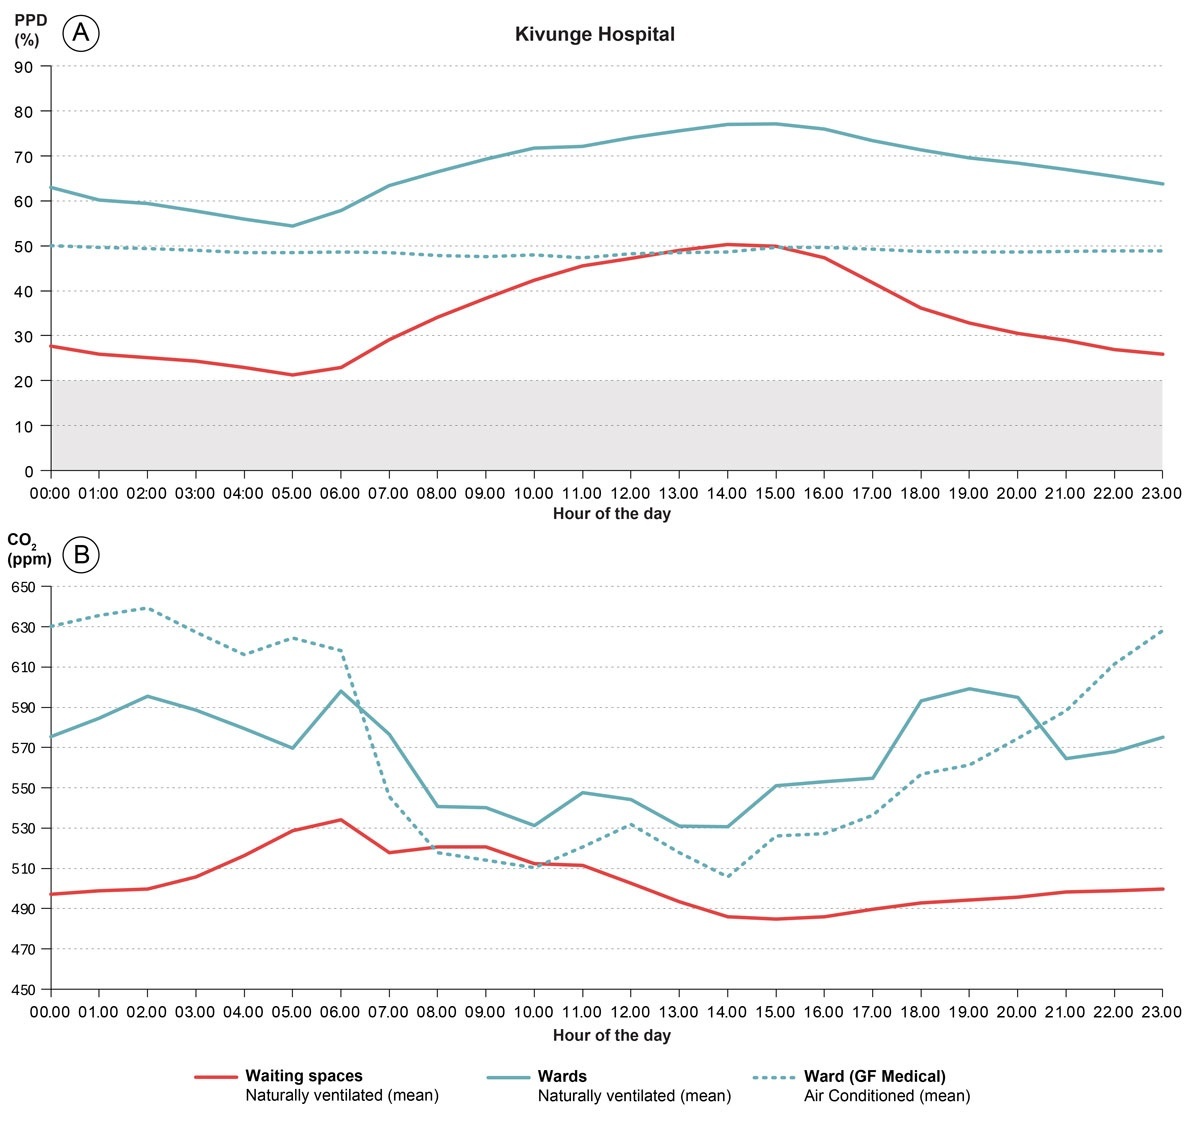
Figure 7
Graph A: group mean average PPD for naturally ventilated wards (n = 3), waiting spaces (n = 2) and the air-conditioned ward (n = 1) for each hour of the 24-hour cycle for Kivunge Hospital only. Graph B mean CO2 levels for each hour of the 24-hour cycle.
Note: The grey hatched area represents the ASHRAE 55 minimum standard (20%).
3.4 COMBINED MEAN PPD AT 00:00, 06:00, 12:00 AND 18:00
Figure 8 shows the combined mean PPD at 12 am, 6 am, 12 pm and 6 pm across all four hospitals for the ward, office, clinic and waiting spaces. The mean PPD was greatest in the ward spaces at all four times. The difference between the PPD in the ward and waiting spaces was greater during the night hours (18:00 to 06:00) than during the day.
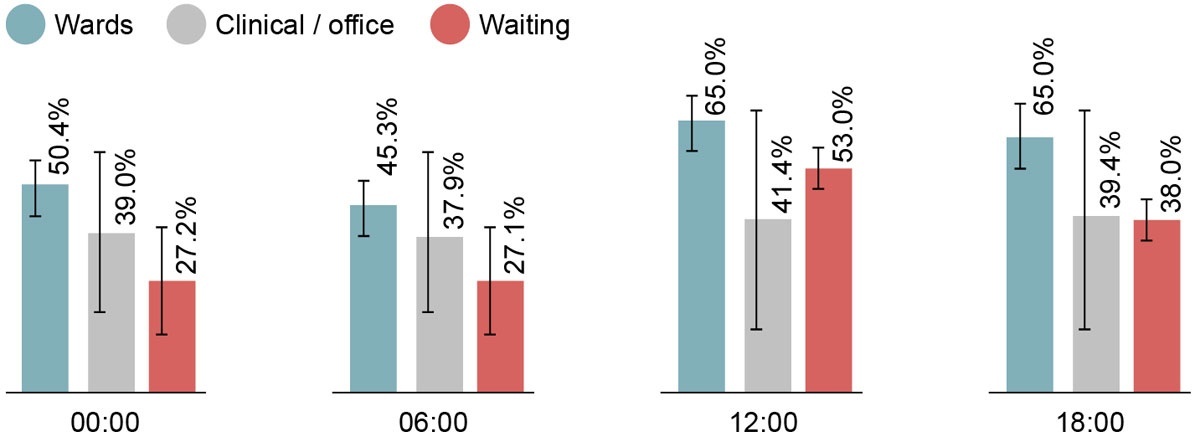
Figure 8
Combined mean hourly percentage for PPD levels across the four hospitals for the ward, office and clinic spaces and waiting spaces at 12am, 6am, 12pm and 6pm.
3.5 HEATMAPS OF HOURLY MEAN PPD AND CO2
The heatmaps of hourly mean PPD and CO2 during the study period show recurring differences between the ward, office and clinic spaces, and waiting spaces as shown in Figure 9. In the ward spaces, the majority of hours had a PPD value above 50%, with multiple hours of PPD > 50% and CO2 levels > 700 ppm occurring, mostly at night. These hours overlap with commonly reported peak mosquito biting hours found in the literature for Aedes (Chadee 1988, 2013; Muhammad et al. 2020), Anopheles (Sherrard-Smith et al. 2019; Sougoufara et al. 2014) and Culex species. (Chen et al. 2017; Ryan et al. 2017); see Table 1. PPD levels also reached 100% for multiple hours in the wards but not in the waiting or office and clinic spaces.
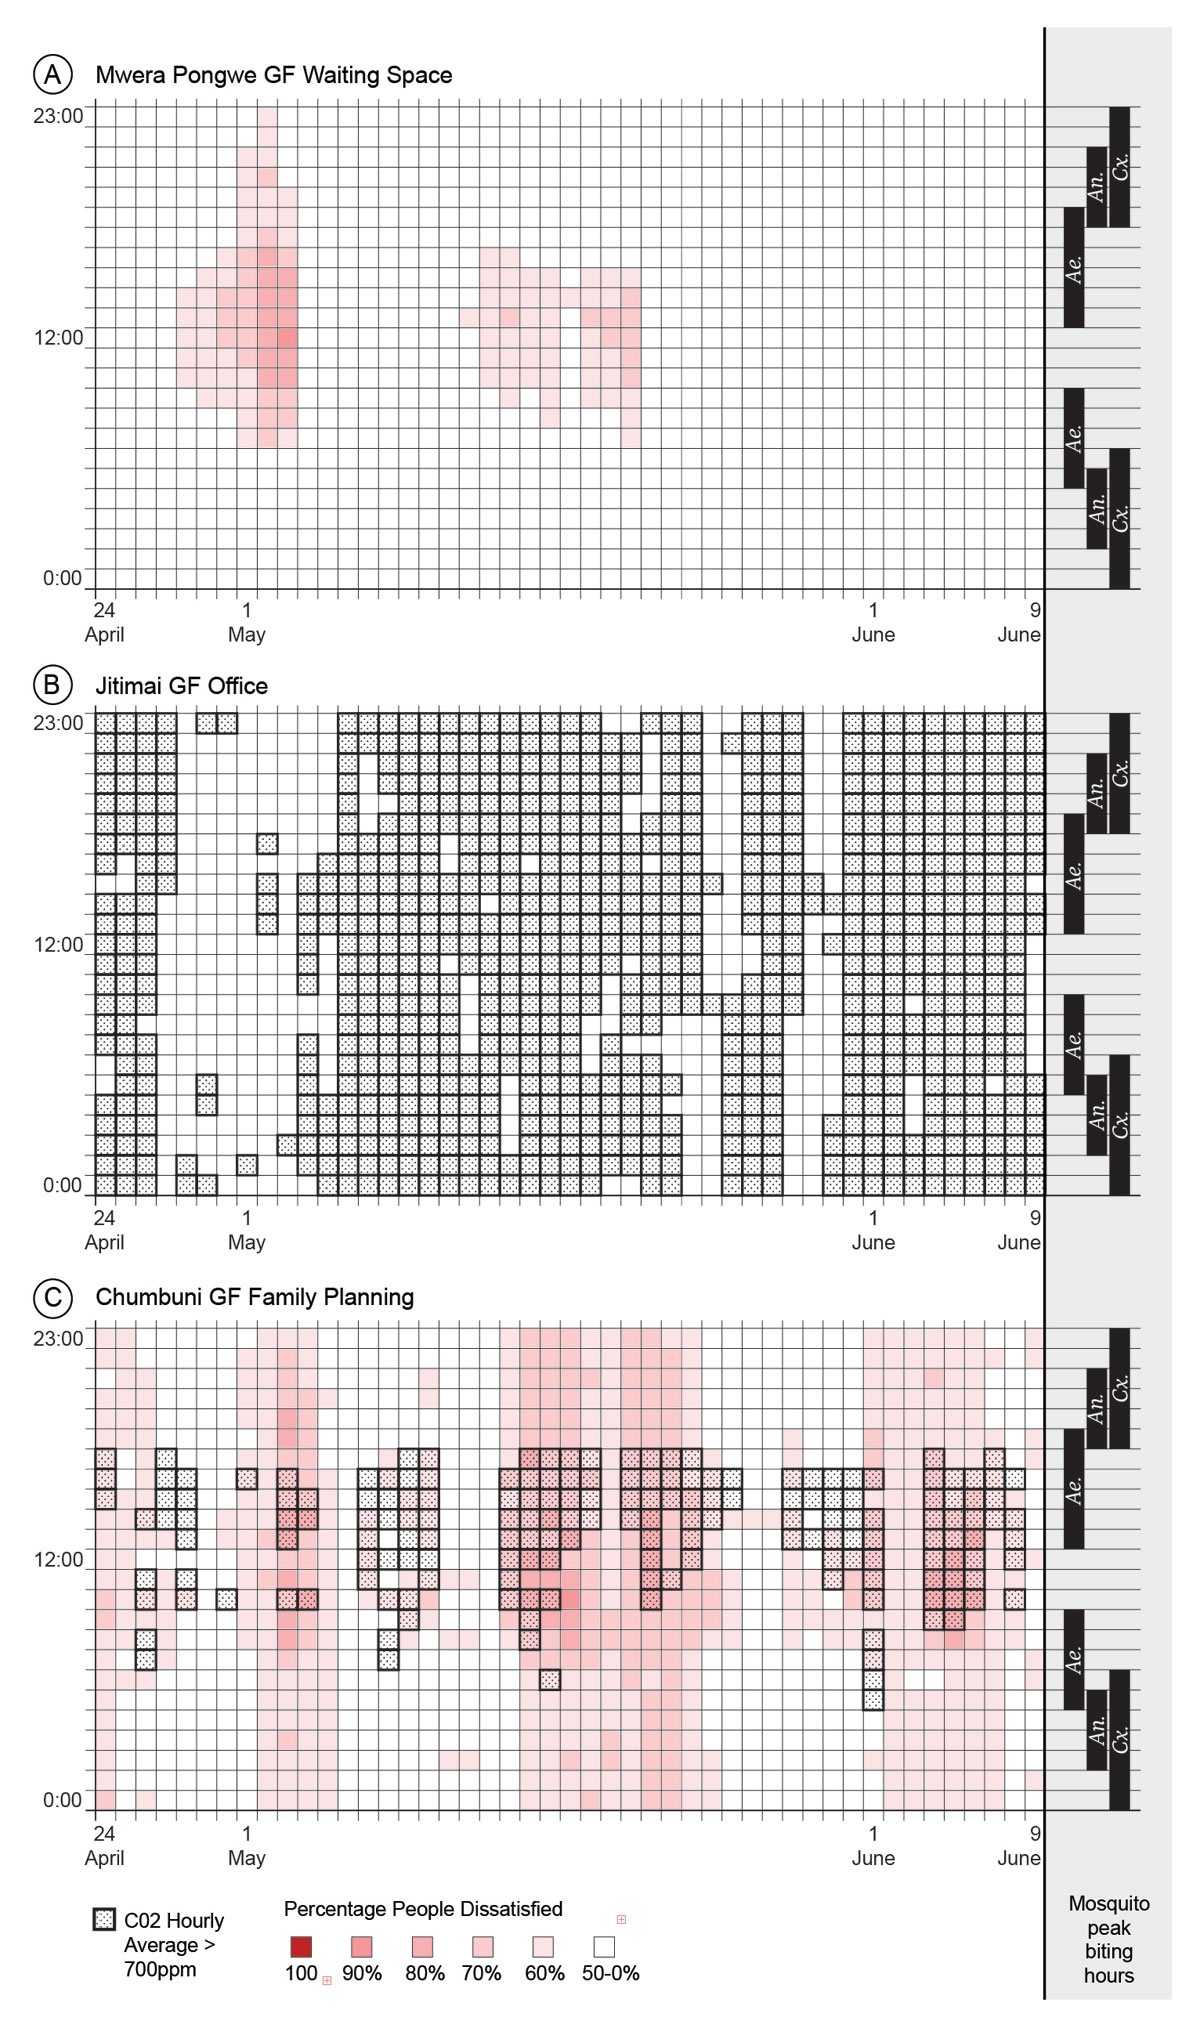
Figure 9
Heatmaps of mean hourly Predicted Percentage of Dissatisfied (PPD) values across the 48-day study period for: (A) Mwera Pongwe Ground Floor Waiting, (B) Jitimai Ground Floor Office and (C) Chumbuni Ground Floor Family Planning.
Note: Each cell represents one hour; days are shown on the x-axis and the 24-hour cycle on the y-axis. PPD values exceeding 50% are shaded pink to red; hours in which CO2 concentrations exceeded 700 ppm are indicated by a dotted black hatched overlay. Peak biting hours for each mosquito species recorded in the study (see Table 1) are indicated on the right-hand y-axis. Ae. = Aedes; An. = Anopheles; Cx. = Culex.
In the air-conditioned clinic and office spaces, PPD as low as 0% was observed in Jitimai Office. However, this space also had CO2 levels above 700 ppm for 84.7% of the hours in the study. Other air-conditioned spaces, like Chumbuni Family Planning, had multiple hours with PPD > 50% and CO2 levels > 700 ppm, largely in the daytime between 09:00 and 16:00, reflecting use patterns.
3.6 DOOR-OPENING BEHAVIOUR
Figure 10 shows PPD and CO2 hourly heatmaps for ward spaces in Kivunge Hospital, where door loggers had been installed on the only entrance door to the rooms. Hours where the door was logged as being open for more than 10 minutes or opened more than 10 times are marked with an ‘X’. In the surgical, ground-floor medical, and first-floor medical wards, 192 (17.0%), 438 (38.8%) and 274 (24.3%) hours, respectively, were recorded where the door was open for more than 10 minutes. The majority (73.8%) of this door-opening occurred at night between the hours of 18:00 to 06:00.
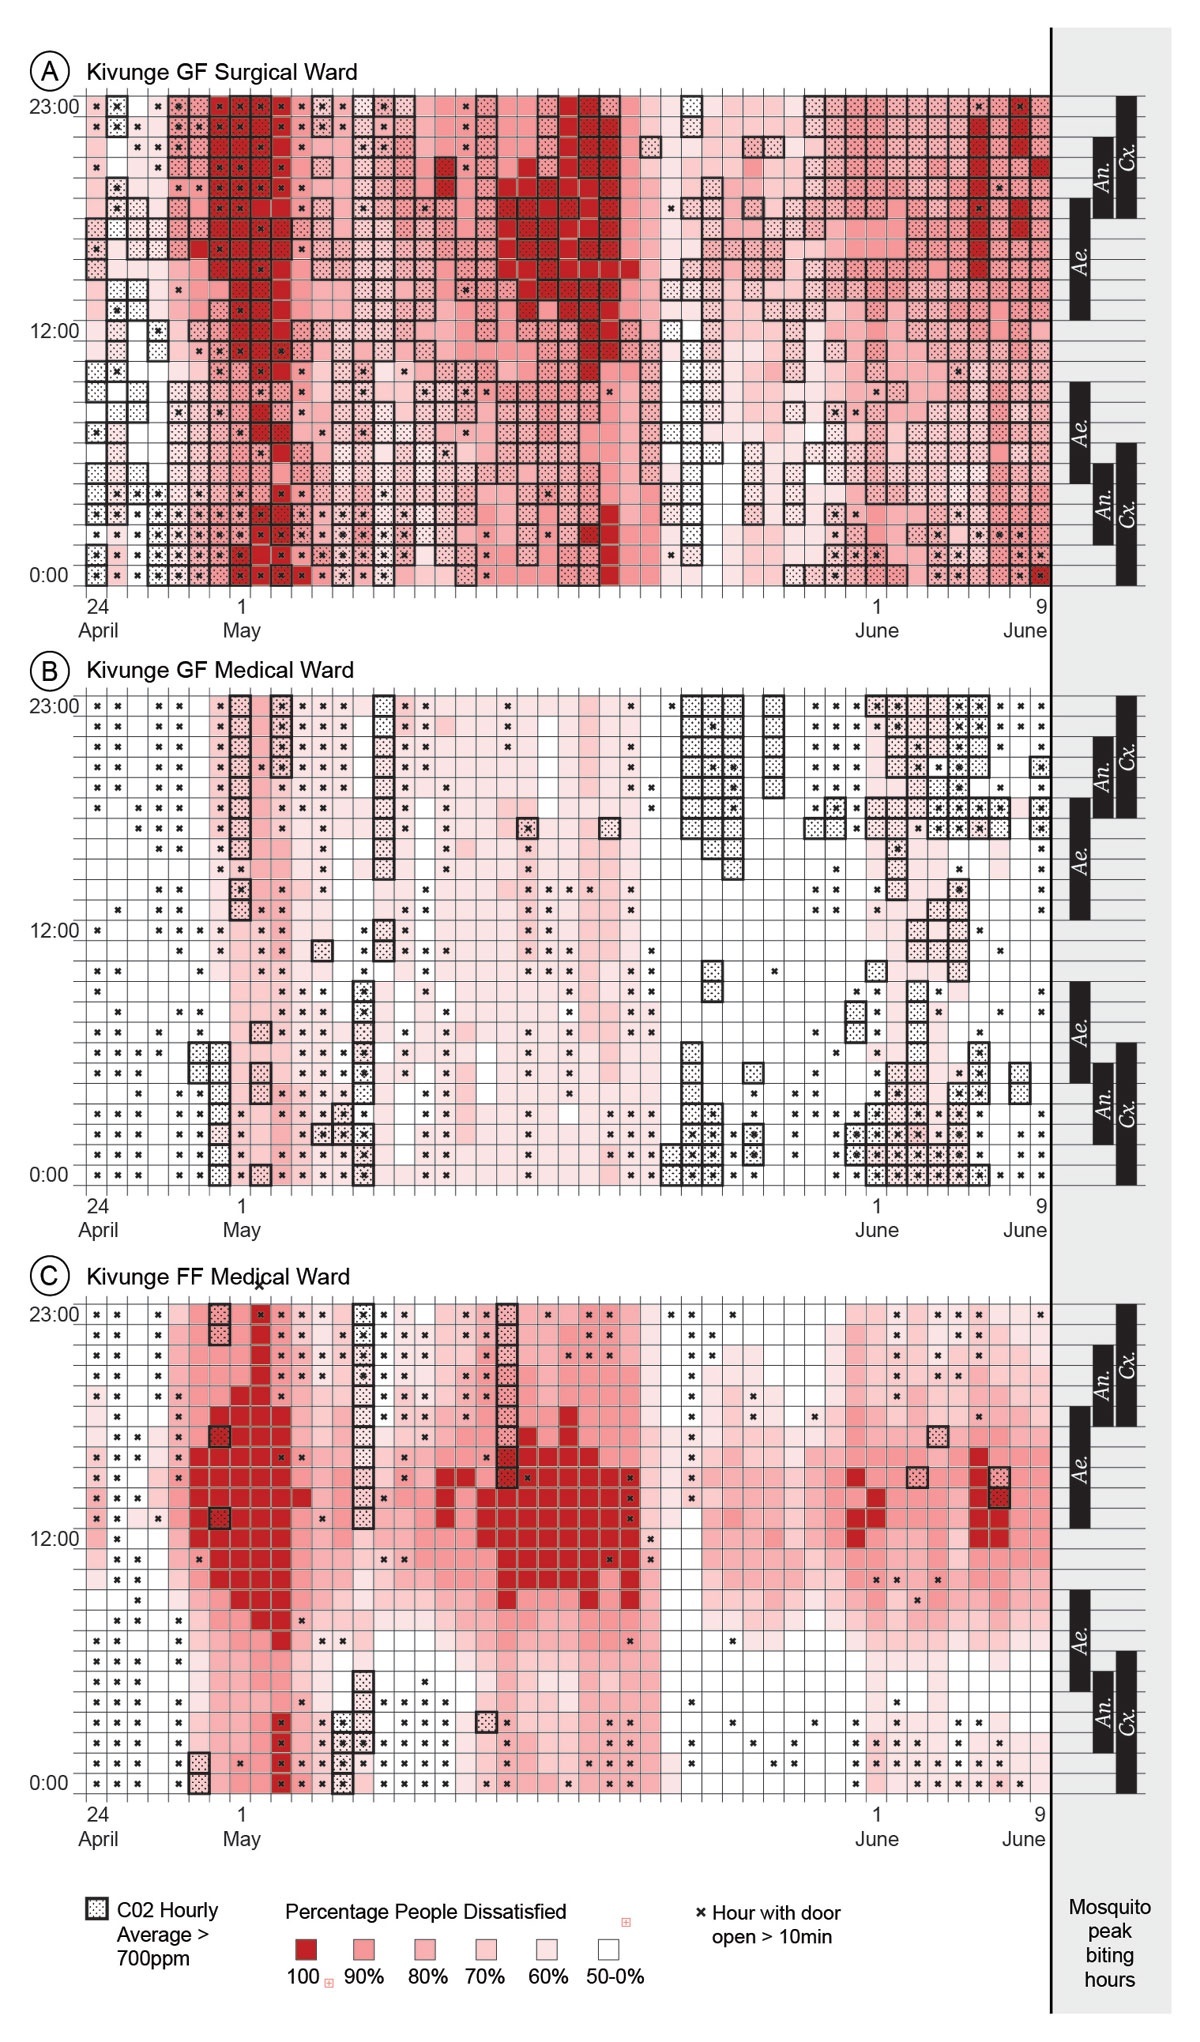
Figure 10
Heatmaps of mean hourly PPD values across the 48-day study period for three wards in Kivunge Hospital where door loggers had been installed.
Note: (A) = Ground Floor Surgical Ward; (B) = Ground Floor Medical Ward; (C) = First Floor Medical Ward. Each cell represents one hour; days are shown on the x-axis and the 24-hour cycle on the y-axis. PPD values exceeding 50% are shaded pink to red; hours in which CO2 concentrations exceeded 700 ppm are indicated by a grey hatched overlay. Hours where the door was open for more than 10 minutes or more than 10 times in the hours are marked with an ‘X’. Peak biting hours for each mosquito species (Ae. = Aedes; An. = Anopheles; Cx. = Culex) are indicated on the right-hand y-axis.
Statistical analysis of door-opening behaviour across three hospital wards presented in Table 4 shows varying relationships between environmental factors and door status, where ‘open’ indicates the door was left open for more than 10 minutes in an hour or opened over 10 times. In the ground-floor medical ward, weak correlations were observed between extended door-opening and both PPD (–0.0447) and CO2 levels (0.0318), with no statistically significant differences in these parameters between hours with extended door-opening and those without.
Table 4
Relationship between prolonged door-opening, PPD and CO2 levels in three wards of Kivunge Hospital
| DESCRIPTION OF CORRELATION | GF MEDICAL WARD | FF MEDICAL WARD | GF SURGICAL WARD |
|---|---|---|---|
| Correlation: PPD and door-opening | –0.0447 | –0.2901 | –0.0357 |
| Correlation: CO2 and door-opening | 0.0318 | –0.0879 | 0.0546 |
| Average PPD when door is open | 47.71% | 55.96% | 72.69% |
| Average PPD when door is closed | 48.65% | 68.88% | 74.02% |
| Average CO2 when door is open | 585ppm | 491ppm | 861ppm |
| Average CO2 when door is closed | 573ppm | 508ppm | 814ppm |
| PPD t-test p-value | 0.1291 | < 0.001 | 0.2266 |
| CO2 t-test p-value | 0.2810 | 0.0028 | 0.0638 |
[i] Notes: Prolonged opening is defined as > 10 minutes/hour. Mean PPD and CO2 values are presented for open versus closed door periods, with correlation coefficients and t-test p-values. GF = ground floor, FF = first floor.
The first-floor medical ward demonstrated a stronger negative correlation between PPD and extended door-opening (–0.2901), with significantly lower PPD during hours of extended door-opening (55.96% versus 68.88%, p < 0.001). CO2 levels in this ward were also significantly lower during hours of extended door-opening (491 ppm versus 508 ppm, p = 0.0028).
The surgical ward showed minimal correlations between extended door-opening and both PPD (–0.0357) and CO2 (0.0546), with higher CO2 levels during hours of extended door-opening (861 ppm versus 814 ppm), although this difference was not statistically significant (p = 0.0638).
3.7 THERMAL IMAGERY
Figure 11 presents thermal images of exterior and interior hospital spaces captured across three study hospitals on 16 August 2024. Images were taken at different times of day (09:57, 08:48 and 12:40, respectively) and are therefore indicative rather than directly comparative.
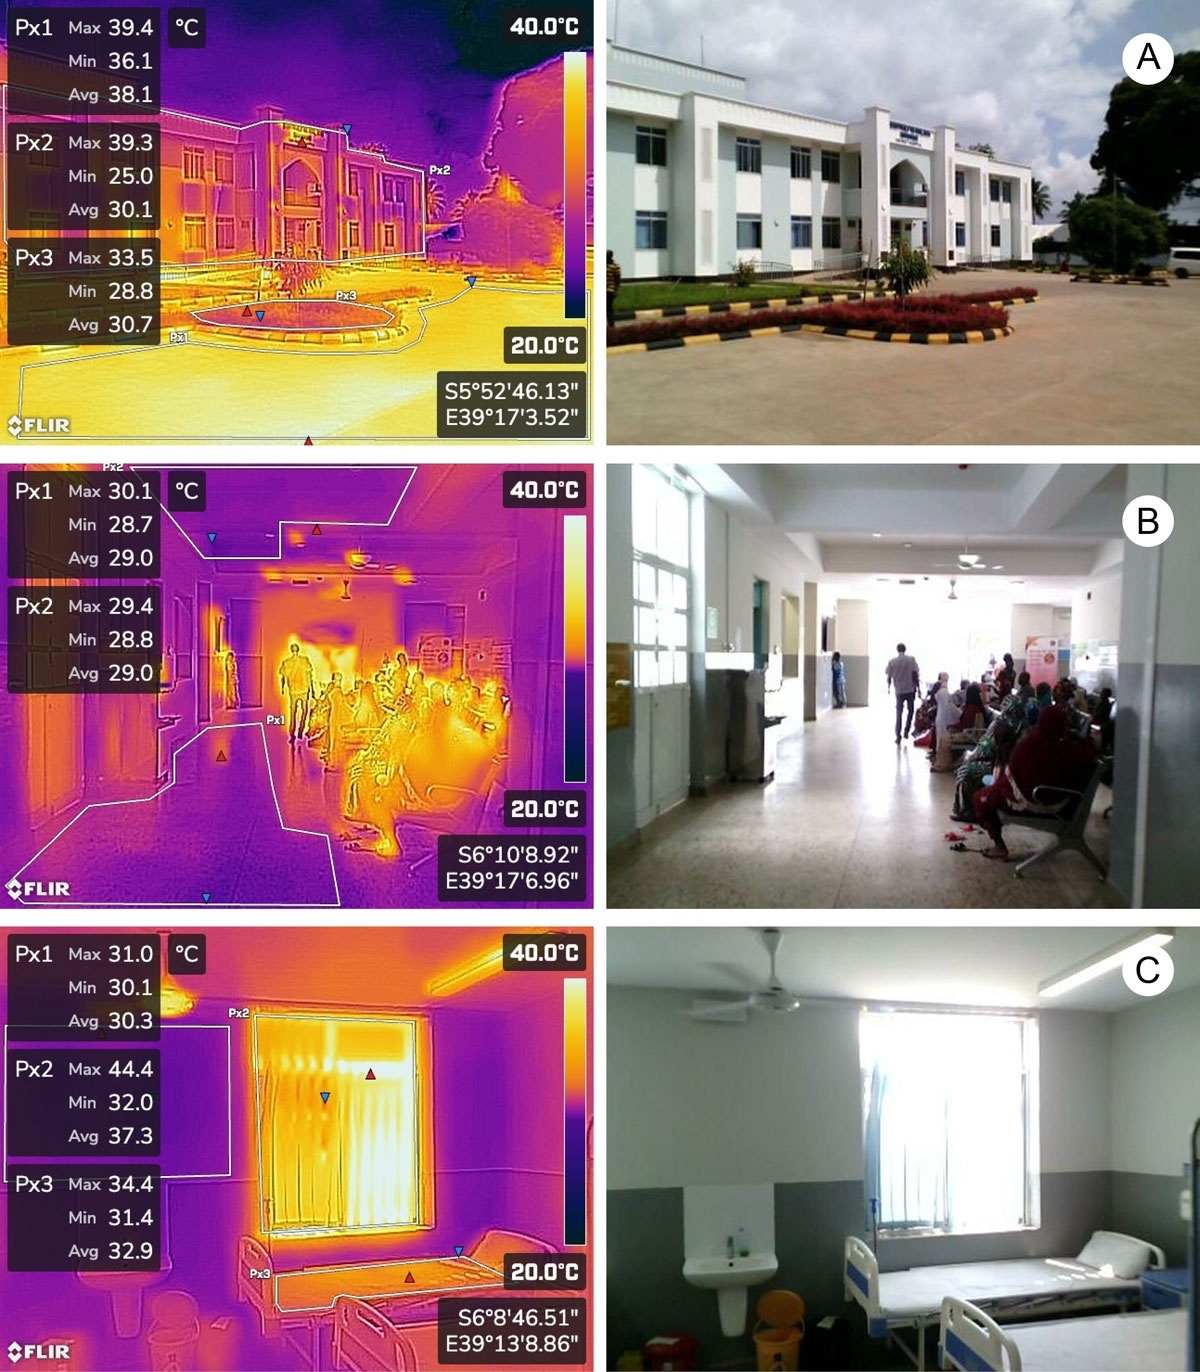
Figure 11
Thermal images indicating sources of heat gain in hospital spaces at three study hospitals, captured on 16 August 2024. (A) = Exterior entrance of Kivunge Hospital, 09:57; (B) = Ground-floor waiting area, Mwera Pongwe Hospital, 08:48; (C) = Ground-floor ward, Chumbuni Hospital, 12:40.
Note: Maximum, minimum and mean surface temperatures are shown for areas delineated by white polylines.
Image A shows the exterior entrance of Kivunge Hospital, where mean surface temperatures of concrete-paved areas were 7.4°C higher than adjacent landscaped areas under similar solar exposure. Image B shows the ground-floor waiting area at Mwera Pongwe Hospital, which indicates minimal direct solar gains to interior surfaces. Image C shows the ground-floor ward at Chumbuni Hospital at 12:40. Elevated surface temperatures are visible at the aluminium window frame (Px2) and on the surface of the adjacent unoccupied ward bed (Px3), coinciding with direct solar radiation entering through the unshaded window.
3.8 SIMULATIONS OF WINDOW SHADING ADAPTATIONS
Figure 12 shows simulated direct sunlight exposure on windows at Kivunge Hospital for the north- and east-facing façades under existing conditions and with proposed shading adaptations. On the north façade, adaptations include combined horizontal and vertical side fins; on the east façade, vertical fins are applied to first-storey windows, while horizontal fins and strategic tree planting are proposed in front of upper windows. All shading fins project 300 mm from the façade plane. Together, these adaptations reduced simulated direct solar radiation on windows by 66% to 73%.
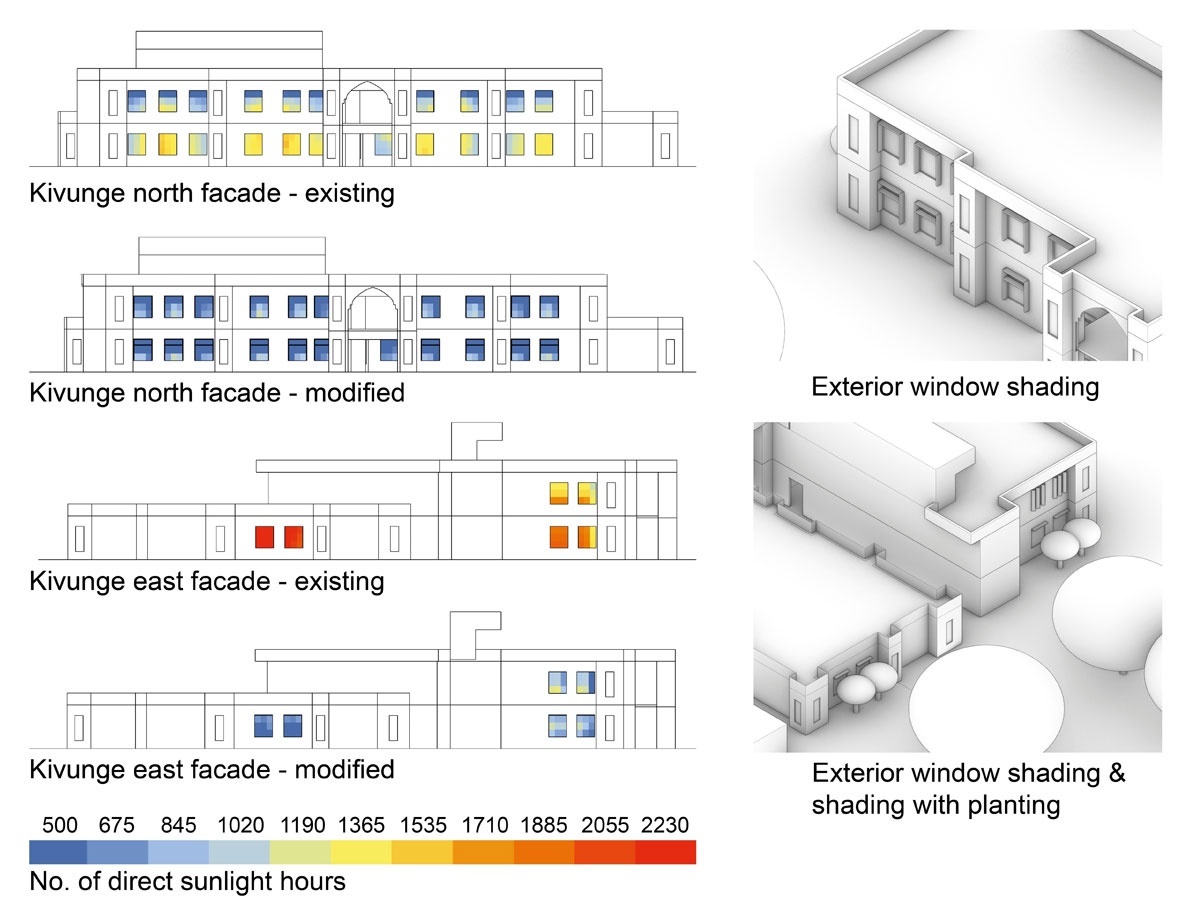
Figure 12
Direct sunlight simulation conducted using Ladybug software for Kivunge Hospital, showing direct sunlight exposure on the windows of the north façade (top) and east façades (bottom), for daylight hours from 06:00 to 18:00 for the full year (4380 hours).
Note: The gradient indicates the number of hours of direct sunlight the surface receives over this period. The modified façades show the addition of exterior shading strategies including horizontal and vertical shading and strategic planting.
3.9 INPATIENT PERSPECTIVES
The majority of patients and relatives (n = 7/11, respectively) reported the presence of mosquitoes inside the hospital wards. Feedback on thermal comfort inside the wards varied with ward design, with patients in larger wards with more windows reporting better comfort and some voicing strong complaints around overheating. Patients and relatives described closing windows and doors as the only protective measure from mosquitoes in the wards (n = 6/11, respectively), with some also mentioning covering the body with sheets, use of personal repellent and ceiling fans preventing mosquito landing. Ceiling fans were also frequently described as effective in cooling the wards, though their efficacy was limited by their placement in the centre of the room rather than above the beds, their limited number, noise and variation in patient preference. Personal bed fans were suggested as a strategy to improve thermal comfort and the opening of windows. No patients specifically linked thermal discomfort with increased window and door-opening. Selected interviewee quotations are provided in Table 5.
Table 5
Feedback from semi-structured interviews with inpatients and relatives describing thermal comfort, fan use and window and door-opening behaviour in hospital wards
| The air is terrible, really terrible. Hot, and the room is small with four people […] and given the condition of those patients, they can’t handle those [ceiling] fans. | Relative of inpatient in Male Ward, Kivunge |
| The air this month has been hot, this is the end of the hot period. But inside there are fans. | Inpatient in Female Ward, Kivunge |
| [It’s] very hot. The fan doesn’t reach here. This ward is supposed to have four fans. | Inpatient in Male Ward, Chumbuni |
| It’s okay. Because the fans are working well, and sometimes we open the windows and let them stand open. We also get fresh air that way. | Inpatient in Female Ward, Mwera Pongwe |
| We close the windows. The doors, not always, because you know, you close it and someone comes in, someone goes out. | Parent of inpatient in Pediatric Ward, Mwera Pongwe |
| Mosquitoes come one by one. You know, the door stays open, people come in and go out – mosquitoes will inevitably enter. But by the time evening comes, we try to close the door ourselves, so it’s manageable. | Inpatient in Female Ward, Kivunge |
3.10 REASONS FOR WINDOW- AND DOOR-OPENING IN WARDS
Participants in a brainstorming workshop identified 13 distinct reasons for windows and doors being left open in hospital wards (Table 6). The most frequently cited reason was air circulation, fresh air or ventilation (n = 22), followed by access and movement of patients, staff, equipment or for emergencies (n = 11). Reducing heat and reducing bad smells or odours were cited equally (n = 8 each). Broken or missing screens, windows, doors, locks or door closers were also commonly raised (n = 7), alongside low awareness or education around window screen use and closing practices (n = 5) and habitual or behavioural factors such as forgetting to close windows and doors (n = 5). Less frequently mentioned reasons included cleaning activities (n = 4), increasing light (n = 2) and disease transmission or patient safety concerns (n = 2).
Table 6
Feedback from brainstorm workshops with hospital staff, patients and other specialists.
| REASON FOR WINDOWS AND DOORS IN WARDS BEING LEFT OPEN | COUNT |
|---|---|
| Air circulation, fresh air, breeze or ventilation | 22 |
| Access, movement or keeping doors open for patients, staff, equipment or emergencies | 11 |
| Reduce heat, hot weather, lack of cooling or discomfort with fans | 8 |
| Reduce bad smells, odours or chemical smells | 8 |
| Broken or missing screens, windows, doors, locks or closers | 7 |
| Education or low understanding about how to use window screens/closing practices | 5 |
| Habits, forgetting, attitudes or general behaviour | 5 |
| Cleaning-related activities | 4 |
| Increase light | 2 |
| Disease transmission or patient safety concerns | 2 |
| To see the outdoor environment | 1 |
| To reduce dust or get dust out | 1 |
| Children opening doors/windows | 1 |
| Opened to call someone outside the building | 1 |
| To avoid the door being locked | 1 |
| To throw trash outside | 1 |
4. DISCUSSION
4.1 THERMAL COMFORT, CO2 LEVELS AND DOOR-OPENING
All spaces in the four study hospitals, except the air-conditioned office in Jitimai Hospital, failed to meet ASHRAE 55 thermal comfort recommendations for the majority of the study period. Thermal comfort was worst in the ward spaces compared to the waiting, clinic and office spaces. Inpatient interview feedback on thermal comfort in the wards varied from patients considering them as comfortable to others raising strong complaints about overheating (Table 5). This study was conducted during the cooler months of the year (May and June) and thermal discomfort is likely to be higher in the hottest months (December to February) (Adam et al. 2020).
Multiple hours were observed where uncomfortable PPD values overlapped with high CO2 levels in the wards and some office and clinic spaces. Many of these hours also coincided with commonly reported peak mosquito biting hours found in the literature for Aedes, Anopheles and Culex species and illustrated in the heatmaps shown in Figures 9 and 10. These hours were typically at night, potentially increasing the risk of patients opening windows or doors to improve thermal comfort, thereby releasing a plume of high-concentration CO2 and odour molecules detectable by host-seeking mosquitoes (Jatta et al. 2021). Night hours also coincided with increased occurrence of door-opening. However, the statistical analysis did not provide a clear correlation between door-opening and PPD or CO2 levels, suggesting that door-opening may be due to factors described in interviews (Table 5) and the workshop activity (Table 6), such as patients and staff frequently entering or leaving the rooms or cleaning. Factors related to thermal comfort were the most reported reason for windows and doors being left open.
In air-conditioned spaces, CO2 levels likely build up as a result of split air conditioning units recirculating rather than replacing indoor air, and rooms being kept closed to maintain cooler temperatures (Shin et al. 2021). Occupants’ thermal sensation has also been shown to become more sensitive to heat as the CO2 concentration increased (Shin et al. 2021). This factor is not captured in the PPD model used in this study.
The main entrance doors and windows to waiting spaces tended to remain open during the day. While this reduces the façade’s effectiveness as a physical barrier against mosquitoes, it helps maintain CO2 levels consistently lower in these spaces, potentially reducing the likelihood of mosquitoes finding hosts using CO2 cues alone. These spaces are also most used in the daytime, when expected peak mosquito biting hours for Culex and Anopheles mosquitoes are fewer. This underscores the complex balance in designing passive buildings for tropical climates with MBD risks, between maintaining air permeability for thermal comfort and providing a physical barrier against mosquitoes. The improved PPD levels in waiting spaces compared with wards are likely influenced by their deep plan, increased ventilation, lack of direct solar radiation and use of high thermal mass materials.
4.2 HOSPITAL BUILDING DESIGN CONTRIBUTING TO THERMAL DISCOMFORT
Higher PPD and CO2 levels in the wards are likely due to lack of ventilation and solar heat gains. The wards’ spatial arrangement, with openings typically on only one side, prevents cross-ventilation. This was worsened on the ground floor of Kivunge Surgical Ward (see Figure 10A), where the only operable windows open onto the internal ramp. Several other spatial factors in the wards impacted patient thermal comfort. Thermal images and photos shown in Figure 11 and interview feedback demonstrate overlapping design factors contributing to thermal discomfort:
ward ceiling fans located in the room centre, away from beds, reducing their efficacy;
lack of privacy screens for patients to remove clothes to improve comfort;
ward window blinds with reduced effectiveness when air flows through the window with the potential to create a heat trap inside the room (Hu et al. 2023);
some beds receiving direct solar radiation during parts of the day;
heat transfer through aluminium ward frames without thermal breaks;
large surface area around building using heat absorbing hard landscaping like concrete paving with minimal shading from trees;
exposure of building façade to solar radiation.
At the time of the study, bed nets were not used in the wards. While bed nets could reduce MBD transmission risk, they also reduce airflow by about 60% in an enclosed space (von Seidlein 2012) potentially further reducing patient comfort (Bradshaw 2010).
4.3 SHADING ADAPTATIONS TO IMPROVE THERMAL COMFORT
Solar radiation simulation results in Figure 12 show that windows, particularly on the ground floor of the north façade and east and west façades, experience high levels of direct sunlight. A systematic review by Hu et al. (2023) identifies preventing solar gains through windows as the most effective method to reduce temperature and cooling demand in hot climates. The review also highlighted the importance of cross-ventilation in hot, humid climates like Zanzibar. Figure 12 also demonstrates how simple window shading strategies, such as overhangs, horizontal shading fins and strategic tree planting, can significantly reduce direct solar radiation through windows. Selective planting around the building would also shade ground surfaces receiving high solar radiation with the potential to reduce surrounding air temperature (Gillner et al. 2015). Interviewees also suggested the installation of more fans or personal fans for each patient. These adaptations would need to be tailored to each hospital based on surrounding shading and orientation to optimise their shading effect.
4.4 STUDY LIMITATIONS
The results should be interpreted cautiously as highlighting thermal discomfort as a factor may increase the likelihood of window and door-opening, potentially providing entry points for mosquitoes, and warranting further investigation.
Fanger’s PPD model was chosen over the Adaptive Thermal Comfort model, as it was considered appropriate for the hospital spaces where users have little control over their environment or may be incapacitated due to illness. PPD results are based on several assumptions such as internal air speed, clothing level and metabolic rate, which will vary and differ from real-world conditions across the areas of the hospital included in this study. PPD may overestimate thermal discomfort in this context and adaptive comfort models, which are better suited to naturally ventilated buildings, would likely indicate lower levels of discomfort. It should also be noted that environmental and interview data were collected at different times of year, meaning that indoor temperatures may reflect varying seasonal weather conditions.
Window-opening data were not available for this study. Sensors were installed on ward windows but failed to record reliably owing to the multipanel sliding window configuration. Door-opening was only monitored in one hospital. These factors limited the assessment of window- and door-opening as creating entry points for mosquitoes.
An indicative threshold above which mosquitoes can detect CO2 was estimated at 530 ppm, based on the lowest CO2 levels detected by mosquitoes as reported in the literature (108–133 ppm; Grant & O’Connell 2007) plus average atmospheric CO2 levels (419–421 ppm; CenCO2PIP 2023). This threshold is still theoretical and has not been validated through studies. As the average CO2 concentrations captured by a single sensor in this study do not capture the localised plumes near openings thought to primarily drive mosquito host-seeking behaviour (Jatta et al. 2021), and CO2 concentrations vary temporally and spatially within rooms, this threshold should be interpreted cautiously rather than a definitive risk threshold.
The statistical analysis was exploratory in scope, and effect sizes and confidence intervals were not computed. Future studies with larger datasets should employ more comprehensive statistical modelling to better quantify the magnitude and uncertainty of associations between door-opening behaviour and environmental conditions.
4.5 CONTRIBUTIONS AND SUBSEQUENT RESEARCH
The 48-day continuous monitoring across 25 spaces in four hospitals contributes to the limited body of empirical indoor climatic data from health care settings in sub-Saharan Africa (Beauchamp-Davies et al. 2026; Roberts et al. 2022). To the authors’ knowledge, this is also the first study to empirically link thermal discomfort in health care settings with increased risk of mosquito entry.
Subsequent entomological surveillance using BG-Pro traps and Prokopack aspirators, conducted as part of the ongoing follow-up study, found mosquitoes present in wards despite screened windows and doors, supporting observations and interview data regarding the presence of mosquitoes inside the hospital despite the presence of window screens.
Together, these findings informed a set of co-created interventions targeting both thermal comfort as a risk factor for mosquito entry and therefore MBD transmission. These interventions included: personalised bed fans for each patient; extractor fans above ward doors to draw in cooler corridor air; self-closing door mechanisms and door brushes to seal floor-level gaps; repair and modification of window screens to prevent unscreened panel-opening; and façade shading using trees and climbing plants (Sloan Wood et al. 2025).
While the four study hospitals and focused analysis of Kivunge are not representative of all health care infrastructure in Zanzibar or the wider region, they share the same design as the nine district hospitals constructed in this period, suggesting that these findings and interventions are likely transferable to the remaining five. Variation in MBD transmission risk and the appropriateness of specific adaptations may nonetheless occur depending on site context, surrounding environment and the preferences of individual hospital communities.
4.6 FUTURE RESEARCH
A longer-term follow-up study is currently underway to address some limitations of this exploratory study as part of the MBD-Free Project. This will include:
environmental data across a two-year period to account for seasonal changes;
weather data from on-site weather stations to adjust for external variations;
mosquito collection from different hospital spaces to assess species composition and host-seeking behaviour;
semi-structured interviews and observations to gather qualitative data on hospital users’ experiences, comfort levels and behaviour in relation to the occupied spaces post intervention.
5. CONCLUSIONS
Between 2020 and 2030, an estimated 2.5 million new hospital beds are needed across sub-Saharan Africa to meet universal health care accessibility targets, allocated between approximately 6,200 new facilities and 1,100 existing structures requiring expansion or densification (Falchetta et al. 2020). Climate change is anticipated to increase temperatures and humidity across the region, making thermally comfortable building design more challenging while increasing the capacity of mosquitoes as disease vectors (Murray et al. 2020; Watts et al. 2021).
The new district hospitals in Zanzibar exemplify the scale of investment required to meet these health care accessibility targets, while also illustrating how the prioritisation of speed and capacity in health care construction can come at the cost of climatic design quality, resulting in thermally uncomfortable ward and clinical spaces that may increase mosquito ingress and be detrimental to other health outcomes (Lenzer et al. 2020; Shajahan et al. 2019; Tian 2023). This study also indicates that air conditioning, while lowering temperature, may increase CO2 levels through air recirculation, raising mosquito attraction risk. Prolonged exposure to elevated CO2 can impair cognitive performance (Du et al. 2020), while air conditioning systems carry significant energy, maintenance and carbon costs. Simulations conducted in this study, applying passive cooling strategies including selective planting and window shading (Gillner et al. 2015; Hu 2023), demonstrated that direct solar radiation contributing to overheating could be substantially reduced. These findings informed co-created adaptations developed with the government authority responsible for designing and constructing the hospitals, implemented in 2025 (Sloan Wood et al. 2025). Their impact on mosquito populations within hospital grounds is being evaluated as part of an ongoing pre–post intervention study (The MBD-Free Project: https://publichealth.ku.dk/about-the-department/global/research/building-resilience-to-climate-sensitive-mosquito-borne-viral-diseases/).
The co-created adaptations implemented in these hospitals demonstrate that passive cooling strategies can be retrofitted to reduce MBD transmission risk, though their impact and cost-effectiveness are greater when integrated from the design stage (Obonyo et al. 2019; Souza et al. 2024). Given the scale of health care construction anticipated in sub-Saharan Africa in the coming years, incorporating climatic design strategies into new health care infrastructure has significant potential to reduce growing MBD burdens while creating hospital environments that support better health outcomes for patients and staff while reducing operational costs.
ACKNOWLEDGEMENTS
The study is part of the MBD-Free Project, a collaboration between the University of Copenhagen, KCMC University, the State University of Zanzibar, the Royal Danish Academy, the Kilimanjaro Clinical Research Institute, the SACIDS Foundation for One Health, Instituto Nacional de Saúde, the Zanzibar Malaria Elimination Programme and the Zanzibar Ministry of Health. We thank staff and management at the study district hospitals and the Zanzibar Ministry of Health and Health Care Engineering Unit for their continued support, as well as staff at Aranet for technical assistance with the sensor network installation.
DATA AVAILABILITY
Select data captured and analysed during the study are included in this article. All indoor climatic data, thermal images and door logging data can be made available upon request after these articles are published. Python scripts used for visualisation and analysis have also been made open source: https://zenodo.org/communities/mbdfree/records?q=&l=list&p=1&s=10&sort=newest
ETHICAL APPROVAL
The study was approved by the Zanzibar Health Research Institute on 3 January 2024 (number: ZAHREC/01/PR/JAN/2024/04). Individual informed consent was not required as no personal or identifiable data were collected from patients or staff. Thermal images were captured of hospital spaces; no individuals are identifiable in these images.
SUPPLEMENTAL DATA
Three supplemental data files for this article can be accessed at: https://doi.org/10.5334/bc.657.s1
file 1: sensor installation
file 2: sensor locations
file 3: environmental data all hospitals.