
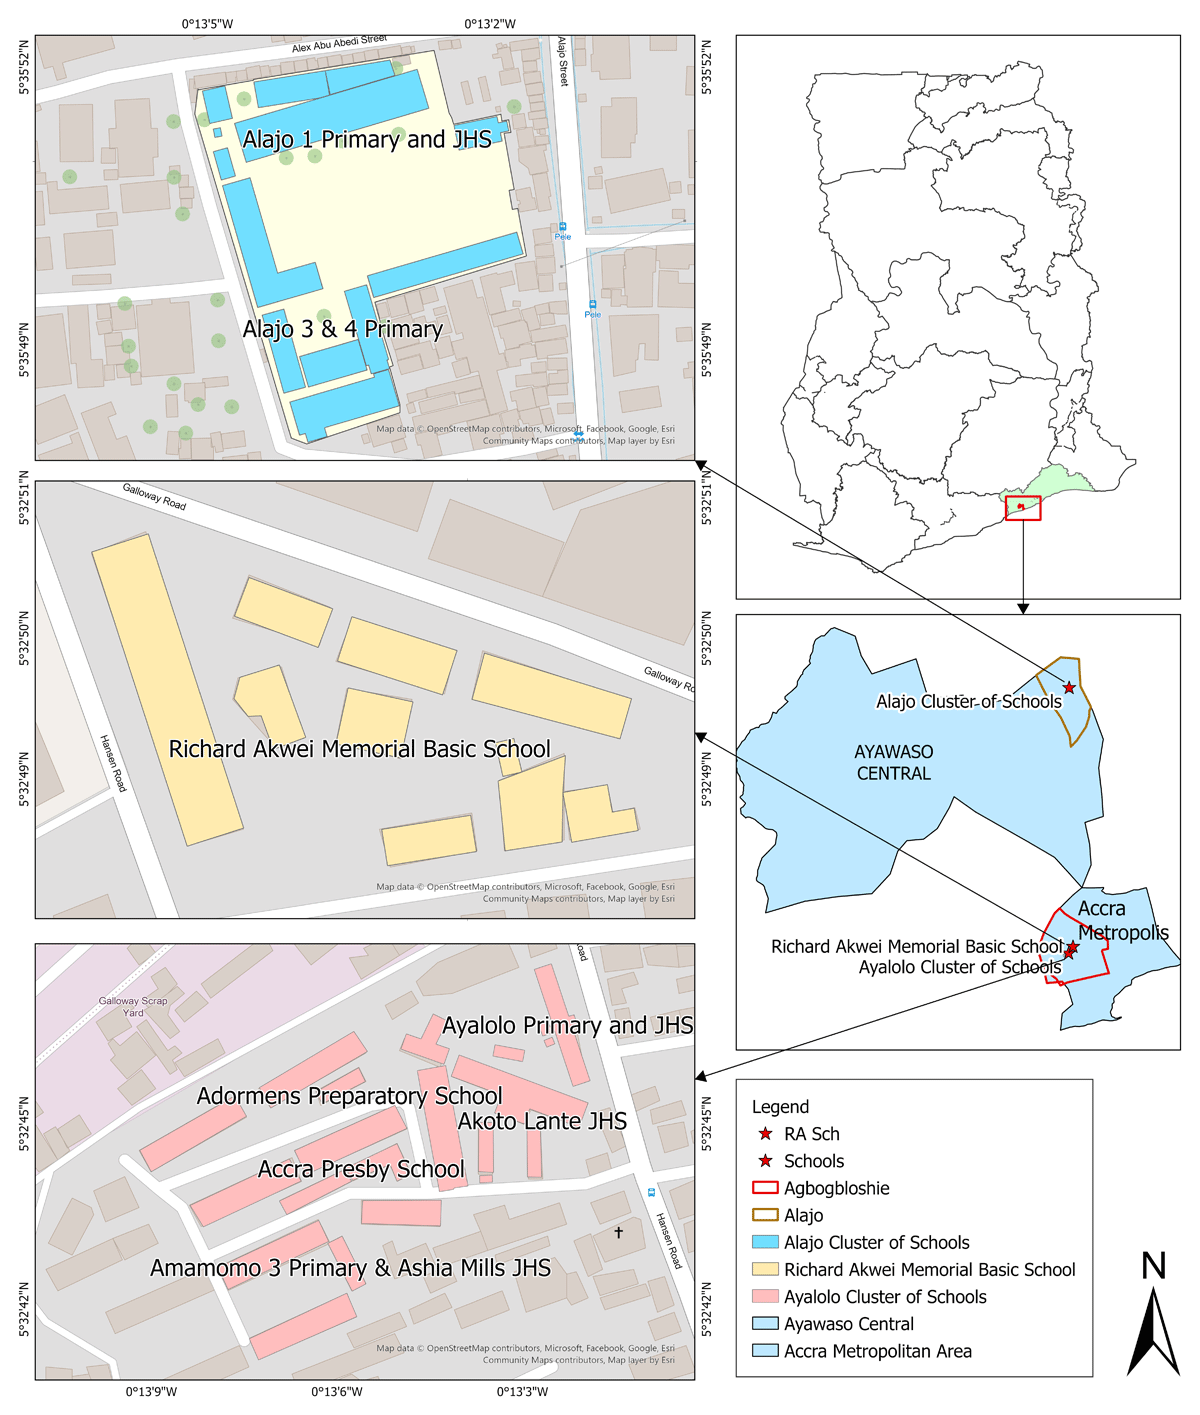
Figure 1
Map showing the schools selected for the study.
Table 1
School descriptions and construction materials.
| VARIABLE | SCHOOL A | SCHOOL B | SCHOOL C | SCHOOL D | SCHOOL E | SCHOOL F | SCHOOL G | SCHOOL H |
|---|---|---|---|---|---|---|---|---|
| Classroom code | A1 | B2–B3 | C4 | D5–D7 | E8–E9 | F10–F11 | G12–G13 | H14–H16 |
| School environment | ||||||||
| Playground | Dusty | Dusty | Concrete | Dusty | Dusty | Dusty | Dusty | Concrete |
| Greenery (trees, n) | Yes (2) | Yes (1) | Yes (2) | Yes (2) | No | Yes (1) | Yes (2) | Yes (1) |
| Building materials | ||||||||
| Wall | Concrete block | Concrete block | Concrete block | Concrete block | Concrete block | Concrete block | Concrete block | Concrete block |
| Roofing | Metal | Metal | Concrete | Metal or asbestos | Asbestos | Metal or asbestos | Asbestos | Metal or concrete |
| Classroom floor | Concrete | Concrete | Concrete | Concrete | Concrete | Concrete | Concrete | Concrete |
| Ceiling | Wood (plywood) | None | Concrete | None | None | None | None | Concrete or none |
| Overcrowding | ||||||||
| Occupancy | 46 | 30 | 50 | 35 | 35 | 25 | 47 | 26 |
| Overcrowding (%)a | 53.3% | 0% | 66.7% | 16.7% | 16.7% | –16.6% | 56.7% | –13.3% |
| Ventilation | ||||||||
| Windows | Box-like openings in walls | Box-like openings in walls | Operable wooden louvres | Box-like openings in walls | Operable wooden louvres | Box-like openings in walls and operable wooden louvres | Box-like openings in walls | Box-like openings in walls |
| Fans (n) | 4 | 6 | None | None | None | None | None | None |
| Heat source | ||||||||
| Electric lighting | Yes | Yes | Yes | No | No | No | Yes | No |
[i] Note and source: aThe Ghana Education Service’s (GES) acceptable classroom size is 30 pupils per classroom; https://www.graphic.com.gh/news/education/government-tasked-to-cut-down-class-size-to-30-students.html/.
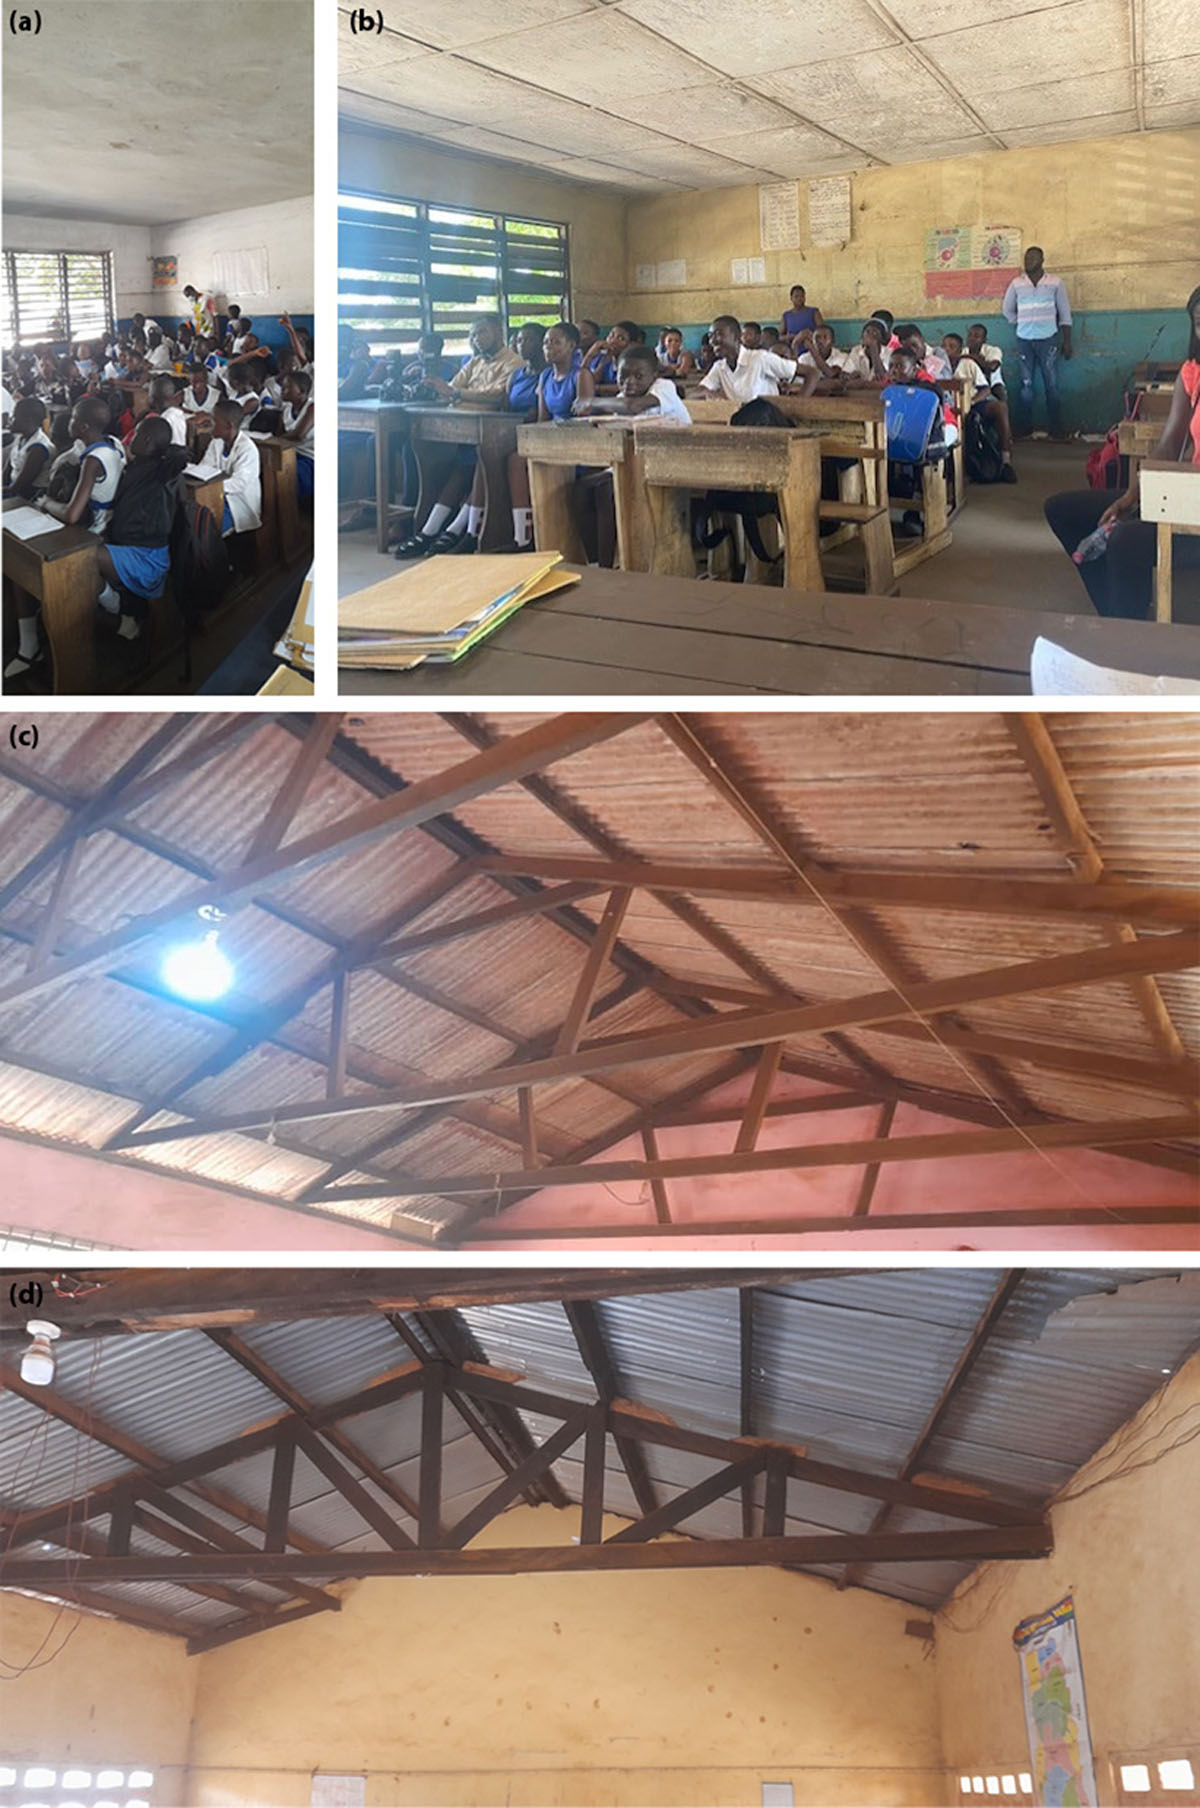
Figure 2
Different roof and window types of classrooms studied. (a) Concrete ceiling (below concrete roof) and operable wooden louvres. (b) Plywood ceiling (below metal roof) and operable wooden louvres. (c) Asbestos roof with ventilated eaves and box-like openings. (d) Metal roof and box-like windows.
Table 2
Thicknesses and thermal properties of roofing types.
| ROOFING/CEILING TYPE | THICKNESS (mm) | THERMAL CONDUCTIVITY (W/m.K) | VOLUMETRIC HEAT CAPACITY (THERMAL MASS) (MJ/m3.K) |
|---|---|---|---|
| Concrete | 125–200 | 1.15–1.78a | 2.1c |
| Asbestos | 4–6 | 0.16b | 0.74–1.47c |
| Metal | 0.3–0.6 | 50–210b | 4.6c |
| Plywood | 12 | 0.07–0.15c | 0.96–1.67c |
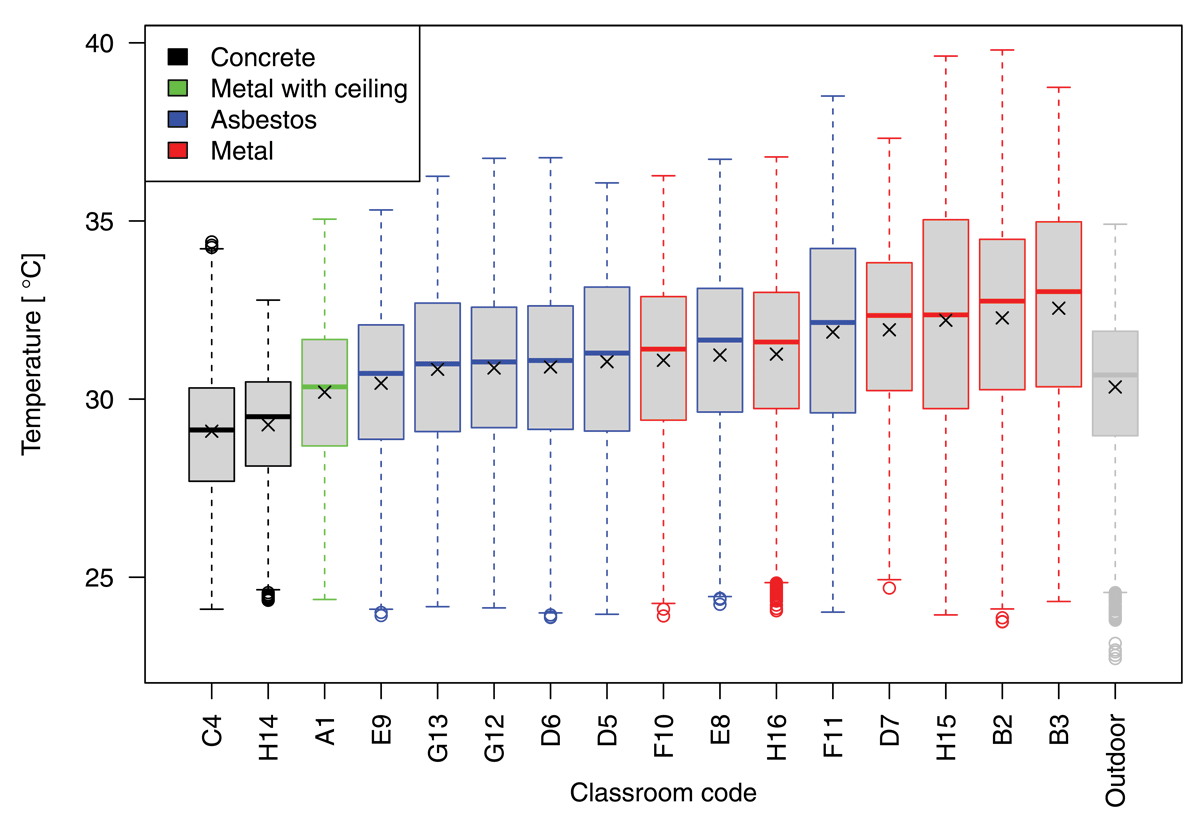
Figure 3
Box plot of indoor and outdoor temperatures during occupied hours arranged in order of ascending mean indoor temperature (outdoor temperature placed last) across the full 389-day monitoring period.
Table 3
Descriptive statistics of the temperatures recorded in each classroom during all occupied hours across the full 389-day monitoring period.
| CLASSROOM CODE | ROOF TYPE | TEMPERATURE (°C) DURING OCCUPIED PERIODS | DISRUPTED LEARNING DAYS (> 23.9°C) | |||||
|---|---|---|---|---|---|---|---|---|
| MEAN | SD | MINIMUM | MEDIAN | MAXIMUM | RANGE | (%) | ||
| C4 | Concrete | 29.1 | 1.8 | 24.1 | 29.2 | 34.4 | 10.3 | 100% |
| H14 | Concrete | 29.3 | 1.5 | 24.4 | 29.5 | 32.8 | 8.4 | 100% |
| A1 | Metal with ceiling | 30.2 | 2.0 | 24.4 | 30.3 | 35.1 | 10.7 | 100% |
| E9 | Asbestos | 30.4 | 2.3 | 23.9 | 30.8 | 35.3 | 11.4 | 100% |
| G13 | Asbestos | 30.8 | 2.3 | 24.2 | 31.0 | 36.3 | 12.1 | 100% |
| G12 | Asbestos | 30.9 | 2.4 | 24.1 | 31.1 | 36.8 | 12.6 | 100% |
| D6 | Asbestos | 30.9 | 2.2 | 23.9 | 31.1 | 36.8 | 12.9 | 100% |
| D5 | Asbestos | 31.0 | 2.4 | 24.0 | 31.4 | 36.1 | 12.1 | 100% |
| F10 | Metal | 31.1 | 2.3 | 23.9 | 31.5 | 36.3 | 12.4 | 100% |
| E8 | Asbestos | 31.2 | 2.4 | 24.2 | 31.7 | 36.7 | 12.5 | 100% |
| H16 | Metal | 31.3 | 2.3 | 24.1 | 31.7 | 36.8 | 12.7 | 100% |
| F11 | Asbestos | 31.9 | 2.8 | 24.0 | 32.2 | 38.5 | 14.5 | 100% |
| D7 | Metal | 31.9 | 2.4 | 24.7 | 32.4 | 37.3 | 12.6 | 100% |
| H15 | Metal | 32.2 | 3.2 | 23.9 | 32.4 | 39.6 | 15.7 | 100% |
| B2 | Metal | 32.3 | 2.8 | 23.7 | 32.7 | 39.8 | 16.1 | 100% |
| B3 | Metal | 32.6 | 3.0 | 24.3 | 33.0 | 38.8 | 14.4 | 100% |
| Outdoor | n.a. | 30.3 | 2.1 | 22.7 | 30.7 | 34.9 | 12.2 | n.a. |
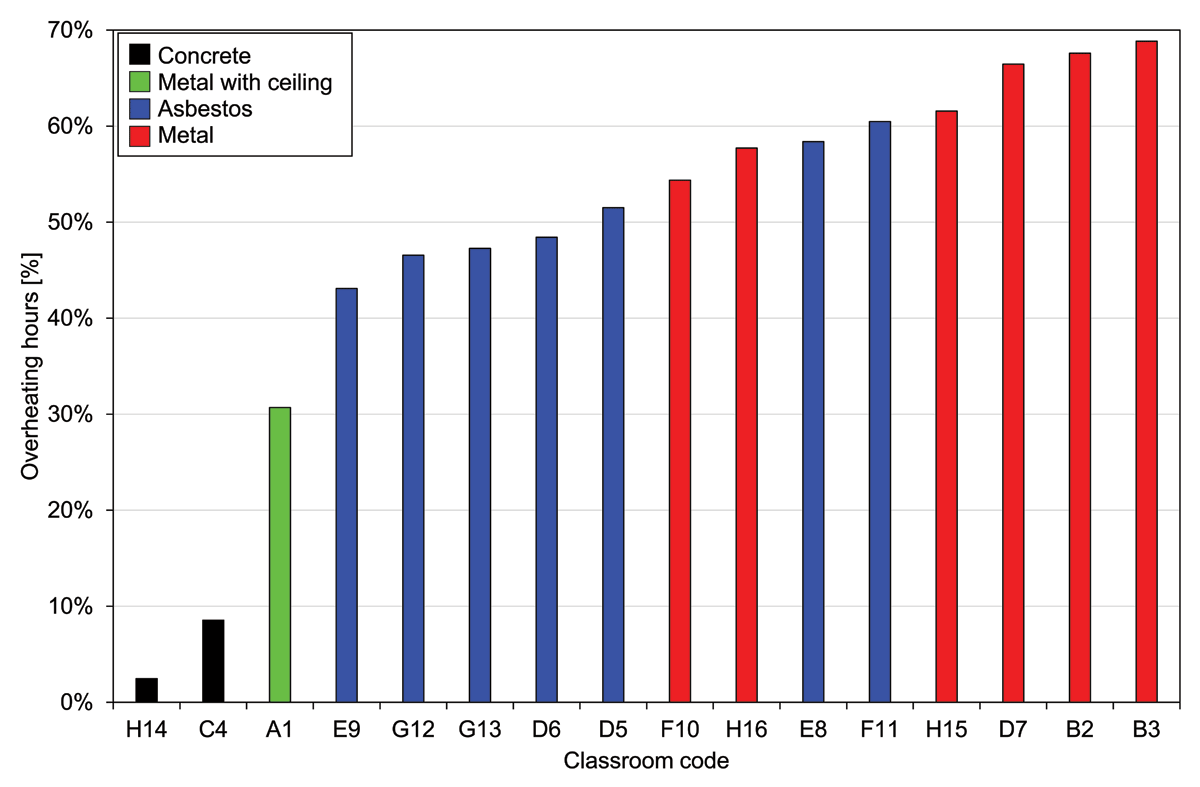
Figure 4
BS EN 16798 overheating-hours in Accra, Ghana, during all occupied hours across the full 389-day monitoring period.
Source: BSI (2019).
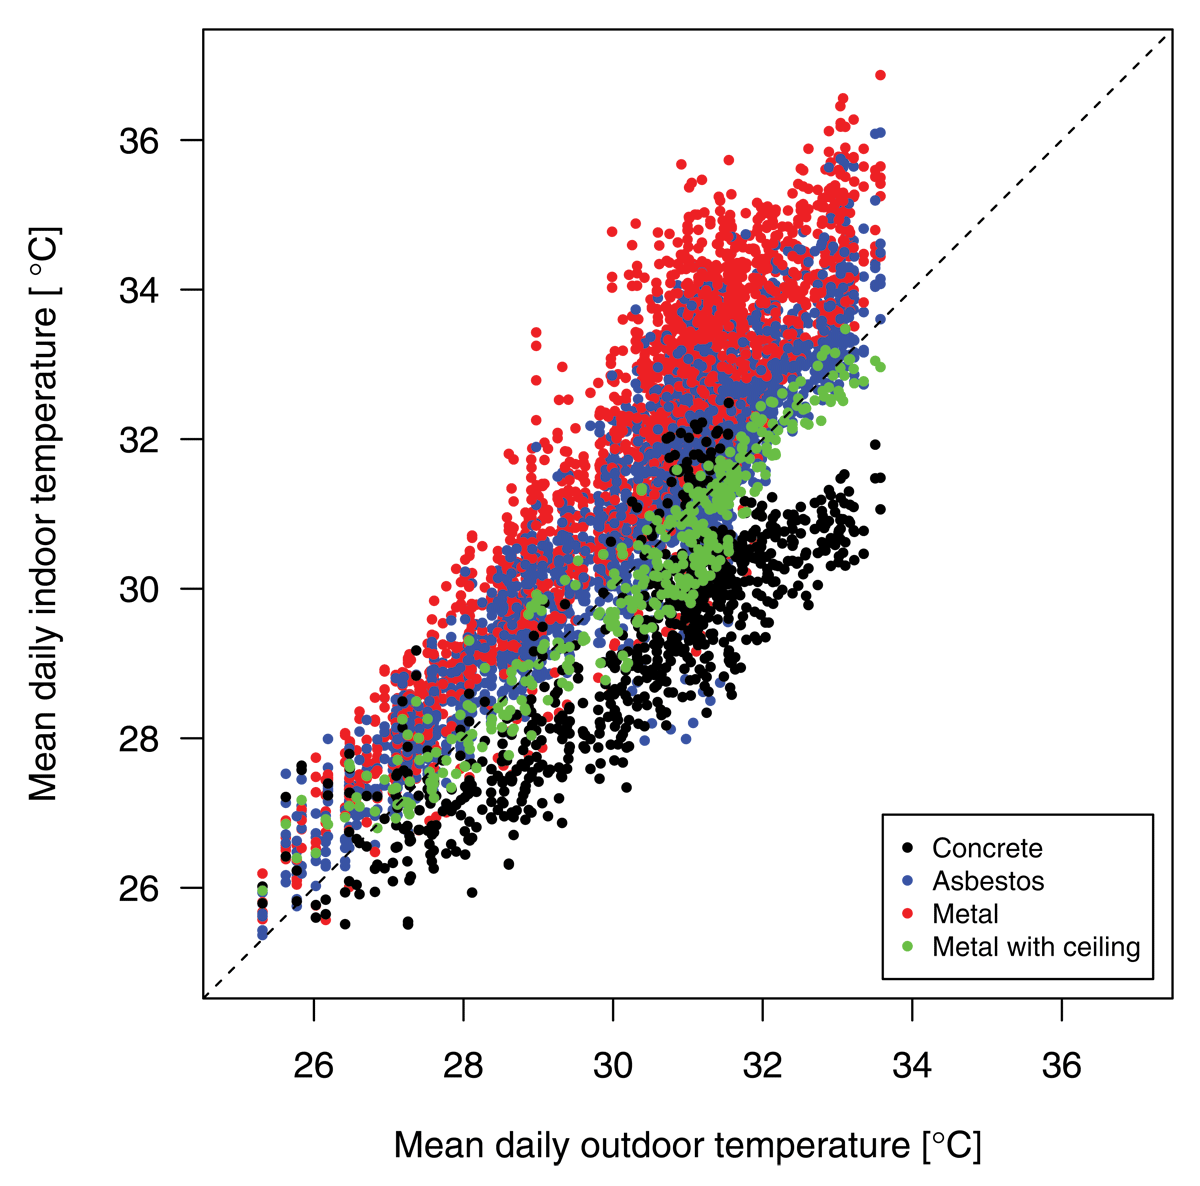
Figure 5
Mean daily outdoor temperature compared against mean daily indoor temperature for each classroom across the full 389-day monitoring period (pooled by roof type).
Note: Dot colours denote roof type. The dashed line is the line of equality (1:1).
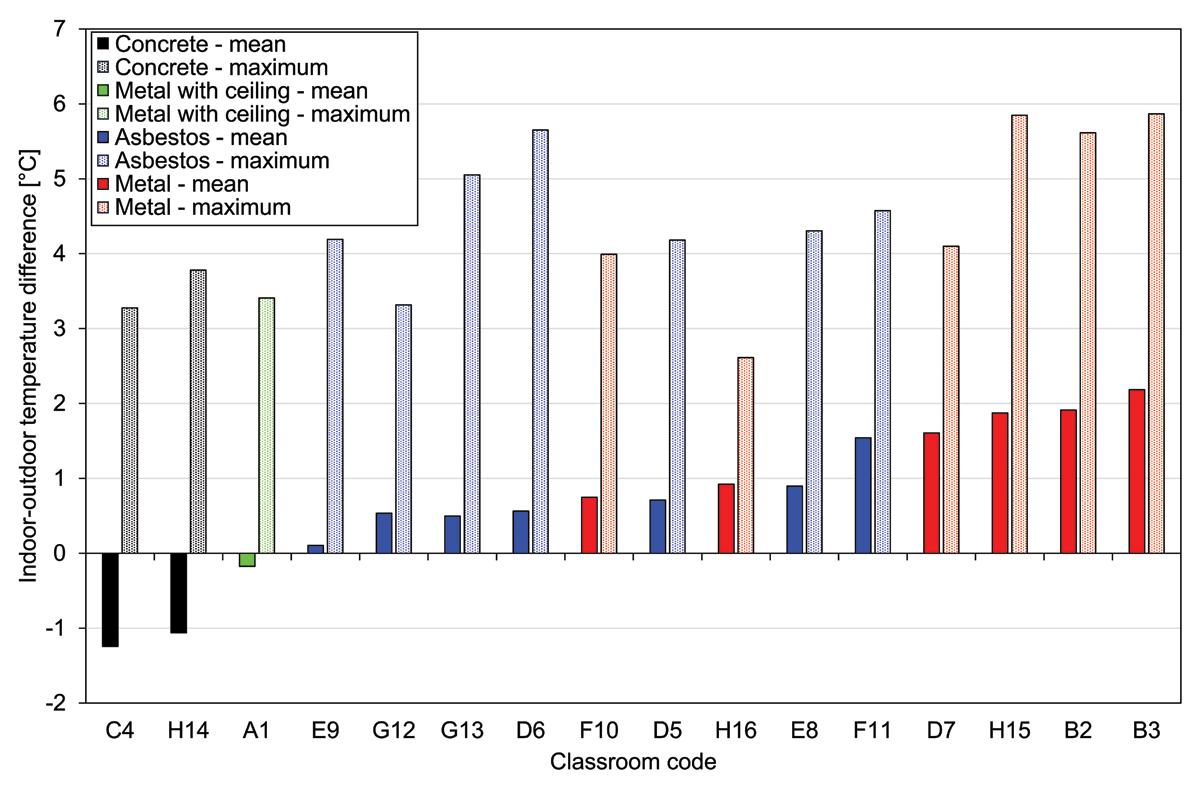
Figure 6
Mean and maximum difference between indoor and outdoor temperature in each classroom during occupied times across the full 389-day monitoring period, arranged in ascending order of mean temperature difference.
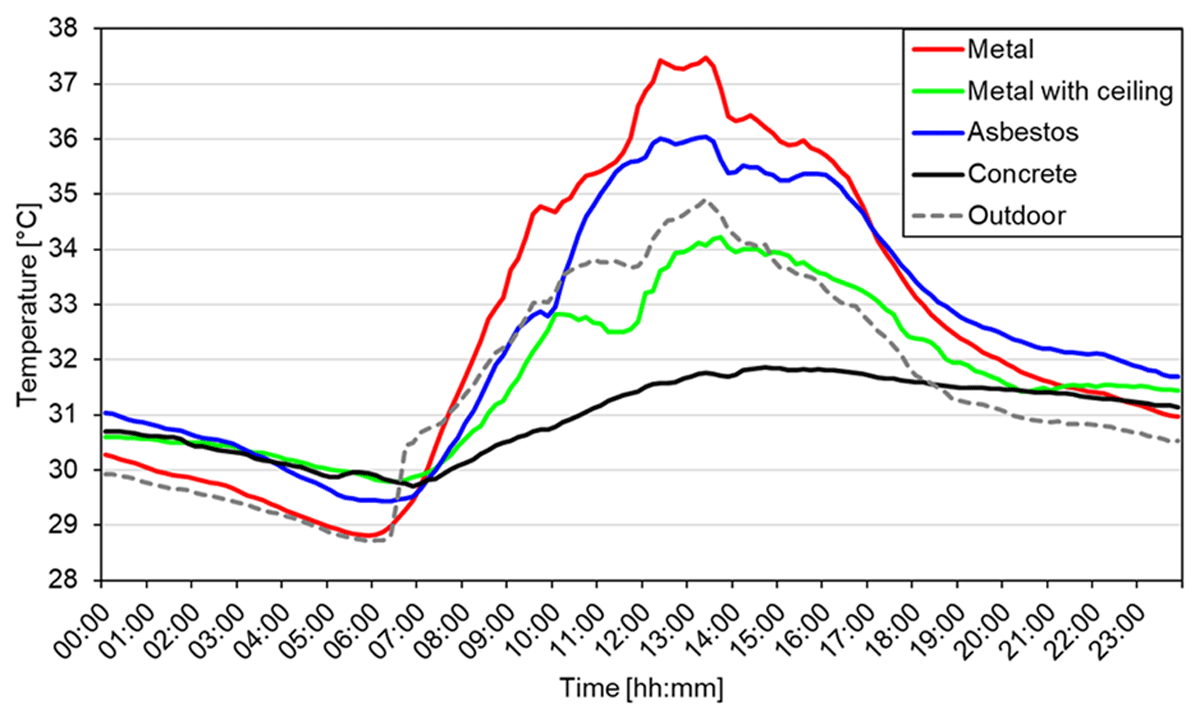
Figure 7
Temperature time-series with the mean 10-minute value for each roof type (classrooms pooled by roof type) on the 24-h day with the highest maximum outdoor temperature (9 May 2023).
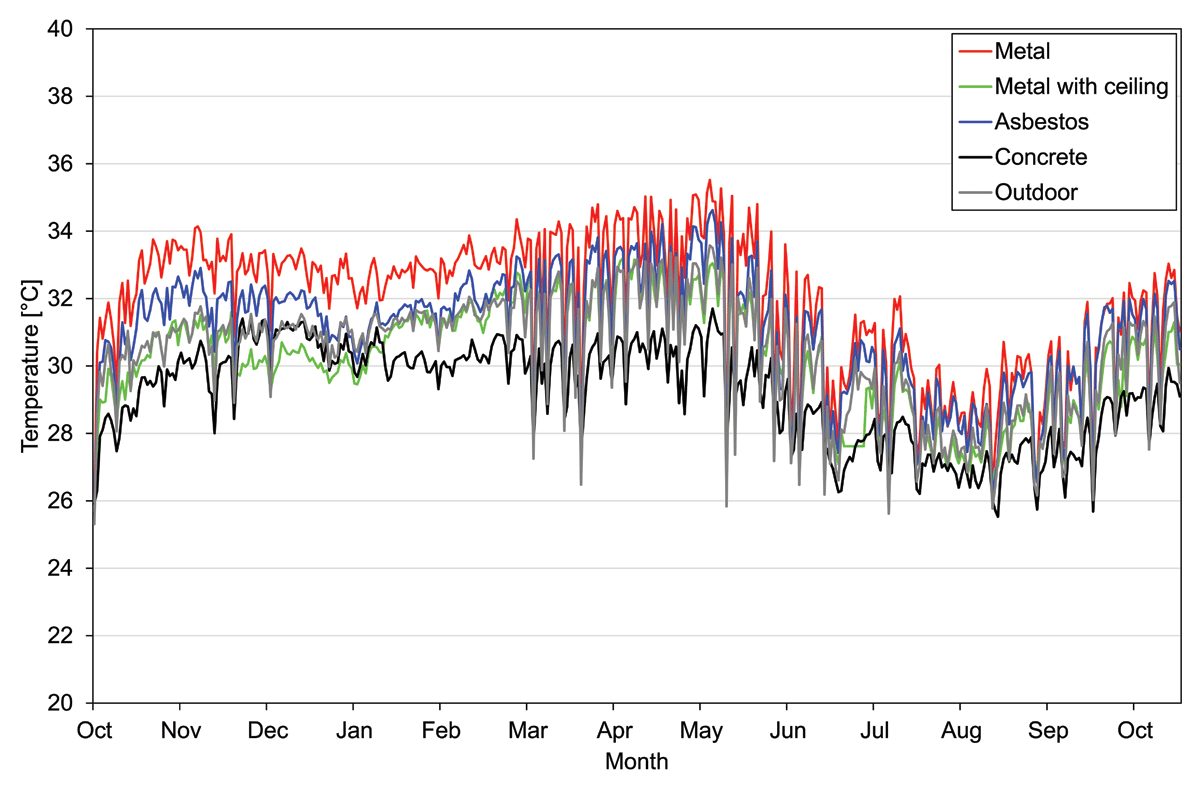
Figure 8
Temperature time-series with the mean daily value for each roof type (mean for classrooms pooled by roof type) over the entire 389-day monitoring period.