
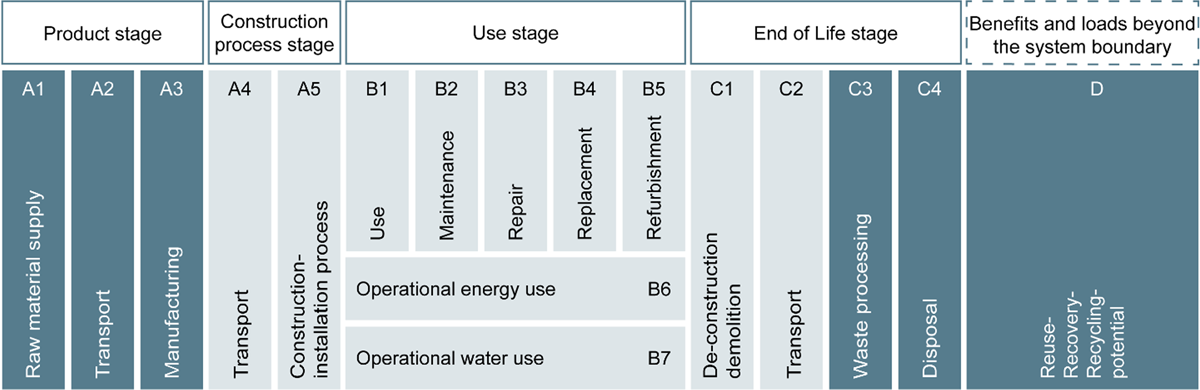
Figure 1
Life-cycle stages according EN 15978 (CEN 2012b). The included life-cycle modules are marked in dark blue.
Table 1
Conventional and circular scenarios assessed. Each scenario is based on 1 m2 of the material.
| Conventional scenarios | Circular scenarios |
|---|---|
| (A) Conventional concrete | (D) Recycled concrete (common practice) |
| (E) Reused concrete elements | |
| (B) Conventional brick wall | (F) Facade cladding with reused bricks (common practice) |
| (G) Recycled brick facade element | |
| (C) Conventional thermal window | (H) Thermal window with reused double-glazing |
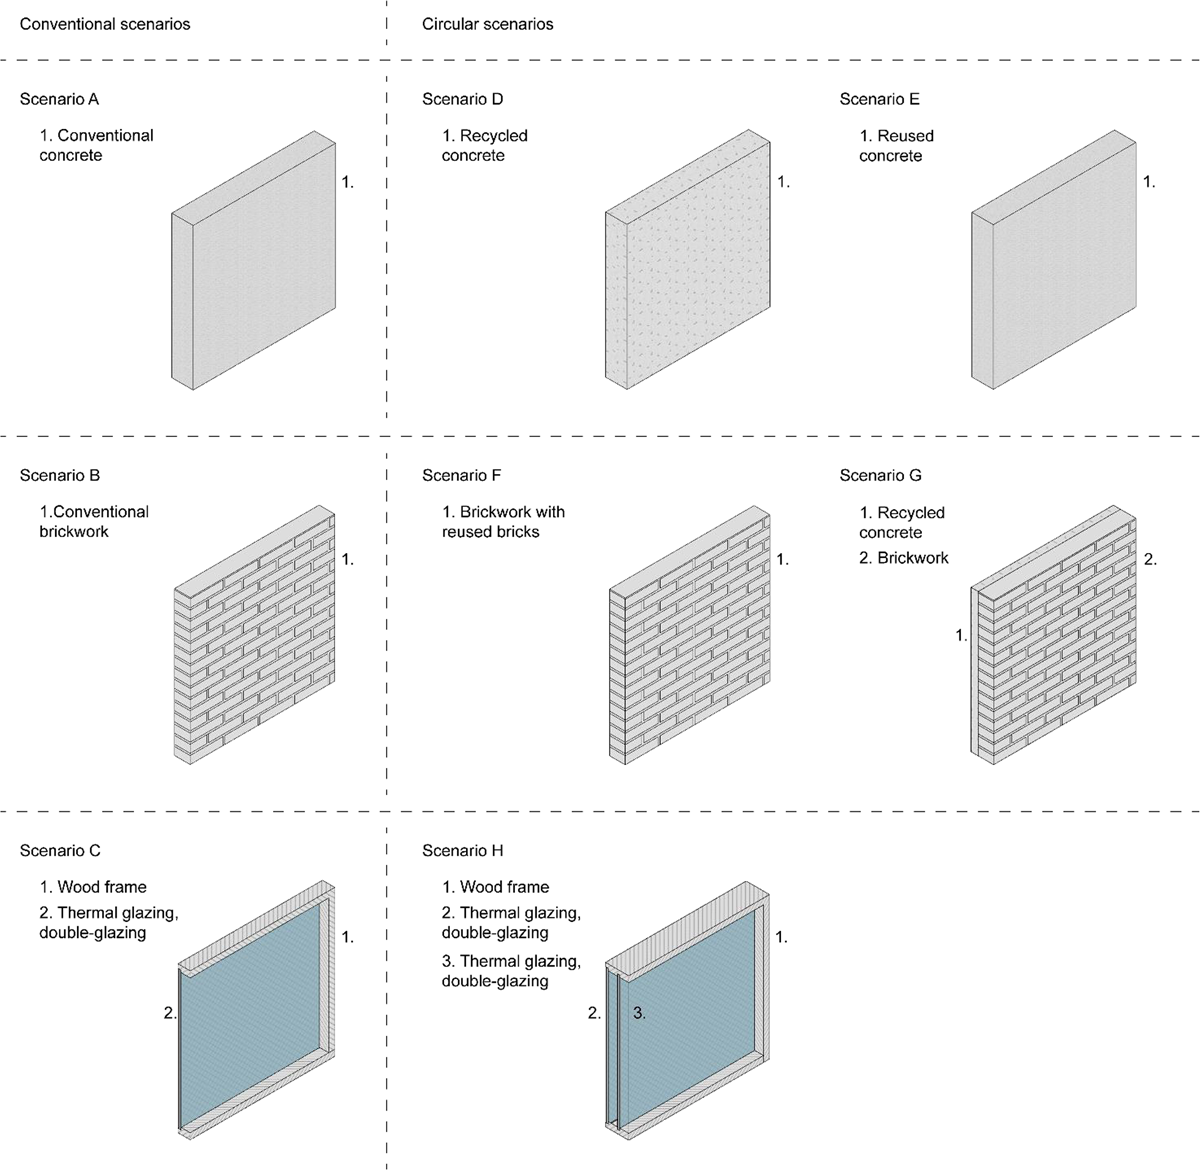
Figure 2
Composition of conventional and circular scenarios A–H.
Table 2
Qualitative uncertainty analysis of the relevant input parameters.
| Input parameter | Chosen data | Variation | Uncertain? | ||
|---|---|---|---|---|---|
| Production (A1–A3) | Waste (A1) | 10% | Minimum 5%, maximum 15% | Yes | Waste in the production of raw materials is estimated to be 10%. Based on the authors’ estimation, the parameter is considered uncertain |
| Transport (A2) | 50 km | Minimum 25 km, maximum 75 km | Yes | Transport of raw materials is assumed to be 50 km. Since the studied systems have very little empirical transport data, this figure has high variability and is thus considered highly uncertain (Danish Regions, Research Center for Environment and Resources 2017) | |
| Functional unit | Material properties and dimensions | – | – | No | Raw materials and dimensions are not considered uncertain because the input data in the compared scenarios have the same level of detail |
| Performance | – | – | No | Functionality of the circular building elements/components is equal to the functionality of the conventional ones | |
| Beyond system boundary (D) | Avoided transport | 30 km | 0 km | Yes | Avoided transport in life-cycle stage D is considered uncertain. Transport is consistently assumed to be 30 km. However, a conservative future scenario may in fact be 0 km because future technology might allow local recycling to a higher degree than today |
Table 3
Greenhouse gases (GHG) for three conventional and five circular scenarios.
| Scenario | Stages A1–A3 (kg CO2e/m2) | Stages C3 and C4 (kg CO2e/m2) | Sum (kg CO2e/m2) | Stage D (kg CO2e/m2) |
|---|---|---|---|---|
| (A) Conventional concrete | 99.1 | 3.7 | 102.8 | –10.3 |
| (D) Recycled concrete | 95.4 | 3.7 | 99.1 | –7.9 |
| (F) Reused concrete elements | 0.4 | 3.7 | 4.0 | 0.0 |
| (B) Conventional brick wall | 66.4 | 1.1 | 67.4 | –3.3 |
| (E) Facade cladding with reused bricks | 14.4 | 1.1 | 15.5 | –0.7 |
| (G) Recycled brick facade element | 24.1 | 1.5 | 25.6 | –0.1 |
| (C) Conventional thermal glazing | 43.5 | 0.3 | 43.8 | 0.0 |
| (H) Thermal window with reused double-glazing | 1.4 | 0.6 | 2.0 | 0.0 |
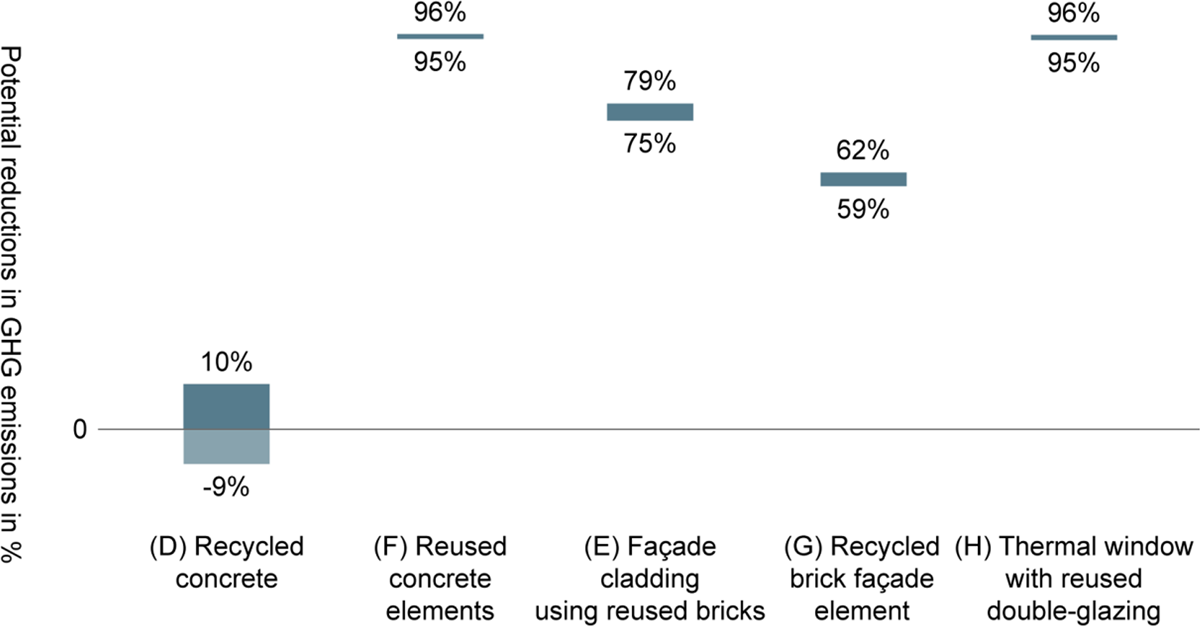
Figure 3
Potential reduction of greenhouse gas (GHG) emissions (%) when comparing five circular scenarios with three corresponding conventional scenarios, including the ranges found from the sensitivity analysis (see Table S22 in the supplemental data online). The reductions in GHG emissions are associated with providing and disposing of the elements/components.
Table 4
Screening of potential reductions in greenhouse gas (GHG) emissions for the circular scenarios.
| (D) Recycled concrete | (F) Reused concrete elements | (E) Facade cladding using reused bricks | (G) Recycled brick facade element | (H) Thermal window with reused double-glazing | |
|---|---|---|---|---|---|
| Reduction in GHG emissionsa (kg CO2e/m2) | –7.5 to 10.2 | 83.6–93.3 | 45.7–53.0 | 34.5–42.9 | 39.7–43.9 |
| Waste available nationally (tonnes)b | 1,182,000 | 1,182,000 | 211,000 | 211,000 | n.a. |
| National potential reduction in GHG emissions (thousands of tons CO2e/year)c | –18,800 to 25,500 | 67,100–78,800 | 22,600–26,200 | 13,700–17,100 | – |
| Assumptions | All waste concrete available is used for recycled concrete | 50% of the waste concrete available is reused as complete elements instead of being disposed of (Danish Environmental Protection Agency 2015) | Brickwork with cement mortar is too strong to separate brick by brick. Thus, only bricks laid with lime mortar can be reused, corresponding to 50% of the demolished brickwork in Denmark (Sandahl 2019) | Brickwork with cement mortar is particularly suitable in this scenario due to its strength. In this scenario, brickwork with cement mortar is recycled as a facade element corresponding to 50% of the waste bricks produced in Denmark (Sandahl 2019) | Since only limited data on the generation of waste thermal glazing exist, it is not possible to estimate the potential national reductions |
[i] Notes: a The reductions in kg CO2e/m2 are based on Figure 3, where the reductions are shown as percentages. The ranges in reductions are found from the sensitivity analysis (see the supplemental data online), where the derivation of the data results in a negative figure in scenario (D) Recycled concrete.
b Data were obtained from the Danish Environmental Protection Agency (2019).
c Reductions/m2 (the first row) are scaled to a national level by coupling waste amounts and the consumption of waste in each circular scenario.