
1. Introduction and theoretical background
Waiting times to access the UK’s National Health Service (NHS) have risen significantly over the last decade. Ophthalmology, with over 8 million outpatient attendances annually (NHS 2023), is severely affected. In 2017, a total of 3384 ophthalmology patients waited for more than a year, and 1% of these suffered preventable loss of eyesight (Foot & MacEwen 2017). The COVID-19 pandemic exacerbated these problems, partially due to both a suspension of services and fewer patients attending scheduled appointments. Moorfields Eye Hospital NHS Trust in London, for example, saw half as many patients as usual in the period 2020–21 (Moorfields Eye Hospital NHS Foundation Trust 2021).
To support the recovery of services, in February 2021 the hospital opened the ‘Hoxton Hub’, a technician-led clinic offering diagnosis and monitoring to patients with glaucoma and retinal diseases. This built on processes at a ‘virtual clinic’ for glaucoma patients led by technicians (Kotecha et al. 2015b) with results reviewed by clinicians asynchronously.
Hoxton was established with a non-traditional, spatially enforced test sequence, as outlined by Kotecha et al. (2015a). With three parallel lanes aimed at leading patients through the required tests in strict sequence, this aimed for efficiencies through clearly structured patient flows. In contrast, another technician-led clinic (Cayton Street) was configured with testing stations arranged in spatial clusters inside a larger open-plan space with less obvious patient routes. While offering a clear spatial strategy, the restrictive linear arrangement of test stations raises questions of operational effectiveness.
Therefore, this paper combines clinical expertise in ophthalmology with architectural scholarship and operational research perspectives. It uses direct observations of diagnostic test durations to establish a baseline dataset of current practices, spatial analysis methods rooted in space syntax (Hillier & Hanson 1984) to understand consequences of layout choices and queuing simulations using observed durations to identify bottlenecks, assess current set-ups under different workloads, and suggest improvements.
The following sections contextualise the study in the relevant literature.
1.1 The spatial layout of diagnostic centres
Space syntax theory argues that spatial structures constitute behaviours; it ‘allows us to think of space as already social’ (Peponis 2024: 134) and to analyse how spatial configurations provide an opportunity structure (Sailer & Li 2022) for everyday life.
Space syntax considers space as a network, investigating elements (rooms, corridors, staircases) and their connections (doorways) by means of graph theory, providing quantitative measures of how integrated a location is in the overall spatial configuration, how people can move from one location to another, how they perceive space from any particular location, and what this means for the potential of a space to be filled with human life. Research across building types demonstrates that integrated spaces with shorter paths to all other spaces in a network are livelier and more populated (Hillier et al. 1996; Hillier & Penn 1991; Peponis et al. 1990; Sailer & Li 2022).
Space syntax has been applied at urban and architectural scales, and at the building level to healthcare (Zook & Sailer 2022). Most of this research has been on hospitals as a whole (Peponis & Zimring 1996; Haq & Luo 2012; Peponis et al. 1990) or on inpatient wards (Lu & Zimring 2011; Pachilova & Sailer 2020; Rashid 2015). There is a plethora of research on the layout of hospital wards with little space syntax focus but instead including time and motion studies of staff (Thompson & Goldin 1975; Hendrich et al. 2008).
A focus on the spatial structure of outpatient clinics has been rare, although noteworthy exceptions exist, e.g. an investigation of spatial hierarchies of outpatient departments in four Korean geriatric hospitals including implications for cognition and wayfinding of the elderly (Lee et al. 2015); or the comparison of work patterns of physicians, nurses and clerks in clinics in a Canadian hospital versus one in the Netherlands in relation to their spatial configuration (Sailer et al. 2013). A further paper argued that more open-plan layouts resulted in more dynamic work patterns (Sailer 2024). None of these papers on outpatient clinic layouts investigated patient flows in detail.
Patient flows were the focus of a comparative study of spatial layouts beyond the space syntax paradigm; it investigated architectural design alternatives with centralised or decentralised waiting areas for an ophthalmology clinic using agent-based modelling (Schaumann et al. 2019). The decentralised design improved nurses’ travel distances and patient throughput but potentially created physical bottlenecks and performed worse on other performance indicators. Detailed layout choices were not modelled.
In summary, studies of the spatial layout of diagnostic clinics are rare, although those on wider healthcare settings provide additional context.
1.2 Patient flow and operational effectiveness
Operational research including queuing analysis (Lakshmi & Sivakumar 2013) and optimisation (Crown et al. 2017) has wide application in healthcare (Utley et al. 2022), with micro-simulation (Brailsford et al. 2009) particularly suited to modelling the operation of outpatient clinics (Philip et al. 2023) and evaluating their ostensive processes, i.e. their schematic and abstract principle (Feldman & Pentland 2003). Viana et al. (2020) simulated a multi-process pathway to identify bottlenecks and find allocations of resource that would increase the number of patients to which a post-term pregnancy clinic could cater.
Pan et al. (2015) built a discrete event simulation (DES) of an ophthalmology outpatient clinic and ran in-silico experiments demonstrating the potential benefits of changing the appointment system and adopting dilation-free retinal imaging. Lin et al. (2017) used DES to improve performance at an ophthalmology clinic where different patient groups take distinct paths through multiple activities. By changing resource allocation across the activities, they reduced by 43% a composite measure of congestion, patient waiting and staff overtime.
1.3 Combining spatial layouts and operational simulations
Few studies have considered both spatial and operational aspects of healthcare settings. Morgareidge et al. (2014) used DES and space syntax analysis sequentially to inform and then evaluate an emergency department’s location in a hospital’s master plan and its detailed spatial layout, highlighting the operational and spatial performance of a new design. Halawa et al. (2020) reviewed operational research approaches in hospital facility design and concluded that interdisciplinary work is required to span the considerations embedded in operational research models (e.g. walking distances) and those that occupy designers (sightlines, access to natural light, etc.). They call for optimisation frameworks that encompass these diverse considerations and recommend simulation optimisation (Wang & Demeulemeester 2023).
Aiming to support architects making layout decisions, Li et al. (2023) used multi-objective optimisation to identify Pareto-optimal candidate layouts for detailed evaluation through agent-based simulation. Jia et al. (2023) found that few studies using simulation to identify improvements in patient flow consider explicitly the spatial layout of services, and that these lack clear representations of layouts.
In summary, while combining spatial and operational analysis is fruitful, the literature has gaps, e.g. in using detailed spatial models and applications to diagnostic clinics.
2. Research aims
This paper compares and contrasts two spatial layouts for outpatient eye examinations to gain insights into the spatial and operational set-ups likely to improve the flow of patients in time and space against the background of long NHS waiting lists.
2.1 Study focus
This study uses finer grained spatial analysis techniques than the axial line models used by Morgareidge et al. (2014). Instead of conceptualising each corridor as a line of movement and connecting them to a network, models of visibility and isovist analysis are employed that represent human perception more closely (Wiener et al. 2007; Sailer et al. 2021), which is useful for the smaller scale environments of diagnostic centres.
The paper does not integrate considerations of space syntax within optimisation or process simulation but, similar to Morgareidge et al. (2014) and Li et al. (2023), uses space syntax methods, micro-simulation and simple optimisation techniques separately in an interdisciplinary study of clinic layouts to provide insights into future clinic design.
2.2 Research questions
The following research questions are addressed in this paper:
What implications do the spatial network structures of the two clinics have on flow processes?
Can the test stations be arranged differently to ease the diagnostic process?
3. Methods and data
3.1 Study context
This study compares two glaucoma clinics at Moorfields Eye Hospital NHS Trust in London: the Cayton Street clinic and the newer Hoxton Hub.
A standard patient examination process for glaucoma patients consisted of a series of five diagnostic activities, also referred to as ‘stations’ in the following, as each piece of examination equipment was provided at a different table and patients moved from one station to another.
The stations were: (1) a test of visual acuity (VA) using a chart on the wall; (2) the measurement of a patient’s refractive error using a focimeter in Cayton Street and an autorefractor (AF) at Hoxton; (3) eye pressure and corneal biomechanics on an ocular response analyser (ORA); (4) a visual field test on a Humphrey field analyser (HFA); and (5) retinal imaging by optical coherence tomography (OCT). The typical duration of each examination varied, where VA, AF and ORA would be expected to be shorter, while HFA and OCT were expected to take longer.
Glaucoma patients in Cayton Street were seen in two open-plan examination rooms linked by a corridor connecting to a central waiting area (Figure 1). Room 1 contained one VA, one ORA, one focimeter, two OCTs and four HFAs. Room 2 contained two VAs, two ORAs and two HFAs.
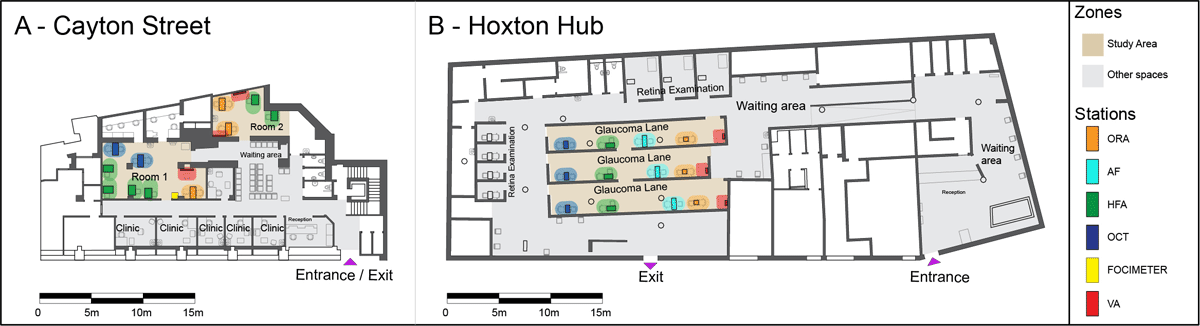
Figure 1
Annotated floor plans of the two clinic layouts.
Note: The focus area of the study is shown in light brown, spaces outside of it in grey. The five different types of stations are highlighted by coloured dots: orange = ocular response analyser (ORA); cyan = autorefractor (AF); green = Humphrey field analyser (HFA); blue = optical coherence tomography (OCT); yellow = focimeter; and red = visual acuity.
In the original 2017 layout of the Cayton Street clinic, the glaucoma pathway used only the larger room (room 1), with direct sightlines among all technicians. However, due to the COVID-19 distancing regulations in place at the time of the study (summer 2021), both rooms were used concurrently.
The glaucoma pathway at Hoxton comprised three lanes with a waiting area at the beginning of the lanes and another at the end of the lanes. Each lane contained one station per exam type in the order VA, ORA, AF, HFA and OCT. The wall partitions were high with no visibility between lanes bar an opening in the middle of each lane which allowed staff and patients to switch lanes if necessary.
3.2 Ethics
The study and its protocols (see file S1 in the supplemental data online) were classed as service evaluation and approved by the board of the Moorfields NHS Trust (reference number CA/GL/1609). A full-risk assessment was undertaken and approved by the university. No personalised data were collected; all staff were informed in advance and gave oral consent. Patients were informed at reception of the presence of service evaluation observers.
3.3 Data collection and sample
Fieldwork was undertaken in June–July 2021 as a precursor to the larger HERCULES study at Moorfields Eye Hospital NHS Trust (Muhundhakumar et al. 2024). Two main datasets were collected: (1) up-to-date floor plans of each clinic annotated with the locations and types of diagnostic equipment; and (2) direct observations of glaucoma patient flows, recorded on tablets, including time stamps of clinic entry and exit, and the start and end times for all diagnostic tests.
At reception, patients received a sticker with an ID number, which was recorded by observers as an identifier. Over the course of 10 days of observations, 22 shifts of 3–4-h lengths were covered. A total of 14 patients at Cayton Street and 11 patients at Hoxton were shadowed for their entire journey through the clinics, with an average duration of 36 min (range = 19–70 min) and 37 min (range = 26–79 min), respectively. The majority of the data, however, were captured by ‘zonal’ observations, where each observer was placed in a position to monitor a discrete space and all diagnostic activities within it, resulting in a total of 152 and 83 unique patients observed in the clinics, respectively. Full patient journeys were then reconstructed using the patient identifiers. Aggregating data from both methods gave a sample of 571 single-activity durations in Cayton Street and 436 in Hoxton, hence n = 1007.
3.4 Patient and technician data
Observers recorded an identifier for each technician from their name tags, with records anonymised prior to the analysis of technician workflows.
The observers assessed the fluency in English of each patient (‘fluent’, ‘few issues’, ‘many issues’ and ‘translator’). Patient IDs were cross-referenced by hospital staff to their patient database, obtaining additional information including age, gender and if the patient was a first-time or a follow-up patient.
The observers also made qualitative notes, including reasons for delays occurring, causes for waiting, patients with mobility difficulties, etc.
In summary, for each diagnostic activity, the following data were used: (1) patient ID; (2) date; (3) exact time stamps for the moment a patient sat down at each station (start time) and (4) got up again (end time); (5) station number; (6) technician ID; (7) English fluency; (8) age; (9) gender; and (10) qualitative notes (see file S1 in the supplemental data online for details).
3.5 Space syntax metrics
A visibility graph analysis (VGA) was performed to analyse the intervisibility between locations based on isovists (Benedikt 1979). An isovist represents all visible areas on the floor plan around a generating point in 360°. A grid spacing of 0.6 × 0.6 m was imposed on top of the floor plans (roughly the area a person occupies in space) and an isovist constructed from the centre of each pixel of the grid, with every pixel directly visible in an isovist area connected. Thus, the pixels serve as vertices and the visibility relationships between pixels as edges in a visibility graph of locations within space (Turner et al. 2001). depthmapX software (depthmapX development team 2020) was used to generate and analyse the visibility graphs. The VGA was constructed at eye level based on the assumption of seeing as an important mode of perceiving buildings (Hanson 1998).
The following VGA metrics were used:
Step depth (SD) between two locations: the shortest visual distance between two points of interest, or how many visual steps it takes (equivalent to ‘looking around the corner’) to gain awareness of one station starting from another.
Mean depth (MD) of a location: the mean SD from that location to all other locations in the spatial network. Areas of higher MD are visualised in cooler colours in a heat map while lower MD is shown in warmer ones.
Mean MD of a spatial network: the mean MD value of all isovist-generating locations in a spatial network.
3.6 Queuing simulation
To characterise the ostensive process design of an observed or hypothetical clinic, a diagram was constructed specifying the permitted patient pathway(s) through a set of stations.
A micro-simulation model was built to compare the anticipated performance of different clinic process designs in terms of patient waiting time, queue sizes, equipment utilisation and overall clinic duration. The simulation used queue departure computation (Ebert et al. 2020), a computationally efficient way of studying networks of queues that gives equivalent results to the more flexible approach of DES.
The clinic simulation was implemented in R v.4.2.2 (R Core Team 2022) using the package Queue Computer (Ebert et al. 2020). The code and input data are publicly available (Sailor et al. 2024) (see file S2 in the supplemental data online for the procedures).
For each clinic process-design considered, its anticipated performance in a clinic session for 60 patients scheduled to arrive in batches of three was evaluated. To understand how performance varied with increasing work intensity, six experiments were conducted for each design, with the interval between batches reduced from 30 to 5 min in steps of 5 min.
The simulation was run 100 times for each experiment, with the associated appointment schedule determining the clinic arrival times for the 60 hypothetical patients. A set of five activity times for each hypothetical patient was selected at random (with replacement) from the sets of activity times observed among patients at Hoxton. To focus on differences in performance intrinsic to clinic process design, the Hoxton activity times were used in all experiments, and simplifying assumptions were made that all patients would attend on time, with all transit times between activities set to 10 s.
Activity times for the 60 hypothetical patients differed from run to run within an experiment, but were identical for corresponding runs in different experiments (across ostensive process designs and work intensities) to strengthen comparisons.
Finally, performance measures for each clinic process design under each experimental setting were calculated from the output of the 100 runs corresponding to that experiment.
Three of the process designs simulated came from discussions with consultant ophthalmologists on the research team and related to intended operations at the two clinic sites. In short, they were: (1) lanes of grouped activities (group 1 = VA, ORA and AF, group 2 = HFA and OCT) with queuing only between groups; (2) lanes of ungrouped activities with queuing at every transfer; and (3) clusters with three stations per activity with queuing at every transfer. A fourth process design was obtained by solving the integer linear programming problem shown in Figure 2 to give an allocation of capacity across the diagnostic activities that accounts for their mean durations. Diagrams of all four models are presented in the results section (Figure 8).

Figure 2
Overview of the analytical optimisation approach used to determine what would constitute a balanced allocation of resources across the five different activities if constrained to a maximum total number of stations.
4. Results
The results are presented for each research question in turn.
4.1 Implications of the spatial layout of the clinics for patient flow
Differences in the spatial logic of the two clinics—clustered stations across two rooms in Cayton Street and the strictly linear organisation of Hoxton—have clear consequences for patient flows.
First, these differences are evident in the VGA of the clinics, particularly the SD analysis. While Hoxton is deeper overall regarding MD (Table 1 and Figure 3a–b), this is merely a size effect reflecting the overall larger clinic area. The clinics are comparable in that the circulation and waiting areas are highlighted as central spaces (Figure 3a–b, in red) as expected. What differs significantly, however, is the SD from one station to another, as shown for an ORA as an example (Figure 3c–d). While at Hoxton all stations in each lane are fully intervisible with neighbouring lanes only one step away, at Cayton Street it takes two visual steps despite the smaller clinic size to switch between rooms 1 and 2.
Table 1
Mean depth (MD) statistics showing minimum, mean, maximum MD and standard deviation (SD) of Cayton Street and the Hoxton Hub.
| CLINIC | MINIMUM MD | MEAN MD | MAXIMUM MD | SD MD |
|---|---|---|---|---|
| Cayton Street | 1.7 | 2.4 | 3.7 | 0.4 |
| Hoxton Hub | 1.9 | 2.7 | 4.9 | 0.4 |
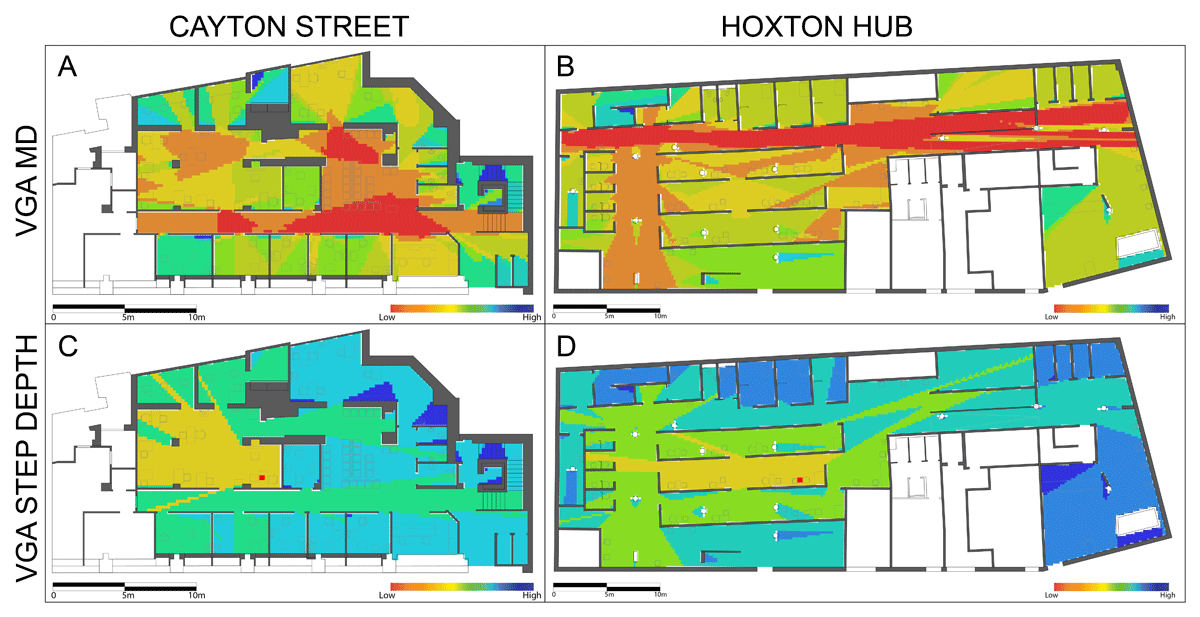
Figure 3
Visibility graph analysis (VGA) diagrams of the spatial logic of the two clinics in Cayton Street (a, c) and the Hoxton Hub (b, d).
Second, the spatial logic of each clinic is reflected in the patient flow, most clearly seen when patient journeys are plotted from entrance to exit via all stations in a Sankey diagram (Figure 4).

Figure 4
Sankey diagrams of patient flow in (a) Cayton Street and (b) the Hoxton Hub.
Note: The thickness of the grey lines corresponds to the number of patients being transferred from one station to the other. Room 2 in Cayton Street is marked with a dotted red line.
Consistent with the linear spatial logic of Hoxton, the patient flow followed the spatial configuration of the lanes with minimal movement between them (Figure 4b), while Cayton Street performed much more organically with more loops that highlight an order deviating from the ostensive routine. The main spatial structure of the two rooms of Cayton Street is visible in the flow diagram, too (Figure 4a), with stations 9–11 and 15–16 placed in the smaller room 2 being more interlinked with each other than the remaining stations of the same type (stations 1–6). The transfer from room 2 to room 1 mostly happens to access the OCT stations (stations 7–8). Therefore, generally, journeys starting in room 1 remained there, whereas those starting in room 2 had to switch spaces.
Naturally, in both clinics, where possible, the next available station in easy reach and within line of sight was preferred by technicians, rather than switching rooms or lanes unnecessarily. This may seem obvious but essentially highlights the importance of sightline relations among the stations within a patient journey. While the transfer from one station to the next is, by design, obvious in Hoxton, sightlines are not always guaranteed in Cayton Street. This complicates the job of the technician. Imagine starting in room 2 and completing the first few steps of the patient journey there, but then in order to complete the OCT, the room had to be left. Without sightlines, a technician might have to leave the patient, walk around the corner twice and might find both OCTs occupied, in which case the patient would be led back to the waiting area. If an OCT becomes available a minute later, the technician might not immediately notice because they would have already started a new patient on their journey, again in a different room.
In addition to the flow order, overall durations of diagnostic activities are relevant markers of effectiveness. Results of the direct observations are reported in Table 2 and Figure 5.
Table 2
Duration of diagnostic activity by station type (95% trimmed range) showing the minimum, mean, maximum and standard deviation (SD) (all min) for Cayton Street and the Hoxton Hub.
| CAYTON STREET | HOXTON HUB | t-TEST | |||||||
|---|---|---|---|---|---|---|---|---|---|
| MINIMUM | MEAN | MAXIMUM | SD | MINIMUM | MEAN | MAXIMUM | SD | p-VALUE | |
| Visual acuity (VA) | 1.4 | 3.6 | 7.1 | 1.5 | 2.6 | 6.4 | 14.6 | 2.6 | < 0.0001* |
| Focimeter/autorefractor (AF) | 0.3 | 0.8 | 1.6 | 0.4 | 0.9 | 1.9 | 5.2 | 1.0 | n.a. |
| Ocular response analyser (ORA) | 1.0 | 2.8 | 6.0 | 1.4 | 0.7 | 2.5 | 6.2 | 1.4 | 0.184 |
| Humphrey field analyser (HFA) | 8.6 | 14.2 | 21.3 | 3.1 | 8.1 | 14.2 | 22.5 | 3.5 | 0.987 |
| Optical coherence tomography (OCT) | 3.3 | 8.1 | 18.9 | 3.4 | 3.0 | 6.1 | 14.9 | 2.8 | < 0.0001* |
[i] Note: The t-test p-values show significant differences between the two sites (see file S3 in the supplemental data online for a comparison of full and 95% trimmed ranges).
n.a. = Not available.

Figure 5
Distribution of the duration of diagnostic activity (95% trimmed range) by station type in Cayton Street (a–e) and the Hoxton Hub (f–j) on the same scale axis.
As expected, the VA, focimeter, AF and ORA tests were quick with averages ranging from < 1 min (0.8 min for the focimeter) to 3.6 min for the VA in Cayton Street (Table 2), which suggests that technicians were working effectively. The VA at Hoxton took significantly longer (mean = 6.4 min) and was seen as less effective, which could be due to patients requiring additional information or less experienced technicians. The OCT and HFA were longer overall with averages of 8.1 and 14.2 min in Cayton Street and 6.1 and 14.2 min in Hoxton, respectively. The duration of the OCT in Cayton Street was significantly longer than that in Hoxton, which points to issues that are worth exploring further.
A visualisation of each patient’s diagnostic activities as stacked and coloured bar charts showing time on the y-axis (Figure 6) illustrates when each patient started with their first activity, the order they went through the diagnostics, the time they spent at each station as well as waiting times in between (shown as gaps).
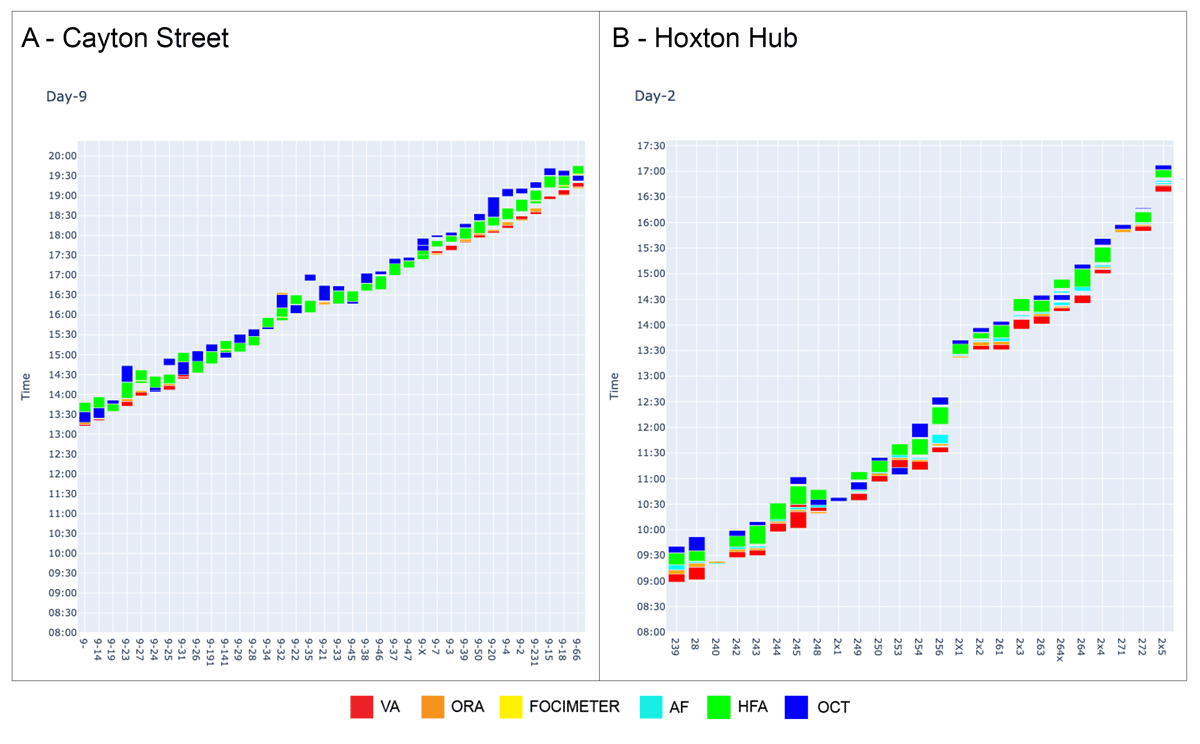
Figure 6
Bar charts of patient flows for selected days in (a) Cayton Street and (b) the Hoxton Hub.
Note: Patient ID is shown on the x-axis; time of day on the y-axis. Each column represents a single patient for a selected day of observations with activities coloured according to the stations.
Cayton Street experienced some bottlenecks and associated waiting times to access HFAs and OCTs (Figure 6a). In contrast, waiting times at Hoxton were less of an issue. This may seem odd, given that the longest diagnostic activity, the HFA, only had three stations provided in Hoxton (compared with five in Cayton Street), but is explained by the overall lower patient load at Hoxton. At its busiest times, seven patients were observed in parallel at Cayton Street (average = 4.3), calculated for rolling 15-min intervals, while only a maximum of four patients (average = 3.8) were present at Hoxton. This means the lanes were never tested to their full capacity. The fact that only two OCTs were provided at Cayton Street (rather than three at Hoxton) also inhibited smooth clinic operation.
As Cayton Street became busy, adaptive behaviours and changing clinical practices were observed (Figure 7a). The stacked charts by patient (Figure 6) are now coloured by technicians, illustrating that technicians handed over patients to other technicians in Cayton Street during busy times to cope with the load rather than staying with their patients from beginning to end, as evident in Hoxton (Figure 7b) and the quieter times at Cayton Street.
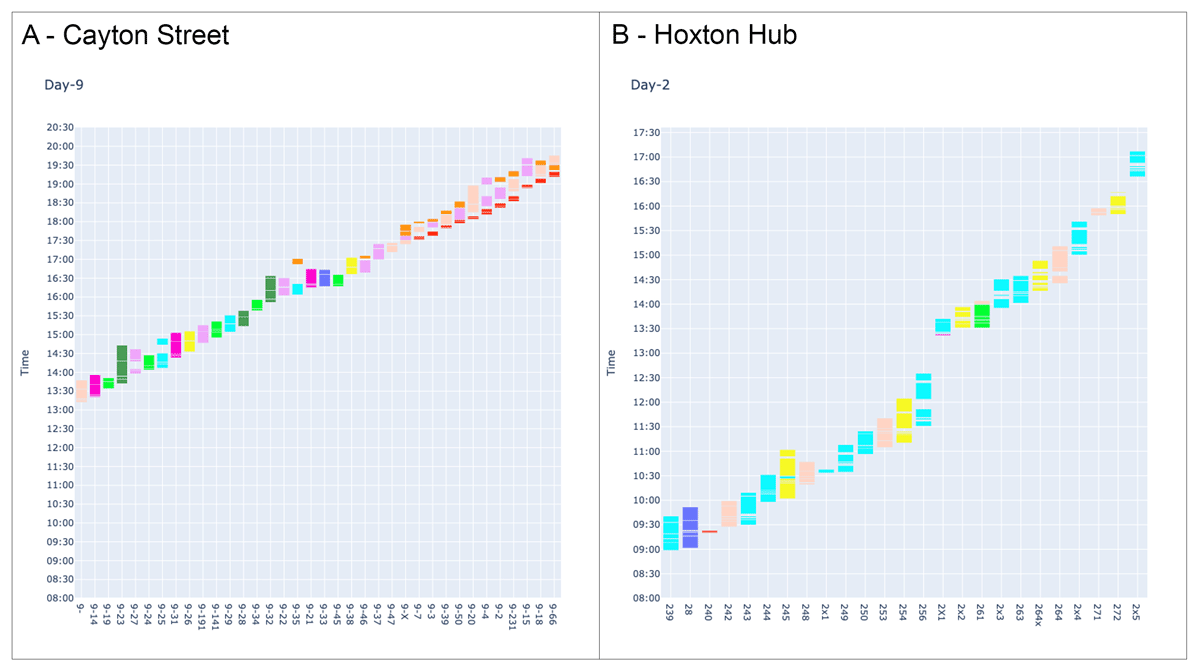
Figure 7
Bar charts of patient flows in (a) Cayton Street and (b) the Hoxton Hub.
Note: Patient ID is shown on the x-axis; time of day on the y-axis. Each column represents a single patient for a selected day of observations with activities coloured according to the technician serving a patient.
Fewer patients in parallel at Hoxton resulted in less turbulence, a more consistent order of examinations and fewer delays for patients, yet a lower throughput of patients overall compared with Cayton Street.
Differences in flow were unlikely due to patient characteristics, with these broadly comparable at the two clinics. A total of 96% in Cayton Street were fluent in English versus 86% of patients at the Hoxton Hub. The ratio of male-to-female patients was 1.3:1 across both clinics. The average age of patients in Cayton Street was 63 years (range = 25–89 years) while at the Hoxton Hub the average age was 65 years (range = 41–95 years).
Due to the unequal patient loads across Hoxton and Cayton Street and other variable factors outside of the control of the study (such as technician experience), a systematic investigation of the waiting times accrued for different patient loads across different station configurations is needed to better compare the spatial clusters of Cayton Street with the lanes at Hoxton. This is provided in the following section.
4.2 Results from the queuing simulation: arranging stations differently
The simulation enabled influences of clinic workload intensity, resource allocation across activities and ostensive process design on performance to be isolated from the effects of spatial layout, sightlines and clinic-to-clinic differences in case-mix and equipment.
Diagrams of the four ostensive process designs that were simulated are shown in Figure 8. All four impose the same order of activities. They differ by whether stations are organised in lanes with patients staying in the lane they join (ostensive processes 1 and 2), by if activities are grouped such that a new patient only starts the first activity in a group once the previous patient has completed the final activity (ostensive process 1) and by the use of optimisation to determine the number of stations devoted to each activity (ostensive process 4). Ostensive process 1 reflects a proposed workflow at Hoxton (not observed in the data collection), whereby technicians would take a patient through the first three activities and then hand them over to another technician for the final two.
The diagrams in Figure 8 were annotated with the average queue sizes obtained from the set of simulation experiments with 60 patients arriving in batches of three every 10 min. Figure 9 shows the simulated clinic duration for each ostensive process for a range of workload intensities.
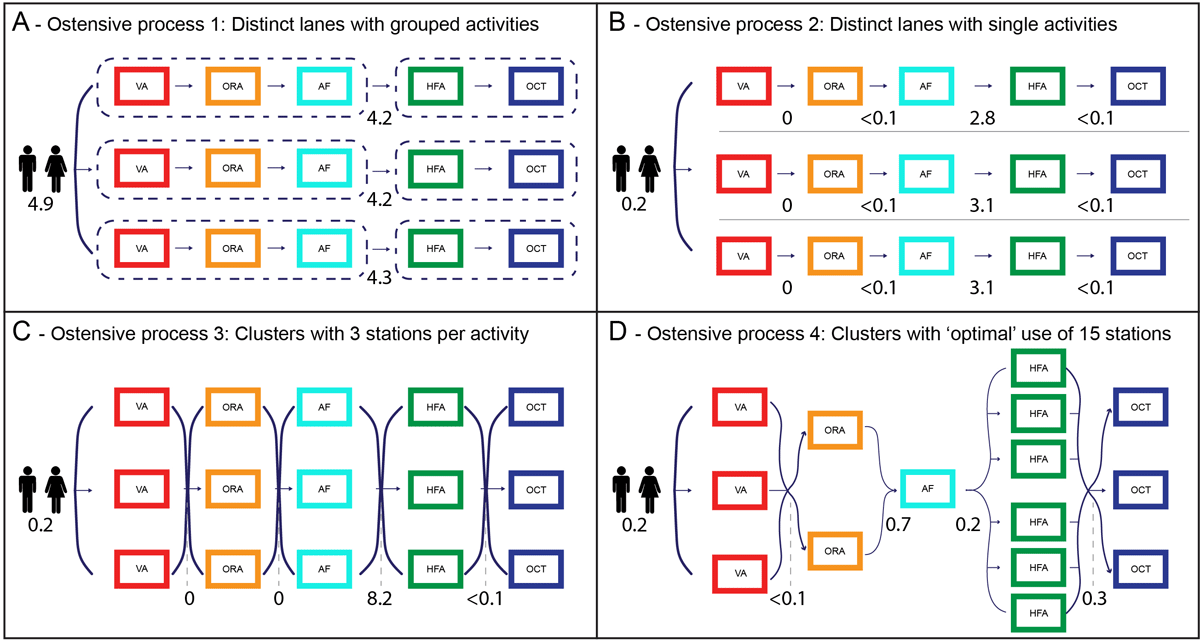
Figure 8
(a–d) The four ostensive process flows considered in the queuing simulations.
Note: Numbers denote average queue sizes in simulation experiments with 60 patients arriving in batches of three every 10 min.
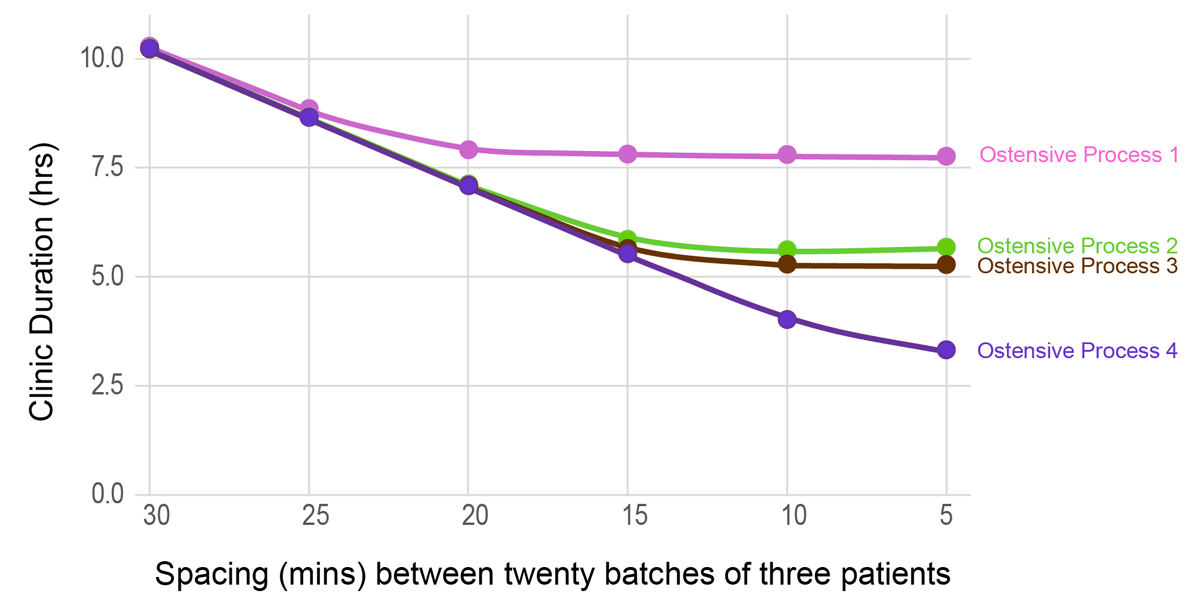
Figure 9
Plot of overall clinic duration for the four ostensive processes for different appointment spacing times.
At low workload intensities, overall clinic duration differs little across ostensive processes. At higher intensities (patients arriving at shorter intervals) differences in efficiency emerge, with the shortest clinic duration achieved using the clusters of stations obtained through optimisation. Ostensive process 3 (clusters of three stations devoted to each activity) is marginally more efficient than process 2 (three stations per activity, but divided into lanes), but with performance constrained by a bottleneck at HFA. Ostensive process 1 is (inevitably) the least efficient, with stations kept idle while a patient completes the group.
5. Discussion
Reflecting on the results, four distinct themes warrant further discussion: bringing spatial and operational perspectives together; the importance of sightlines; ideal set-ups in clusters or lanes; and ostensive routines and performativity.
5.1 Bringing spatial and operational perspectives together
The approach presented follows calls from the literature (Halawa et al. 2020; Jia et al. 2023) to bring spatial and operational perspectives together to understand more holistically the decisions taken in clinical practice.
Building on the extant literature using both approaches consecutively (Morgareidge et al. 2014), the analyses were integrated one step further by using data that considered an outcome in the space syntax paradigm, i.e. the diagnostic activity times, as input to the operational model. Using detailed usage patterns of real-life cases adds accuracy to models of everyday practices not afforded by assuming idealised activity times.
From a clinic design perspective, both disciplines offer insights into how clinics could be run more effectively, and by considering spatial and operational results alongside each other, more nuance is afforded. The data on diagnostic activity times added insight to discussions within the clinical teams at Moorfields by highlighting how the services actually performed, thus contributing to evidence-based practices in general (Halawa et al. 2020; Mahmood 2021; Criado-Perez et al. 2020) and to evidence-based practice at Moorfields (Kotecha et al. 2015a, 2015b). Insights will likely apply to different clinical specialities and to other countries.
5.2 The importance of sightlines
In addition to the well-documented effect of spatial propinquity affecting social behaviours (Small & Adler 2019), visibility as the underlying spatial property expressing human perception is a fundamental aspect of how humans navigate the world (Gath-Morad et al. 2021, 2024). The ability to see what is going on in a healthcare setting has been clearly established as relevant in the literature, supporting not only nurse communication and coordination (Zook et al. 2024) but also processes of care (Pachilova & Sailer 2022; Ossmann 2022).
The analysis built on these literatures and showed that patient flows were eased by sightlines in those places where it was provided and hampered by its lack, particularly when stations were placed around several corners and therefore not easily accessible to coordinating technicians.
Visibility and open-plan layouts in particular can have negative effects, too, e.g. on perceptions of privacy, as evident from a large body of work on workplace environments (Sailer et al. 2021; Kim & de Dear 2013), so a balance is required. Given the small-scale nature of the clinics and the unobtrusive nature of ophthalmic diagnostic activities, privacy concerns can perhaps be considered secondary.
A key consideration here is that a combination of privacy and sightlines is possible in ophthalmology, e.g. by using shoulder-height partitions, and some materials engineering to manage sound.
5.3 The ideal set-ups in clusters or lanes
In considering the detailed spatial arrangements of the interior layout of ophthalmology clinics, this paper goes further than the extant literature which focuses on more large-scale configurational choices such as the study of centralised versus decentralised services (Schaumann et al. 2019; Salonen et al. 2013; Hua et al. 2012).
Lanes seem an obvious choice at first sight as they provide a clearly ordered patient flow, translating an ostensive routine most clearly into a spatial layout and therefore helping both patients in orientation and technicians in coordinating flows. By virtue of their layout, lanes provide an obvious solution to the problem of sightlines, at least partially, since only one station of each type is visible within the confines of the lane.
However, beyond the consideration of sightlines, a key restriction of using lanes is that one has markedly less flexibility in the number of stations allocated to each activity. The improvement offered by ostensive process 4 over the other process designs considered in the queuing simulations comes directly from exploiting the flexibility available when moving away from lanes.
While clusters are operationally more effective than lanes, their detailed spatial arrangement is a crucial consideration. Splitting services across multiple rooms creates issues as sightlines are broken. Ideally, all activities would be offered in a single room with intervisibility between all stations; however, this puts pressure on hospital real estate as traditionally smaller exam rooms are the prevalent configuration and finding a single space that comfortably fits, say, 15 stations with perfect intervisibility between all stations might be constrained by the reality of the spaces on offer.
5.4 Ostensive routines and performativity
The observed variability in the order in which patients undergo diagnostic activities prompts interesting reflections on the difference between real-life cases and abstract conceptualisations of care processes.
In practice, clinical teams usually rely on their intuition and experiences of how to arrange outpatient clinics, not least because evidence-based design insights often focus on inpatient experiences in hospital wards (Ulrich et al. 2008; Elf et al. 2024). On the ground, processes of patient flow are therefore typically expressed and understood in their idealised form as an ostensive routine, which then gets designed into the process flows, the management practices of clinics and the spatial layout. The work of organisation science scholars, however, has highlighted that ostensive routines are only a starting point, and that variability and change is the norm in many organisations (Feldman & Pentland 2003), thus leading to the insight that performative routines and dynamics are equally important to consider in healthcare contexts (Pentland et al. 2020; Sailer 2024).
This paper contributes to this discourse by showing that the ostensive order of the diagnostic process is varied in practice, following spontaneous decisions by technicians on-site, and often resulting in improved effectiveness, e.g. through better communication or reduced waiting times.
6. Conclusions
This paper compared two ophthalmology diagnostic and monitoring clinics operated by Moorfields Eye Hospital to understand how their spatial structures and operational set-ups supported the flow and throughput of patients. It was found that the two sites differed significantly in their spatial configuration (lanes versus clusters) but also in sightlines between relevant stations in the patient journey (direct visibility versus looking around several corners); that diagnostic activity durations differed for some activities: visual acuity (VA) was longer in Hoxton, yet optical coherence tomography (OCT) longer in Cayton Street; that the presence of more patients in parallel caused waiting times (mainly in Cayton Street) but also a shift in practices with more patient handovers from one technician to another; that the lane structure resulted in fewer deviations from the ostensive routine; and that a different allocation with clusters of stations by type would result in process efficiencies (shorter clinic hours for the same number of patients, hence higher throughput).
Limitations were, first, that isolating spatial design as a variable is always difficult under real-life circumstances. The comparison between the two sites allowed for a study of different spatial configurations, but due to the practicalities of how the clinics were operated, certain biases could not be ruled out. For instance, Hoxton was newer and run by newly recruited staff with less experience. In addition, a rather quiet period for Hoxton was observed, so how the lane system would have fared under a heavier patient load remains unclear. The queuing simulations made up for this limitation to some degree.
Second, being able to study different spatial micro-configurations of diagnostic activities within the same spatial envelope, and thus to intervene in the spatial design more directly while monitoring the impact on patient throughput as well as patient and technician experiences, would be a fruitful endeavour. Additionally, further studies with a similar method in different polyclinics and countries would be interesting.
Third, more details on the nature of waiting would have been valuable through both extended qualitative notes and more systematic observations of exam durations. The process of sitting or rising from a seat was interpreted as signifying the start or end of the diagnostic activity, but in the observations, patients sometimes remained seated after the end of the actual exam, as the next station in the ostensive process was unavailable. This might explain the longer activity duration for the OCT in Cayton Street, which was affected by changes in order between HFA and OCT and emerging waiting times when the clinic was busy. Therefore, distinguishing between occupying a seat and actual exam durations in the observation protocol would be useful in future research, as would the use of sensors or a comparison with machine time stamps. It is worth noting that the queuing simulations were based on observations from the uncongested Hoxton Hub and so would be largely unaffected by this effect.
Finally, the microsimulation and analytical optimisation could be made more comprehensive. While the description of clinic operation derived from the observations included how technicians staffing the clinics manage the work, the microsimulation and analytical optimisation do not evaluate ostensive process designs in terms of staff utilisation and, with the focus very much on the allocations of stations to activities and division of stations into lanes, do not incorporate staffing constraints. This incomplete picture gives a particularly harsh assessment of ostensive process 1, the only argument for which is based on staffing. In addition, the modelling assumes a strict ostensive order; however, in practice more or less performativity of routines is the reality. This might call for more complex simulation models.
To conclude, this paper constitutes an important step towards an evidence-based practice of designing and organising ophthalmology outpatient diagnostic and monitoring clinics in a way that enables a fast and efficient triaging of patients in order to decrease the backlog in NHS appointments in the UK, based on insights from architectural scholars and operation research.
Data accessibility
A data repository related to this paper is available at https://doi.org/10.5061/dryad.m0cfxppdj
Supplemental data
Supplemental data for this article can be accessed at: https://doi.org/10.5334/bc.545.s1
Acknowledgements
The authors thank the Moorfields Eye Hospital NHS Trust for allowing access to its buildings and letting the authors observe their diagnostic activities, as well as for the generosity of all staff involved in making this study happen. The authors also thank Farbod Afshar Bakeshloo and Ecem Ergin for data collection on-site, alongside Xiaoming Li.
Competing interests
The authors have no competing interests to declare.
Author contributions
KS, MU, HJ and PJF conceptualised the project and led the investigation. Fieldwork was supervised by ATZF. MU, RP and XL wrote the code for the analysis. Data analysis was undertaken by KS, MU, RP, ATZF and XL. KS, RP and ATZF worked on visualisation of the figures. KS, MU and RP prepared the draft, while all authors reviewed and edited it.
Ethical approval
The study and its protocols (see file S1 in the supplemental data online) were classed as service evaluation and approved by the board of the Moorfields NHS Trust (reference number CA/GL/1609). A full risk assessment was undertaken and approved by the university. No personalised data were collected; all staff were informed in advance and gave oral consent. Patients were informed at reception of the presence of service evaluation observers.