
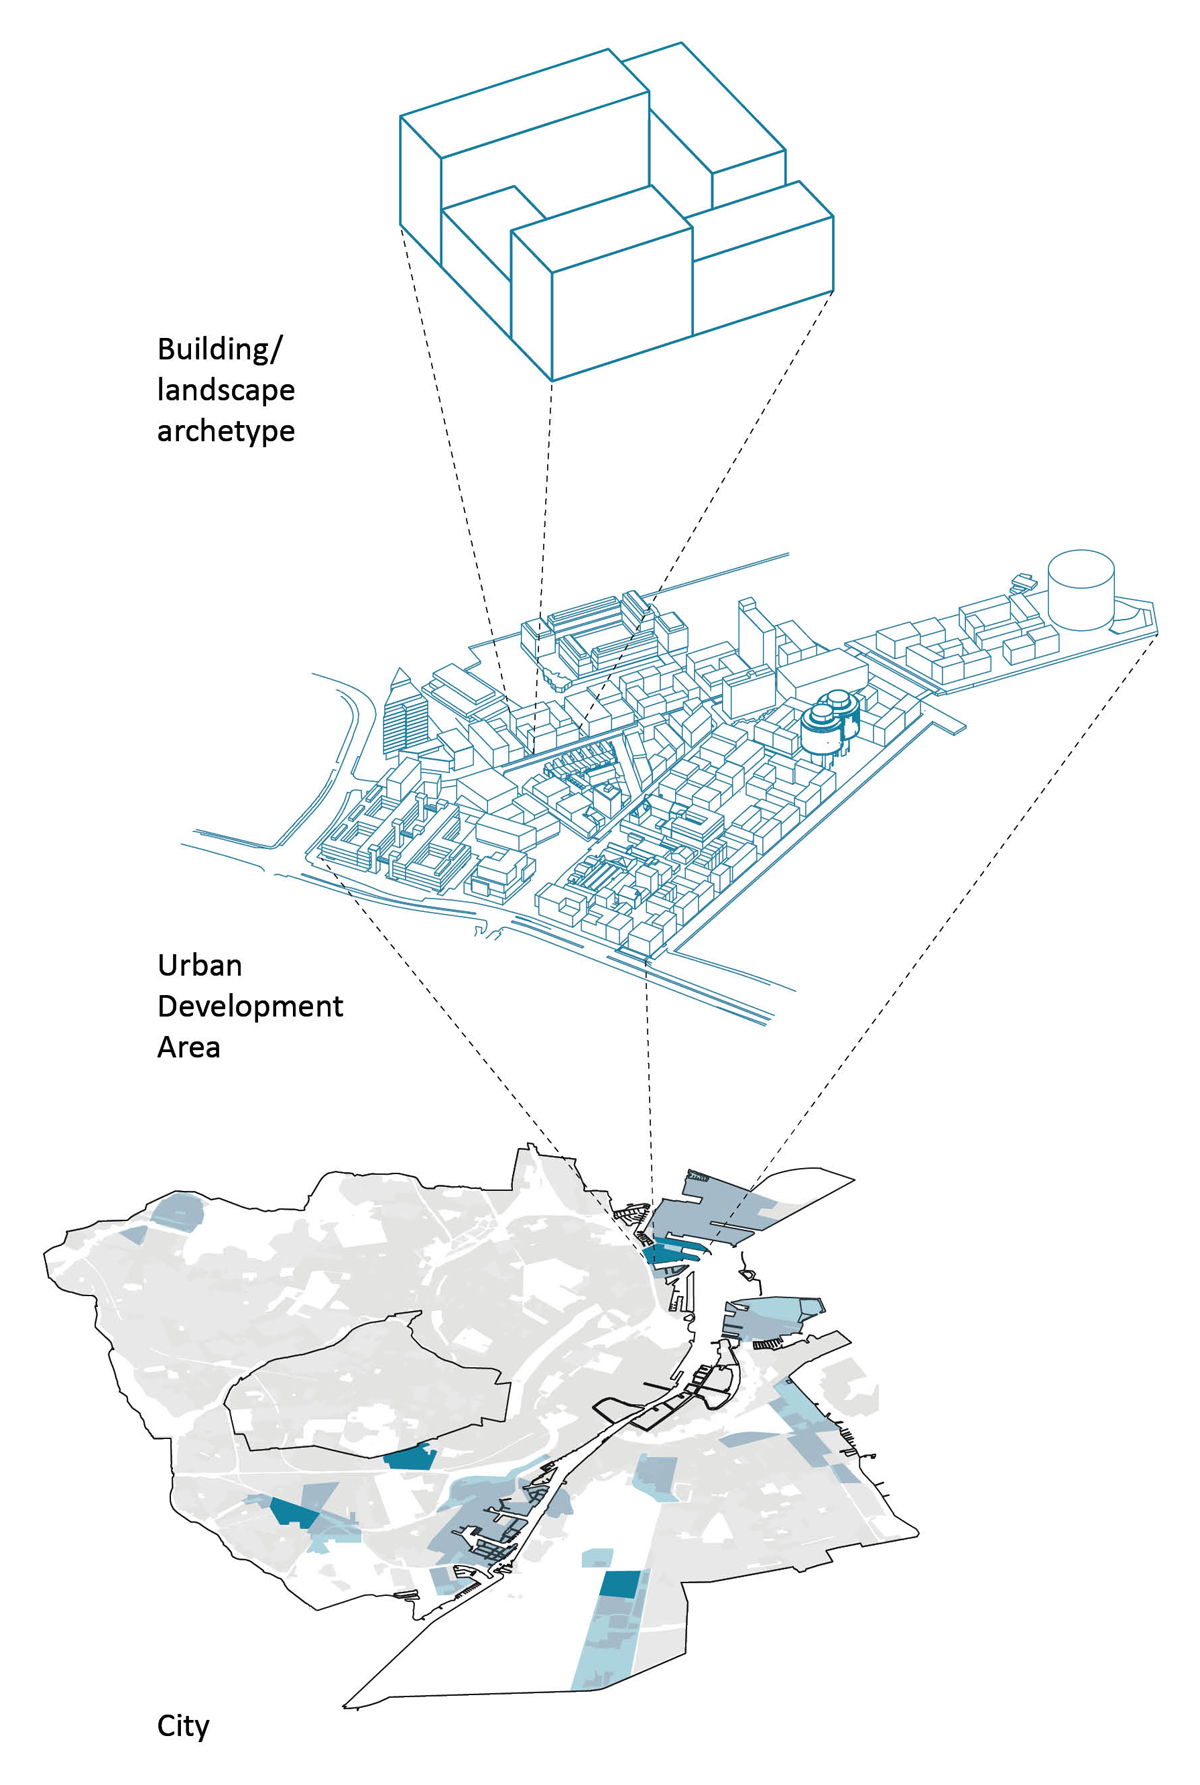
Figure 1
Three levels of analysis: the city or municipality situates the case study neighbourhood in a geographical and urban development context, the analysed neighbourhood, and the individual building, landscape or infrastructure that informs the analysis.
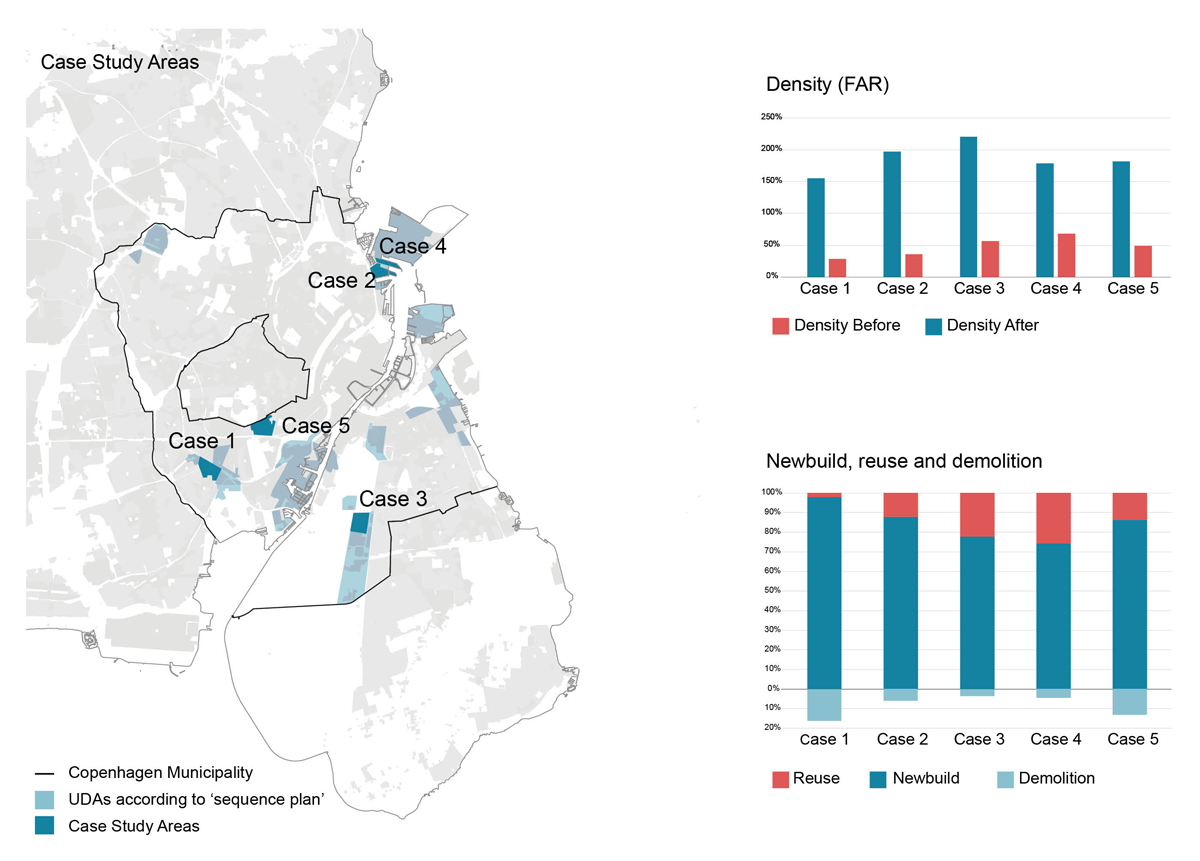
Figure 2
(left) Zones designated for urban development areas (UDAs) according to the sequence plan in the Municipal Plan (Københavns Kommuneplan 2019). The studied Århusgade neighbourhood is case 2. (upper right) Density before and after development in the studied UDAs, as floor area ratio (FAR). (lower right) Demolition, reuse and newbuild in the studied UDAs, as a percentage of the total built area.
Sources: See Document S1 in the supplemental data online.
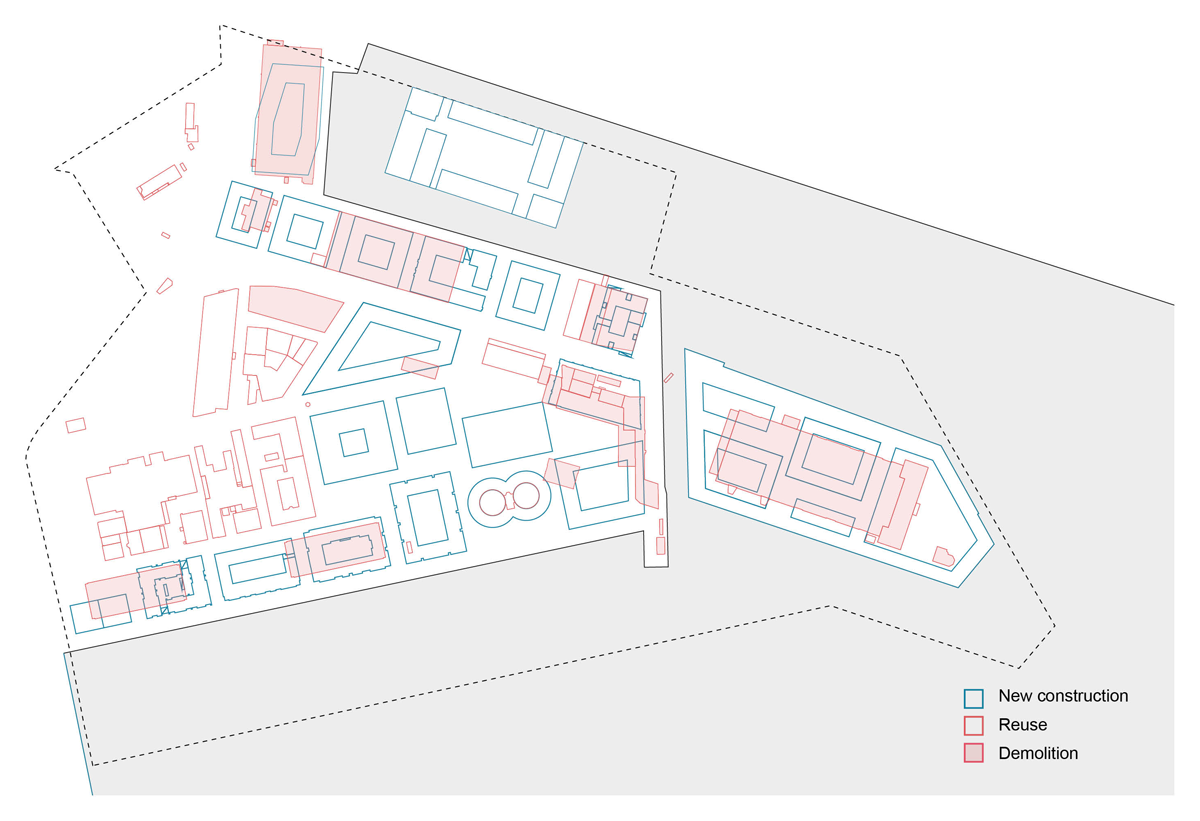
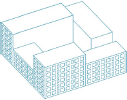
Figure 3
New, reused and demolished buildings in the case neighbourhood.
Source: City of Copenhagen and architecture offices.
Table 1
Source data.
| INFORMATION | DATA | SOURCE | |
|---|---|---|---|
| General | Local plan boundary (functional unit—FU) | Local plan | Copenhagen Municipality |
| Master plan geometry for buildings, landscape and infrastructure | Master plan drawing files | Architect companies responsible for urban planning | |
| Buildings | Building functions | Local plan | Copenhagen Municipality |
| Building areas (m2) | Plot data (BBR-Meddelelse) | Building register (BBR) | |
| Reuse of buildings | Before and after pictures | Architect companies responsible for urban planning | |
| Building properties | Drawings of select buildings | Various architect companies | |
| Landscape and infrastructure | Landscape and infrastructure section (build-up) | Infrastructure project | Engineering companies |
| Reuse of landscape and infrastructure materials | Before and after pictures | Engineering companies |
[i] Note: BBR = Building and Housing Register.
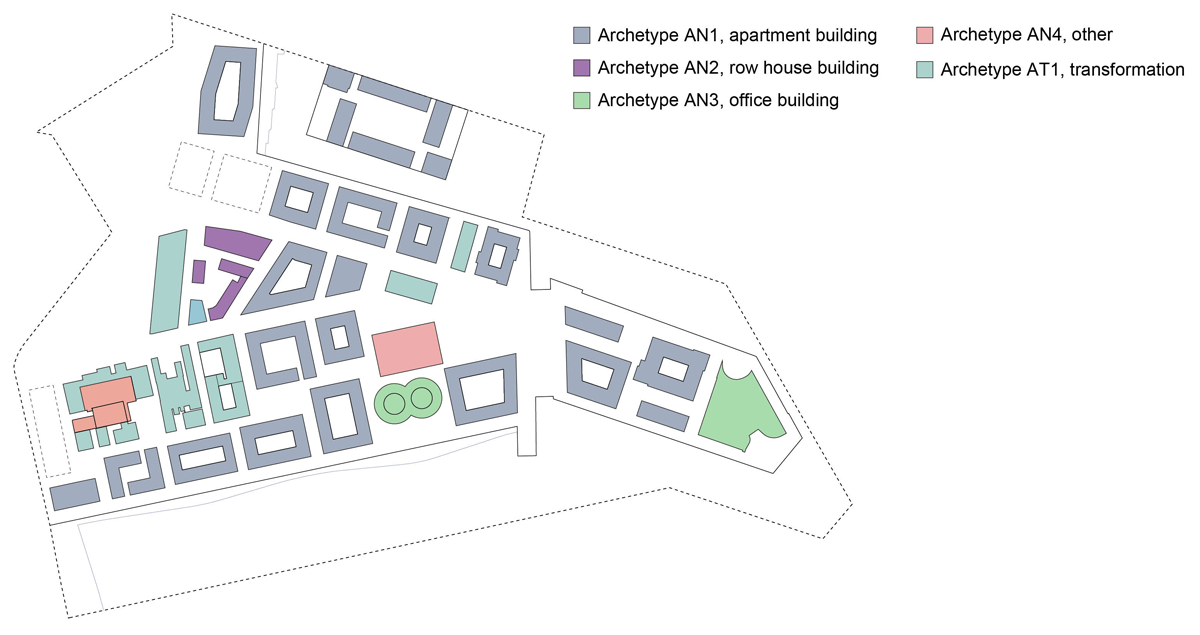
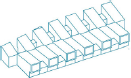
Figure 4
Map showing the building archetypes.
Table 2
Building archetypes.
| BUILDING ARCHETYPE | GROSS FLOOR AREA (M2) | FLOORS | SOURCE FOR LCA DATA | REFERENCE CASES | |
|---|---|---|---|---|---|
 | Archetype AN1: Apartment building | 191,051 | 4–6 | Tozan et al. (2023) | 42 |
 | Archetype AN2: Row house building | 4,190 | 2–3 | Tozan et al. (2023) | 22 |
 | Archetype AN3: Office building | 52,861 | 12–15 | Tozan et al. (2023) | 35 |
 | Archetype AN4: Other | 8,474 | 2–4 | Tozan et al. (2023) | 8 |
 | Archetype AT1: Reused buildings | 35,210 | 2–16 | Lund et al. (2022) | 4 |
[i] Note: LCA = life-cycle assessment.
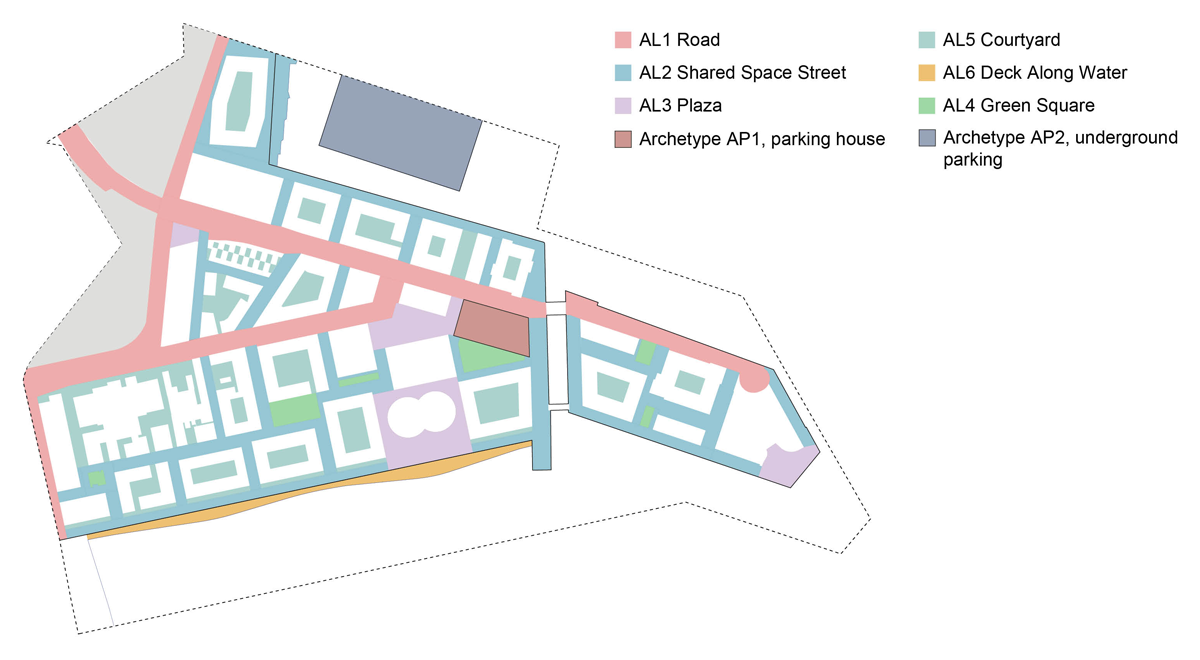
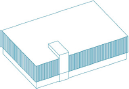
Figure 5
Map showing the landscape and infrastructure archetypes.
Table 3
Infrastructure and landscape archetypes.
| INFRASTRUCTURE AND LANDSCAPE ARCHETYPE | CASE STUDY AREAS | OUTDOOR BUILT AREA (M2) | |
|---|---|---|---|
 | Archetype AL1: Road | 3 | 25,660 |
 | Archetype AL2: Shared space street | 6 | 33,701 |
 | Archetype AL3: Plaza | 6 | 10,955 |
 | Archetype AL 4: Green square | 3 | 3,137 |
 | Archetype AL5: Courtyard | 3 | 22,310 |
 | Archetype AL6: Deck along water | Material quantities derived from building projects sourced from architects | 3,100 |
| SOURCE FOR LCA DATA | GROSS FLOOR AREA (m2) | ||
 | Archetype AP1: Car parking facility | LCA carried out specifically for this study using LCAByg | 17,394 |
 | Archetype AP2: Underground parking | LCA carried out by developer and engineer | 30,000 |
[i] Note: LCA = life-cycle assessment.
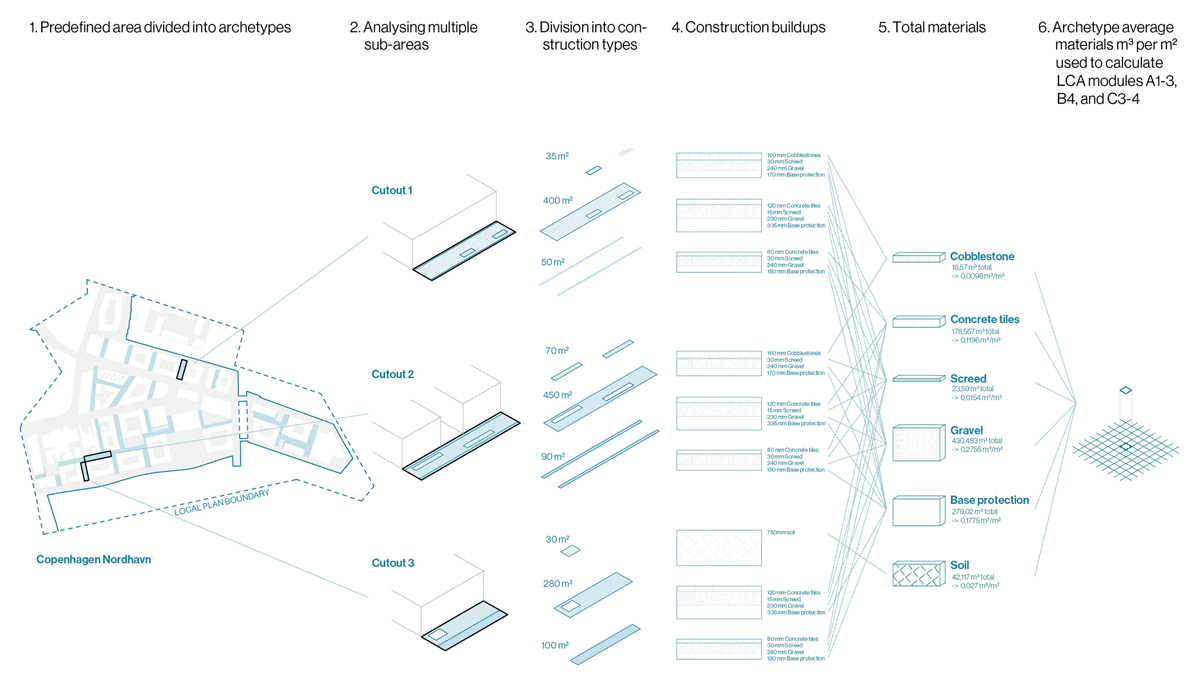
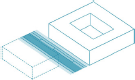
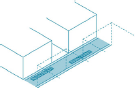
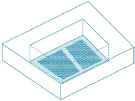
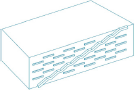
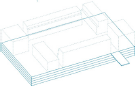
Figure 6
Method used to derive material quantities for the archetypes.
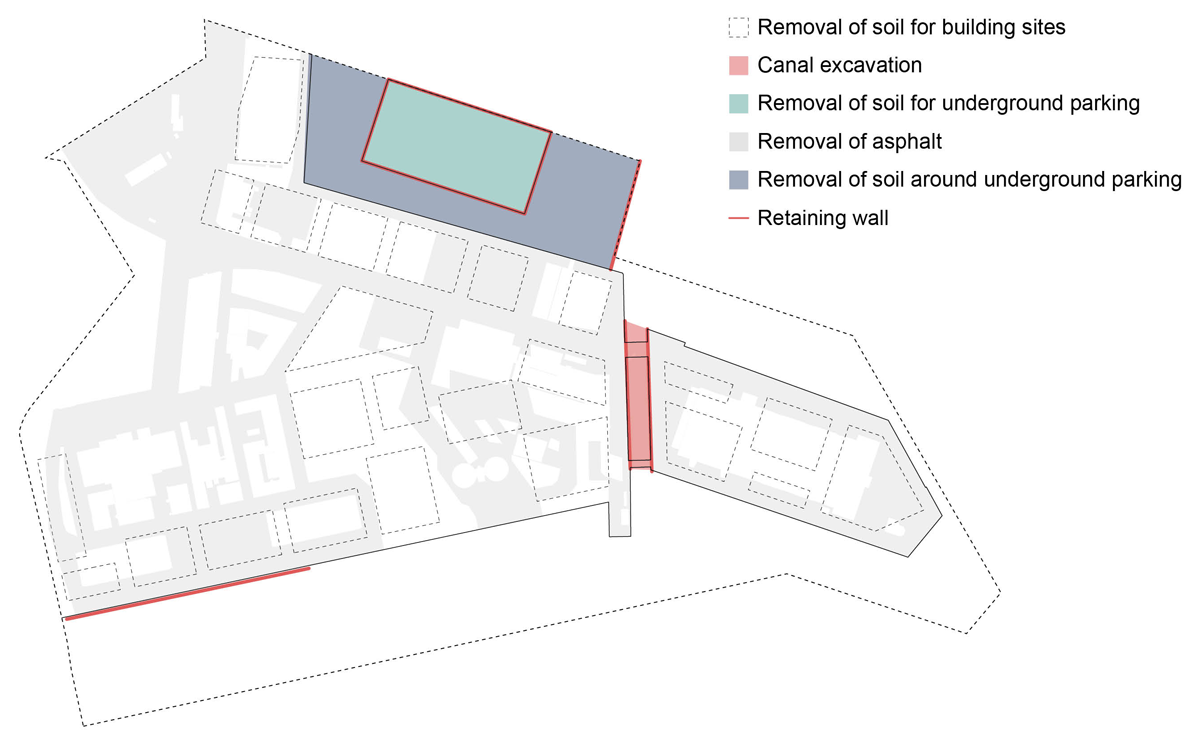
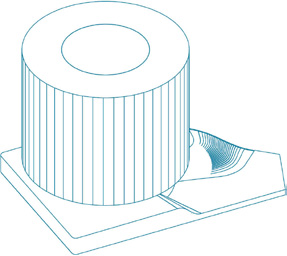
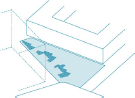
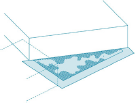
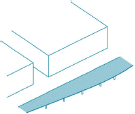
Figure 7
Major earthworks and their subcomponents.
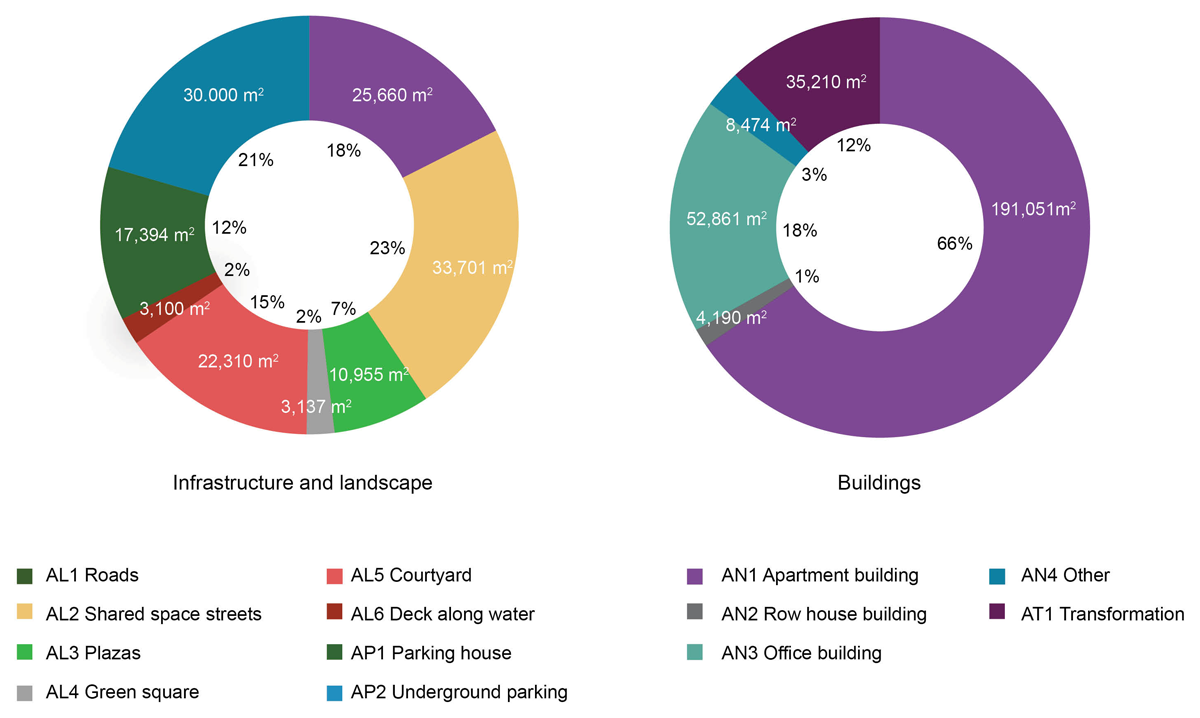
Figure 8
Built areas in the case neighbourhood.
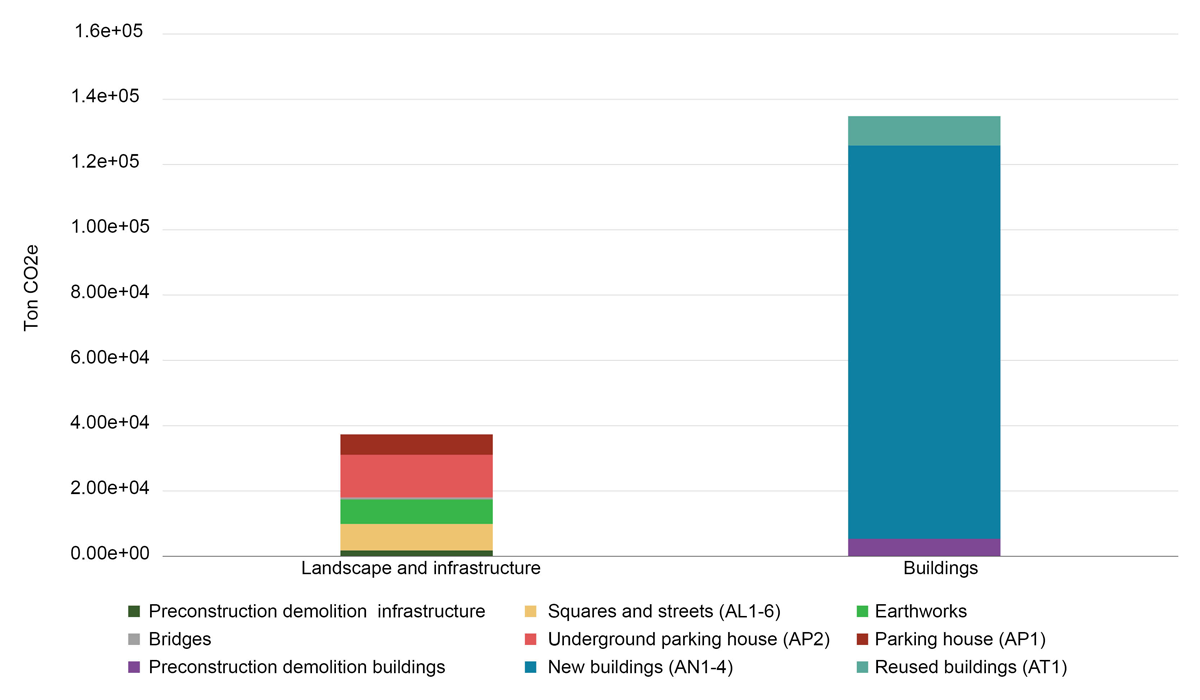
Figure 9
Total climate impacts in the case neighbourhood.
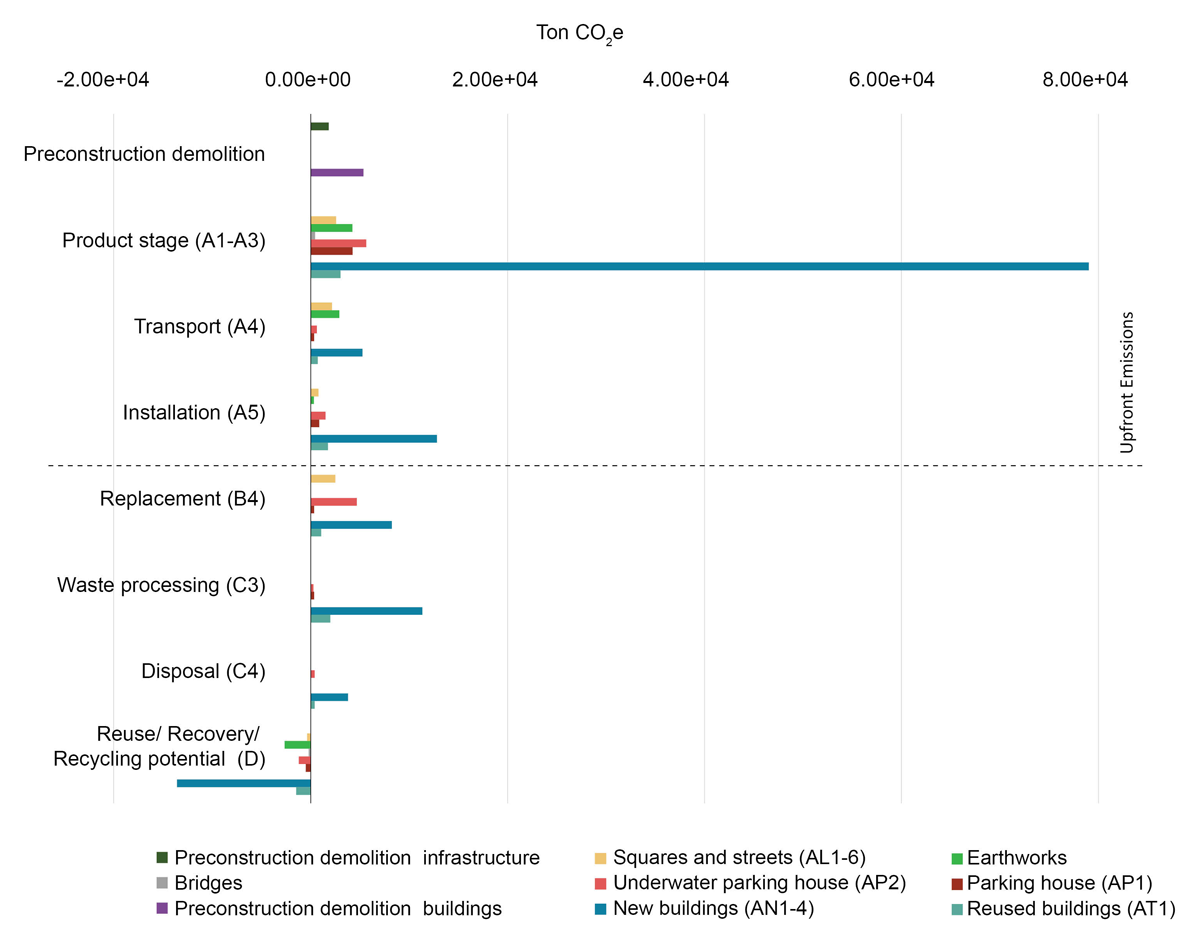
Figure 10
Global warming potential (GWP) total embodied climate impact.
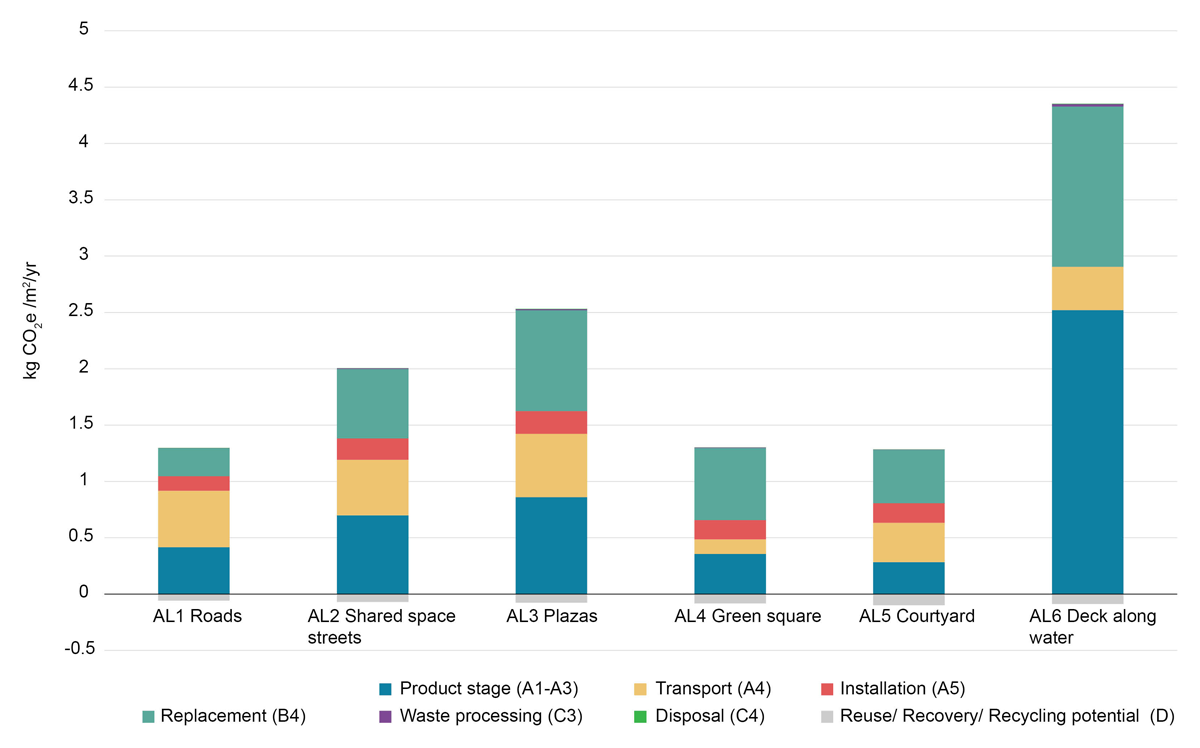
Figure 11
Global warming potential (GWP), average embodied climate impact in landscape and infrastructure archetypes (kg CO2e/m2/year).
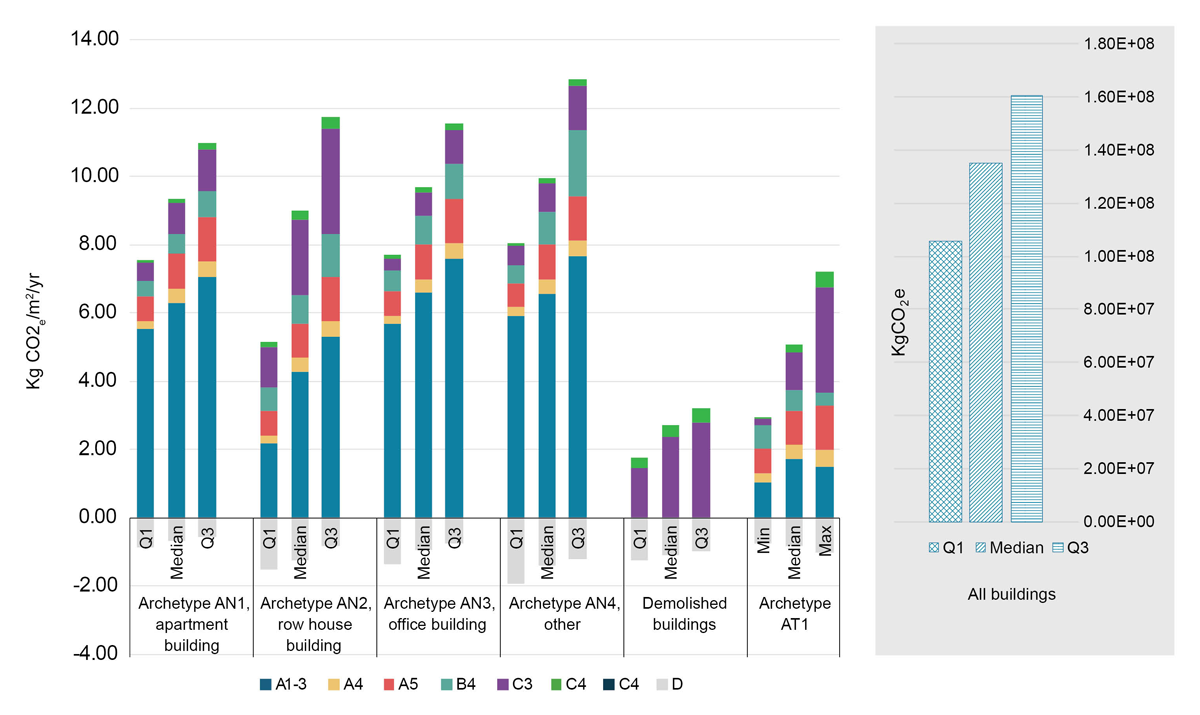
Figure 12
Sensitivity of the magnitude of buildings’ climate impact with respect to the range of impact per m2 from the chosen base studies.