
1. Introduction
Cities accommodate 55% of the global population and contribute 70% of global greenhouse gas (GHG) emissions (United Nations, DESA 2022). Cities often follow a linear pattern of material consumption, pulling resources from surrounding areas and beyond, using them within the city, and disposing of them outside it (Goldstein & Rasmussen 2018). Much of these flows are related to the built environment, which represents 37% of global GHG emissions (UNEP & Yale Center for Ecosystems + Architecture 2023) and 55% of resource consumption (UNEP 2024). The urgent need to reduce GHG emissions, along with the large and increasing share of embodied carbon (Blengini & Di Carlo 2010; Röck et al. 2020) in life-cycle environmental impacts, underscore the need to mitigate impacts related to construction and demolition to align with the Paris Agreement (United Nations 2015) and a return to a ‘safe operating space’ (Richardson et al. 2023; Rockström et al. 2009).
Urban planning strongly influences material flows by providing limits to permissible construction activities (Huuhka & Kolkwitz 2021; Lanau et al. 2019). In many cities, a large portion of urban construction occurs in urban development areas (UDAs), areas designated by the municipality to accommodate urban growth through densification and new construction. In cities such as Copenhagen, Denmark, recent urban development has often repurposed ‘brownfield sites’ for mixed-use or housing (Avermaete & Gosseye 2021; Baker et al. 2017). This type of urban development, linked to concepts such as the Compact City (Bibri et al. 2020; OECD 2012) and Land Recycling (European Commission, Directorate-General for Environment 2012; EEA 2019; Louwagie 2016), includes reuse and reconversion or demolition of previous buildings and infrastructure as well as new construction, and a mix of building typologies (Baker et al. 2017, 2021) This reuse and conversion of buildings and infrastructure in UDAs aligns with a growing interest in circular economy (Ellen MacArthur Foundation et al. 2015; EEA 2020; Munaro et al. 2020; Pomponi & Moncaster 2017). Circular economy strategies such as direct reuse show a high potential to reduce embodied emissions at the building level (Pomponi & Moncaster 2016; Ramboll 2021). Consequently, there is a growing interest and political initiatives aiming at changing patterns of demolition, construction and reuse in Denmark and Europe (European Commission 2021; von der Leyen 2020).
Similarly, there has been a ‘boom’ (Lanau et al. 2019) in studies aimed at quantifying building stocks and flows in cities, within conceptual frameworks such as urban metabolism and material flow analysis. Yet, existing studies point to considerable knowledge gaps (Kolkwitz et al. 2022) and untapped potentials (Lanau et al. 2019) concerning the drivers, dynamics, patterns, and interconnections that shape stocks and flows, limiting the ability to inform resource and environmental policy (Augiseau & Barles 2017). Notably, material flow analyses often focus on the city or wider scale. Spatially explicit results that could provide detailed insights for local decision-makers are often missing. Additionally, there is a lack of knowledge bridging urban planning practices and frameworks with building stocks and flows (Huuhka & Kolkwitz 2021; Lanau et al. 2019). Furthermore, few studies link these stocks and flows to their environmental impacts (Mastrucci et al. 2017).
Life-cycle assessment (LCA) is used to assess the environmental impacts for a given system from raw material acquisition, production of energy and materials, and usage to end-of-life processing (ISO 2022). It has long been used on buildings, but has seen an expansion to encompass city and district scales (Kayaçetin & Tanyer 2020). Reviews highlight the scarcity of existing urban LCA studies and their high heterogeneity in size (ranging from around 0.1 to over 1000 ha, type of area, functional unit (FU), method and scope) (Kayaçetin & Tanyer 2020; Lausselet et al. 2020; Lotteau et al. 2015). Most urban LCA studies focus on relatively new and homogeneous residential neighbourhoods (e.g. Kameni Nematchoua & Orosa 2023; Kayaçetin & Tanyer 2020; Lausselet et al. 2019; Yttersian et al. 2019). With few exceptions (Colombert et al. 2011; Peuportier et al. 2006; Peuportier & Roux 2013; Sigurðardóttir et al. 2023), there is a lack of studies on real mixed neighbourhoods with a variety of building typologies, and on urban transformation in UDAs, including reuse, newbuild and demolition (Riera Pérez & Rey 2013). The lack of contextualisation, considering the specific situation of a neighbourhood, is identified as a limitation of existing approaches for sustainability assessment at the neighbourhood scale, hampering the ability to provide decision-makers with useful analysis (Lotteau et al. 2015; Riera Pérez & Rey 2013). Specifically, no such studies consider a Danish context, despite a high interest from and some ongoing developments within policy and practice (Dansk Byplanlaboratorium 2024; Henning Larsen 2023; Schjørring Wied & Madsen 2023).
Recent years have seen an increased interest in how to immediately reduce climate impacts to meet the goals of the Paris Agreement, with particular attention paid to upfront and embodied carbon. This includes a growing interest in understanding the application of absolute environmental boundaries, defined by sharing principles, across various scales, from global to national levels (Bjørn et al. 2020; Häyhä et al. 2016; Vea et al. 2020), as well as within individual sectors or among individuals. However, this aspect has not been explored concerning urban planning, especially regarding UDAs.
The research addresses the following questions:
What embodied climate impacts are associated with the construction, maintenance and demolition of the analysed UDA?
Which components are hotspots of climate impact within the UDA?
What methodological framework can be used to conduct an LCA in heterogeneous UDA?
2. Method
The study focuses on the neighbourhood level of analysis, which serves as an intermediate scale between the broader city or municipality level and the more granular level of individual buildings, landscapes or infrastructure (Figure 1). These levels are closely interconnected and represent the distinct layers at which urban planning is implemented.
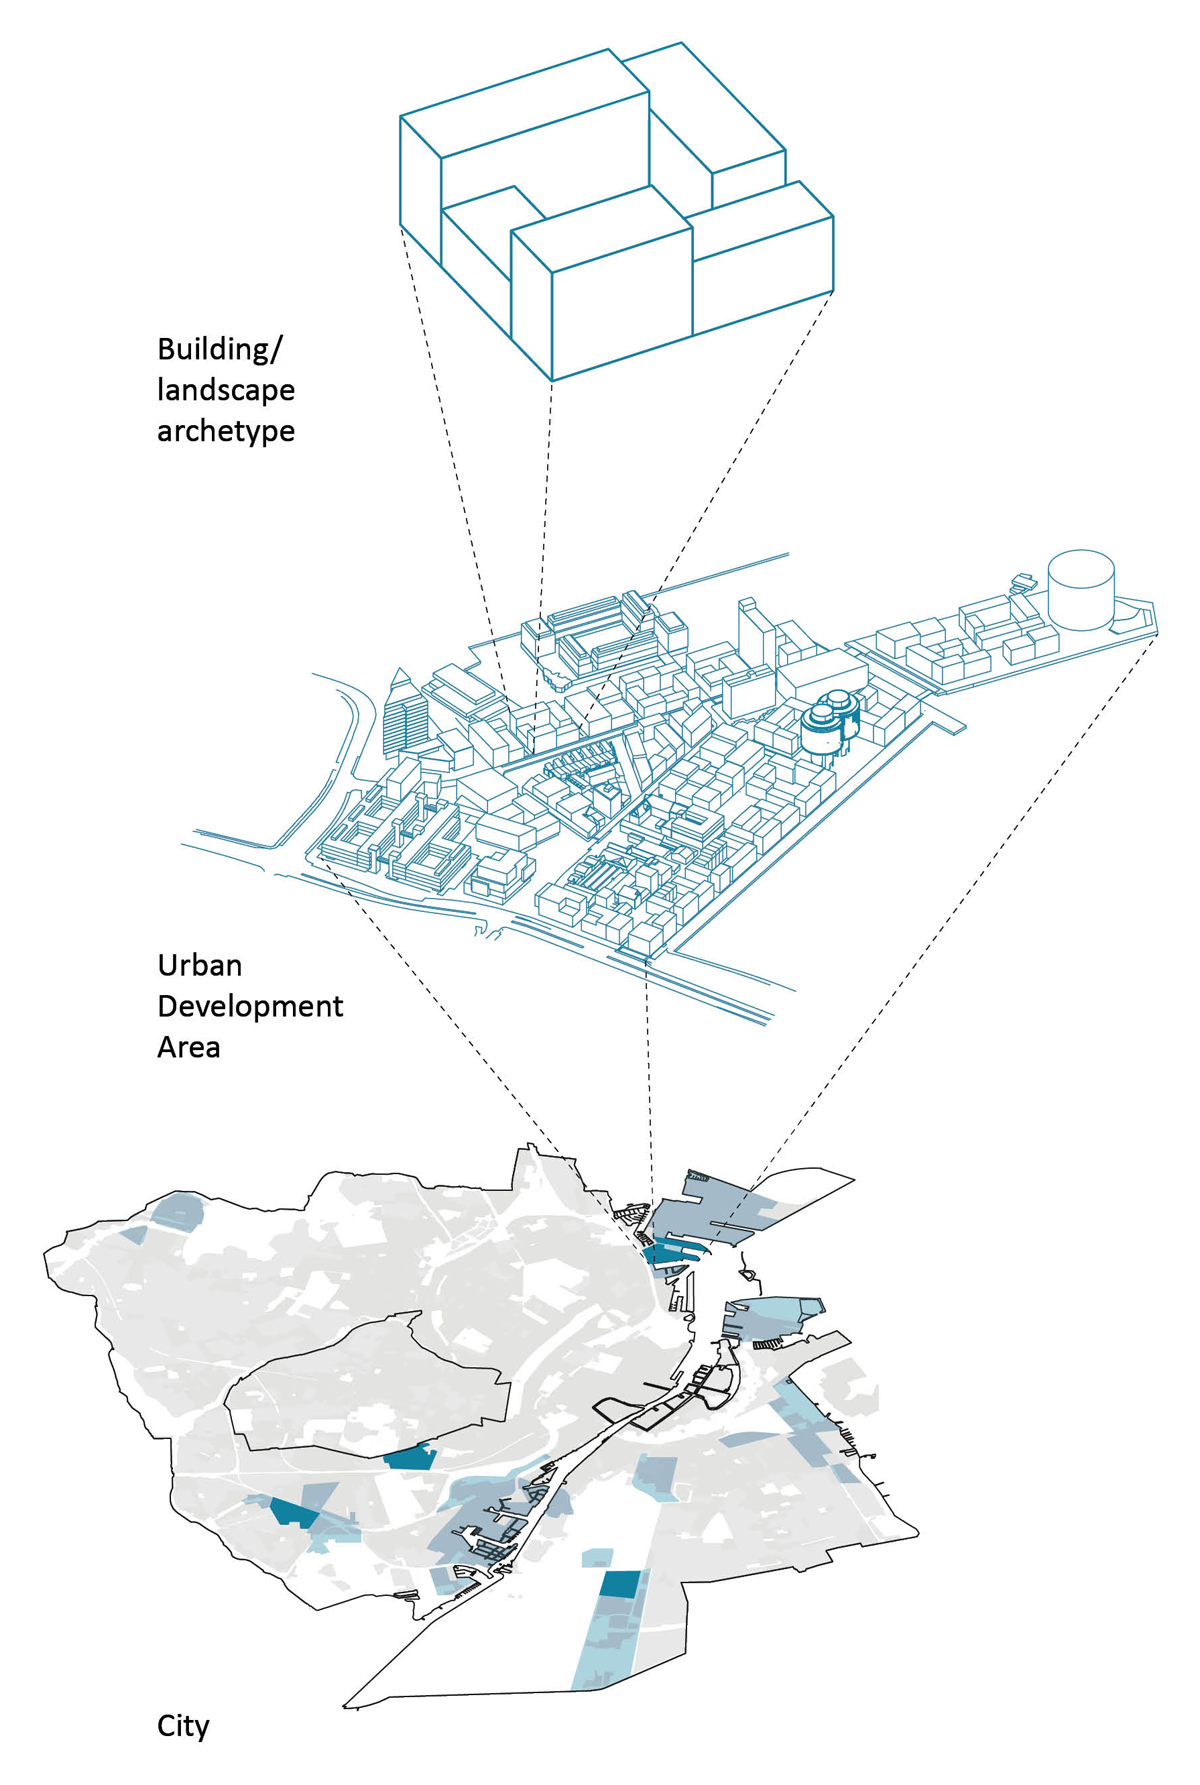
Figure 1
Three levels of analysis: the city or municipality situates the case study neighbourhood in a geographical and urban development context, the analysed neighbourhood, and the individual building, landscape or infrastructure that informs the analysis.
2.1 Selection of case study
To provide context for the study and to select a case study area somewhat representative of current urban development practices and results, a brief initial analysis of current urban development patterns in Copenhagen was conducted. The objective of this analysis was to gain a better understanding of the study’s results within a broader urban context.
In Copenhagen, as in other Danish cities, construction is guided by the ‘sequence plan’ (rækkefølgeplanen) within the municipal plan, updated every five years (City of Copenhagen 2019). This plan sequences urban development to coordinate with infrastructure, public transport and municipal investments in public services. The municipal plan designates UDAs, primarily former industrial zones (Københavns Kommuneplan 2019) (Figures 1 and 2). According to municipal calculations, 76% of construction under the sequence plan occurs within these areas, with the remainder in the surrounding urban fabric (City of Copenhagen 2019). These areas are generally developed in large parcels large parcels guided by local plans (City of Copenhagen 2019).
According to the Municipal Plan of 2019, 7.2 million m2 are planned to be built between 2019 and 2031, which is about 600,000 m2/year (Københavns Kommuneplan 2019), 456,000 m2/year (76%) of which are in UDAs.
The local plans in five of these areas were analysed with a focus on assessing change patterns and changes in density before and after redevelopment (for the underlying data, see Document S1 in the supplemental data online). The results are presented in Figure 2. These five areas were chosen from an initial screening of approximately 15 areas. The criteria for selecting the case study areas were that they should be recently constructed (within the last five years) and be > 10 ha.
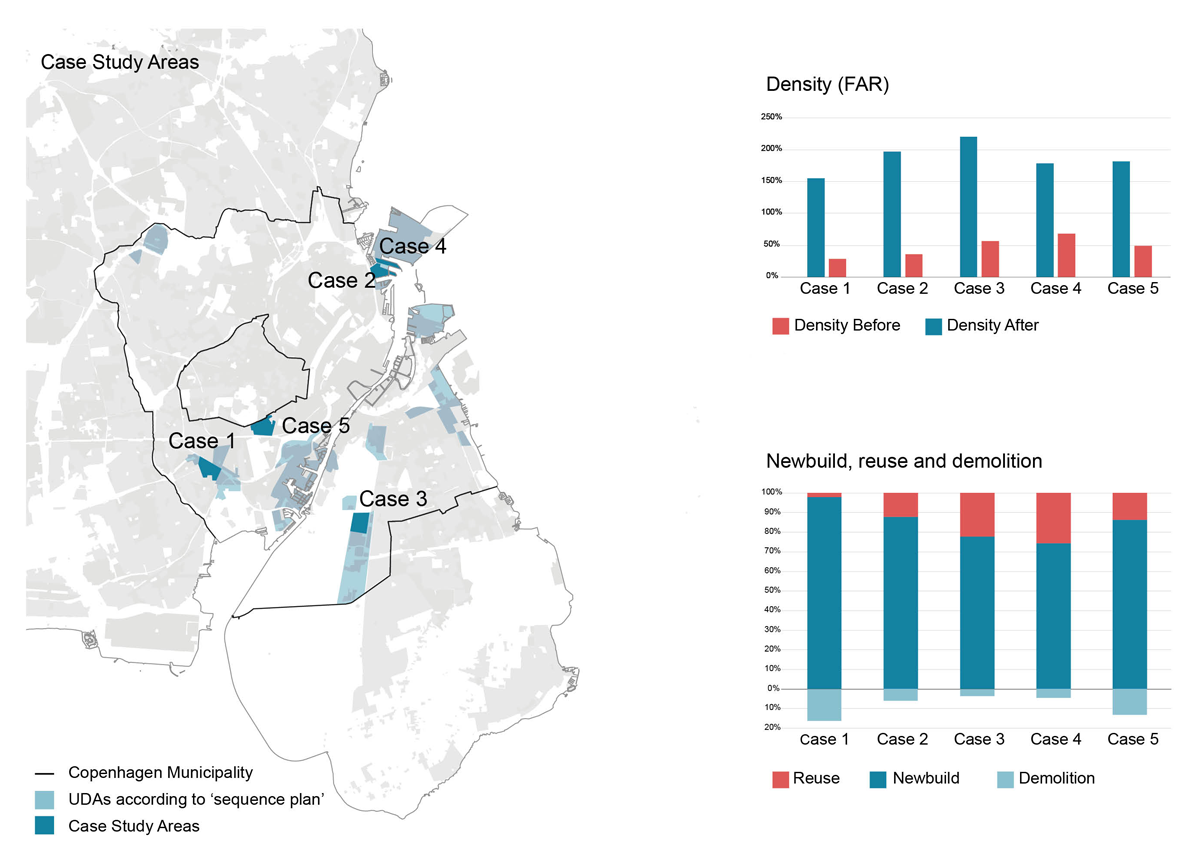
Figure 2
(left) Zones designated for urban development areas (UDAs) according to the sequence plan in the Municipal Plan (Københavns Kommuneplan 2019). The studied Århusgade neighbourhood is case 2. (upper right) Density before and after development in the studied UDAs, as floor area ratio (FAR). (lower right) Demolition, reuse and newbuild in the studied UDAs, as a percentage of the total built area.
Sources: See Document S1 in the supplemental data online.
The analysis revealed relatively consistent change patterns across the areas, with replacement rates (demolition relative to new build) ranging from 3% to 13%. Reuse relative to new build ranged from 8% to 33%, and the increase in density ranged from a floor area ratio (FAR) (the relationship between gross floor area and the land on which the buildings stand) of 37–66% before development to 150–220% after development.
Among these five representative UDAs in Copenhagen, the Århusgade neighbourhood (hereinafter ‘case neighbourhood’) was selected because it presents the best data availability. Additionally, its urban design is widely published (Keiding 2017) and has received several awards (City & Port 2024; City of Copenhagen 2024), so it can therefore be considered a ‘best practice’ or ‘white swan’ (Flyvbjerg 2006). Furthermore, the case neighbourhood is representative of the ratios seen in other Copenhagen UDAs, with an FAR of 197%, a replacement rate of 6% and a degree of reuse of 12%.
2.1.1 The case neighbourhood
The case neighbourhood is located in Nordhavn, a former industrial port north of Copenhagen city centre. By 2005, former harbour functions had moved out, and an agreement was made to develop the area. The case neighbourhood was the first part of Nordhavn to be developed. Owned by By & Havn, a public company overseeing Copenhagen’s publicly owned land development, the area underwent an ‘open international ideas competition’ (City & Port 2008) for both a ‘structural plan’ for the entire Nordhavn area and a ‘detailed plan’ for the case neighbourhood. After the competition, the winning teams collaborated with By & Havn and the City of Copenhagen to refine the detailed plan. In 2012, the first local plan for the area was approved, with amendments made in 2015, 2017 and 2018 (Århusgadekvarteret Lokalplan 2018).
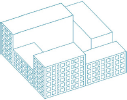
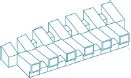
The case neighbourhood, prior to its development, was characterised primarily by industrial buildings of varying types, including concrete grain silos and low brick warehouses (Figure 3). During the transformation, approximately half of these buildings were preserved and reused, while the rest were demolished. Today, the neighbourhood features a dense urban structure, primarily consisting of perimeter blocks up to six stories high.
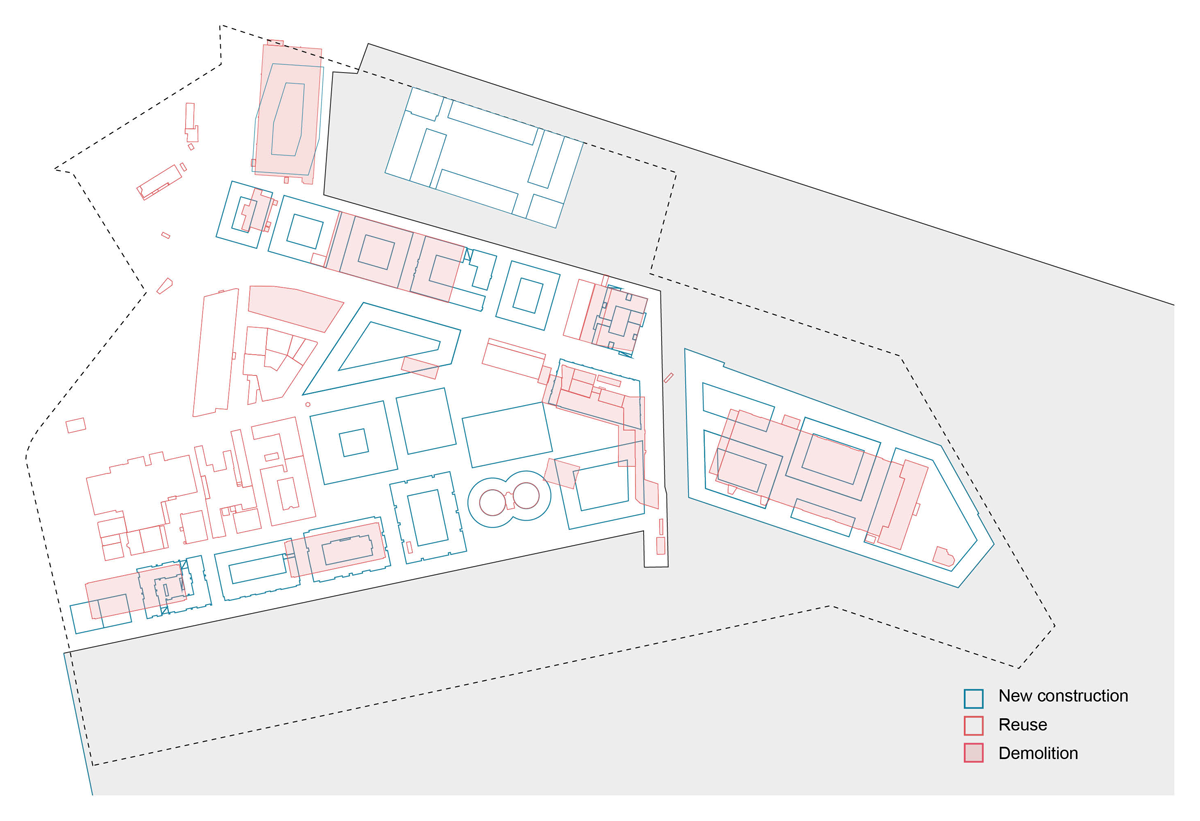
Figure 3
New, reused and demolished buildings in the case neighbourhood.
Source: City of Copenhagen and architecture offices.
2.2 Assets inventory and development of archetypes
The analysis adopts the archetypes approach as described by Mastrucci et al. (2017), evaluating global environmental performance through the analysis of a subset of archetype buildings and extrapolating the results to the entire building stock. This approach was chosen because each building was developed by a different developer and architect, rendering a building-by-building analysis impractical. The archetype approach was also chosen because of its potential application to other neighbourhoods in the future.
Two distinct types of databases were utilised to create archetypes for the neighbourhood’s landscape and infrastructure, on the one hand, and buildings, on the other. The landscape and infrastructure archetypes were developed from real data samples representing various types of landscape and infrastructure in the studied area. In contrast, the building archetypes were primarily derived from two recent interconnected studies that assessed the climate impacts of a large sample of representative building constructions in Denmark (Tozan et al. 2023, 2024). The decision to rely on average data from the literature instead of on-site data for buildings stems from the limited availability of the latter compared with landscape and infrastructure data. Both the new buildings in the neighbourhood case study and the 165 representative buildings analysed in the selected study represent recent construction—from 2015 onwards—as well as the majority of both sets of buildings feature concrete load-bearing structures, suggesting a high degree of consistency in the construction methods employed (see Documents S2 and Sy in the supplemental data online). Conversely, while archetype data for roads do exist (Lanau & Liu 2020), the intertwined nature of landscape and infrastructure (so-called ‘shared spaces’) and unique landscape conditions in the case neighbourhood would complicate the use of standard road archetypes.
The initial phase of the project centred on compiling an inventory of existing buildings, infrastructure and the landscape within the neighbourhood. Source data, obtained from Copenhagen Municipality and the design and engineering consultants responsible for planning, were collected to facilitate this process. These source data comprised drawings, building information modelling (BIM), photographs and policy documents (Table 1).
Table 1
Source data.
| INFORMATION | DATA | SOURCE | |
|---|---|---|---|
| General | Local plan boundary (functional unit—FU) | Local plan | Copenhagen Municipality |
| Master plan geometry for buildings, landscape and infrastructure | Master plan drawing files | Architect companies responsible for urban planning | |
| Buildings | Building functions | Local plan | Copenhagen Municipality |
| Building areas (m2) | Plot data (BBR-Meddelelse) | Building register (BBR) | |
| Reuse of buildings | Before and after pictures | Architect companies responsible for urban planning | |
| Building properties | Drawings of select buildings | Various architect companies | |
| Landscape and infrastructure | Landscape and infrastructure section (build-up) | Infrastructure project | Engineering companies |
| Reuse of landscape and infrastructure materials | Before and after pictures | Engineering companies |
[i] Note: BBR = Building and Housing Register.
Subsequently, the elements on the site were systematically categorised into two primary groups: ‘buildings’ and ‘infrastructure and landscape’. The decision to combine landscape and infrastructure into a single category stemmed from the interconnected nature of these elements in the case neighbourhood (e.g. shared spaces or semi-pedestrian streets).
Based on this categorisation, a database was established with essential information about the buildings, infrastructure and landscapes within the neighbourhood. For buildings, an initial categorisation was conducted to distinguish between new builds, reused and demolished buildings. This involved consulting the source data, utilising Google Earth and conducting on-site registrations.
For each building, data from the national Building and Housing Register (BBR) were employed to determine both above- and below-ground built areas. In cases where buildings were yet to be constructed, the built area could not be derived from the BBR and had to be gathered from alternative sources, such as architects’ or developers’ websites, or from digital master plan drawings. The aggregated figures were cross-verified against the maximum allowable area (m2) specified in the local plan (Århusgadekvarteret Lokalplan 2018).
New buildings were further classified into four distinct archetypes based on their function and type (Figure 4 and Table 2): apartment building (AN1), row house building (AN2), office building (AN3) and other building (AN4).
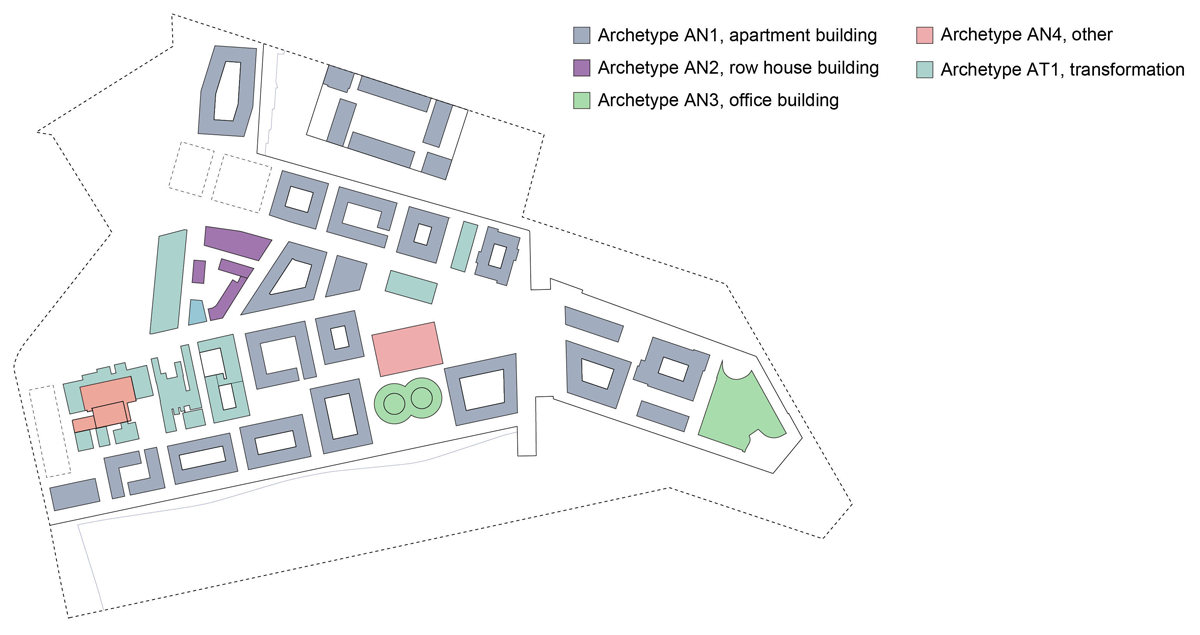
Figure 4
Map showing the building archetypes.
Table 2
Building archetypes.
| BUILDING ARCHETYPE | GROSS FLOOR AREA (M2) | FLOORS | SOURCE FOR LCA DATA | REFERENCE CASES | |
|---|---|---|---|---|---|
 | Archetype AN1: Apartment building | 191,051 | 4–6 | Tozan et al. (2023) | 42 |
 | Archetype AN2: Row house building | 4,190 | 2–3 | Tozan et al. (2023) | 22 |
 | Archetype AN3: Office building | 52,861 | 12–15 | Tozan et al. (2023) | 35 |
 | Archetype AN4: Other | 8,474 | 2–4 | Tozan et al. (2023) | 8 |
 | Archetype AT1: Reused buildings | 35,210 | 2–16 | Lund et al. (2022) | 4 |
[i] Note: LCA = life-cycle assessment.
Reused buildings following their transformation fit primarily in two distinct categories: first, buildings of up to five floors, predominantly featuring brick structures of one to two floors; and second, concrete silos of 10–16 floors (see Document S3 in the supplemental data online). Due to the limited availability of LCA data for renovations (Lund et al. 2022), as well as on-site data, subdivision into more than one archetype was not feasible.
For infrastructure and landscape, an initial assessment of the level of reuse and newbuild of materials was carried out using site drawings and images before and after development, as well as discussions with engineers (P. Lautrup Nissen, MOE Engineering, personal communication, 10 August 2022). This analysis indicated that the extent of reuse was negligeable. Despite the roads remaining in their original locations from before the site’s development, the materials utilised for road construction were fully replaced, and only a small fraction of materials was redistributed on-site. Therefore, the reuse of landscape and infrastructure materials was not factored into the calculations.
Subsequently, all the landscape and infrastructure inside the UDA were classified into six archetypes (Figure 5 and Table 3). Determining the number of archetypes involved an iterative process aimed at balancing result precision and process complexity.
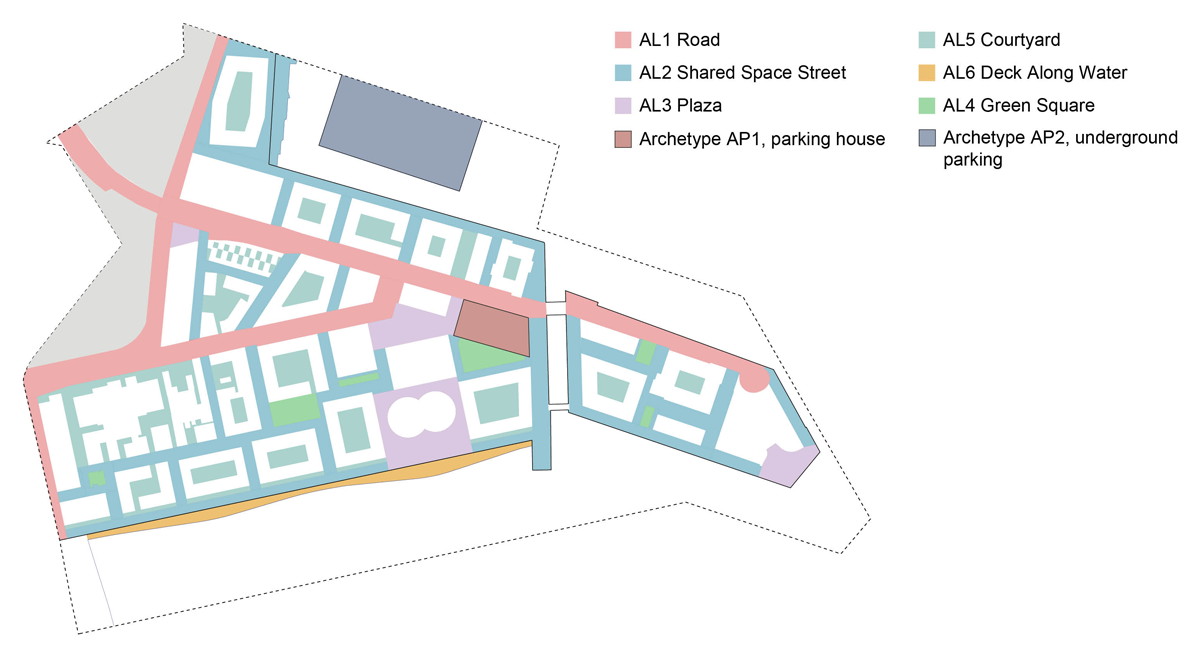
Figure 5
Map showing the landscape and infrastructure archetypes.
Table 3
Infrastructure and landscape archetypes.
| INFRASTRUCTURE AND LANDSCAPE ARCHETYPE | CASE STUDY AREAS | OUTDOOR BUILT AREA (M2) | |
|---|---|---|---|
 | Archetype AL1: Road | 3 | 25,660 |
 | Archetype AL2: Shared space street | 6 | 33,701 |
 | Archetype AL3: Plaza | 6 | 10,955 |
 | Archetype AL 4: Green square | 3 | 3,137 |
 | Archetype AL5: Courtyard | 3 | 22,310 |
 | Archetype AL6: Deck along water | Material quantities derived from building projects sourced from architects | 3,100 |
| SOURCE FOR LCA DATA | GROSS FLOOR AREA (m2) | ||
 | Archetype AP1: Car parking facility | LCA carried out specifically for this study using LCAByg | 17,394 |
 | Archetype AP2: Underground parking | LCA carried out by developer and engineer | 30,000 |
[i] Note: LCA = life-cycle assessment.
Car parking facilities were also allocated to ‘landscape and infrastructure’, adding two further distinct archetypes based on whether a car parking facility is above ground (AP1) or underground (AP2). This choice aligns with other studies, such as the recent one by Sigurðardóttir et al. (2023). Although Eurostat statistics officially classify car parking facilities as ‘buildings’, their functional role resembles that of open parking spaces, which are considered infrastructure assets.
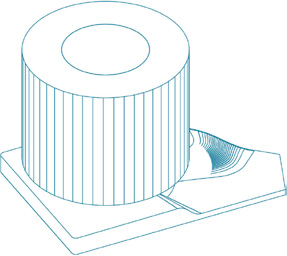
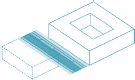
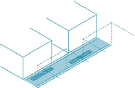
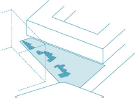
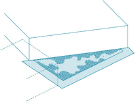
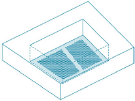
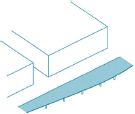
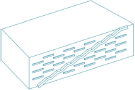
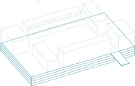
For five of the six infrastructure archetypes, three to six subareas were studied in greater detail to define the average material quantities/m2 of built area (see Document S7 in the supplemental data online). This analysis utilised detailed sections drawings from the landscape and infrastructure project. The archetypes considered also include light fixtures, underground sewage and services, and waste bins. Average material amounts per m2 for each archetype were subsequently multiplied by the total surface area for each archetype to derive overall material quantities. The method is illustrated in Figure 6.
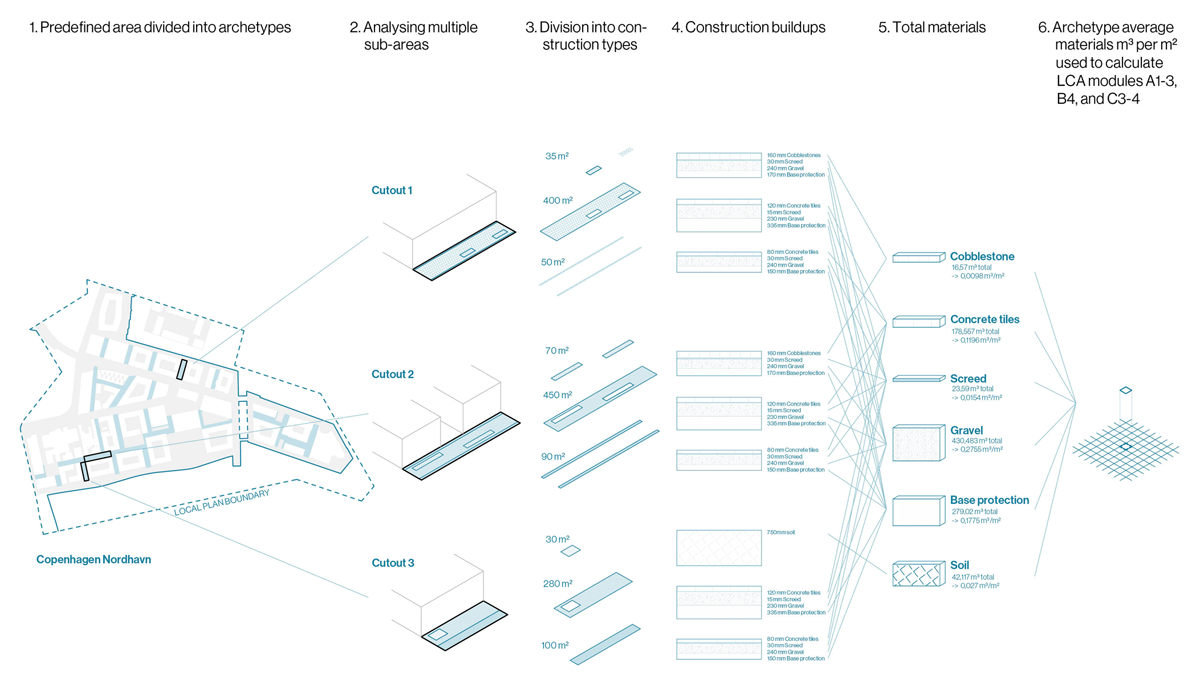
Figure 6
Method used to derive material quantities for the archetypes.
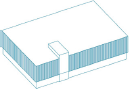
Notably, major earthworks could not be covered in the archetypes and are therefore accounted for separately. These include features around the water, landfill, excavating canals and establishing retaining walls. As can be seen in Figure 7, a significant portion of the landfill was associated with the construction of the new artificial island in the harbour, a feature unique to this neighbourhood.
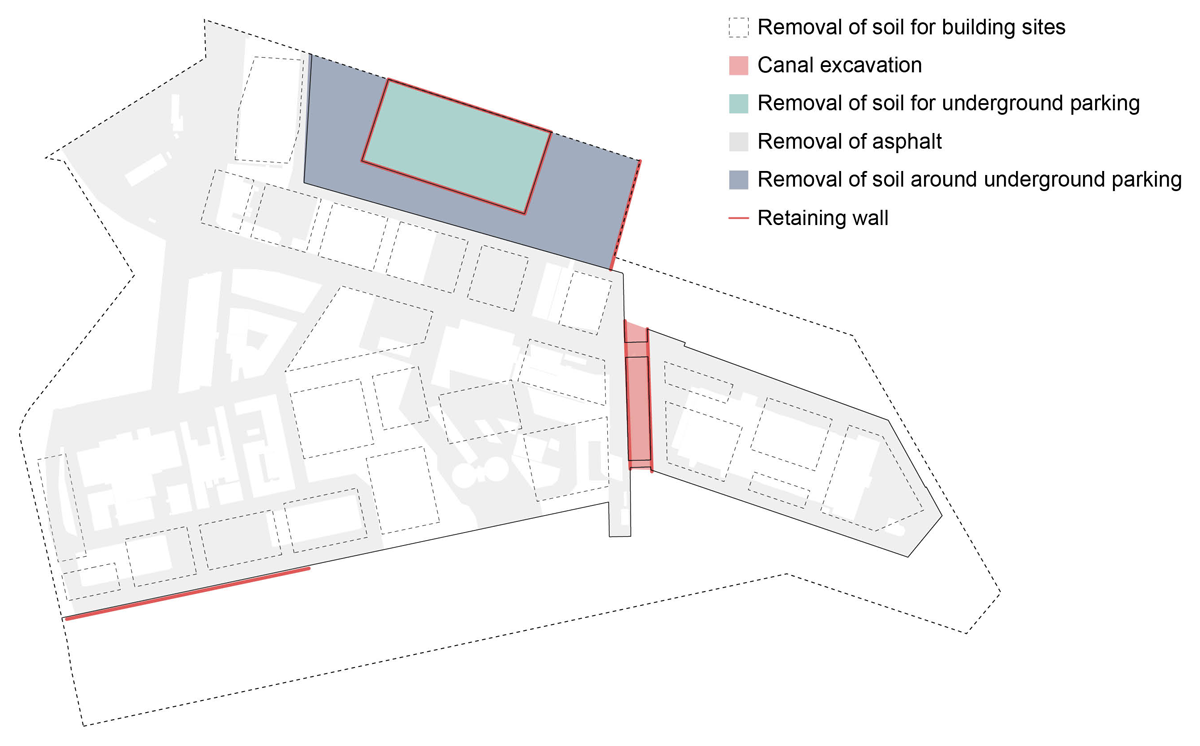
Figure 7
Major earthworks and their subcomponents.
A significant aspect of the case neighbourhood was the establishment of a new underground/overground metro line serving both the new neighbourhood and the broader urban development of Nordhavn. However, despite being a substantial piece of infrastructure, it was excluded from the calculations at this stage due to a lack of data and uncertainty regarding the allocation of associated climate impacts to the case neighbourhood.
2.3 Life-cycle assessment (LCA)
2.3.1 Functional unit (FU)
The FU serves as the foundation for any LCA study, ensuring comparability between projects. Defining an FU for a neighbourhood is particularly challenging because it includes multiple systems, fulfils multiple functions, and is unique in its geographical location, spatial area, open spaces, building characteristics and population (Lotteau et al. 2015). Broadly, this study employs two types of analysis. The first is a comprehensive analysis that considers buildings, landscapes and infrastructure within the local plan boundary (Århusgadekvarteret Lokalplan 2018), including construction carried out between 2015 and 2023, to assess the overall impact and relative contributions of buildings, landscapes and infrastructure. The second involves distinct analyses for buildings, landscapes and infrastructure to identify hotspots within each category.
The FU for the first type of analysis is the total studied area of buildings (above and below ground), landscapes and infrastructure that that serve a population of 2761 inhabitants (as of 2023, the study’s endpoint) over a 50-year reference study period. This 50-year period is commonly used in building-related LCA studies, aligns with Danish regulations and complies with the revised Energy Performance of Buildings Directive (EPBD). It also suits the assessment of landscapes and infrastructure, as assets such as roads are often replaced alongside upgrades to electrical or pipeline networks, typically considered to have a 50-year service life (Chohan et al. 2023).
In the more detailed analysis, where buildings and infrastructure are assessed separately, the FU for buildings follows the metric outlined in Danish building regulations, which is gross floor area (GFA)/year. For landscapes and infrastructure, the FU is defined as the area of outdoor space/year.
2.3.2 System boundaries
The analysis includes several components: the demolition of existing buildings and the removal of asphalt, soil and other elements associated with the infrastructure already present in the area (preconstruction demolition); the production and installation of new building materials and products (modules A1–A5) for constructing new buildings and infrastructure, as well as transforming existing buildings for reuse; the maintenance of all buildings (new and reused) through product replacements during the 50-year-use stage (module B4); and the end-of-life processes for these buildings (modules C3–C4). The potential for reuse, recovery and recycling beyond the building’s life-cycle (module D) is calculated and shown separately from the overall life-cycle impact results, as recommended by EN 15978 (CEN 2011). For the physical system boundary in terms of the building and infrastructure elements included in the scope, see Document S8 in the supplemental data online.
The focus on embodied GHG emissions in this study is due to their increasing share in Denmark as the energy supply system transitions to decarbonised sources. Emission factors reflecting the future evolution of the energy grid are required in Danish LCAs for the calculation of module B6 according to building regulations. For example, the factors to be used from 2025 indicate a significant decline in operational GHG emissions for buildings, contributing, on average, only 9% to the total life-cycle impact (Tozan et al. 2023).
In applying LCA to building transformations, there is debate over how to treat three key elements (Balouktsi & Lützkendorf 2022): (1) new products and components installed (whether or not replacing old ones); (2) removed products and components; and (3) retained parts of the original structure reused after transformation. According to the Danish building regulation, repurposed components are assumed to have no impact from their previous manufacturing, installation (modules A1–A5), in-use phase (B4) or end of life (C3–C4). This assumption is also adopted in the present study. While this zero-impact approach is common practice, post-transformation impacts on retained parts are considered in some non-regulatory methods in Europe (Balouktsi & Lützkendorf 2022). In both the Danish regulations and the present study, the zero-impact approach is primarily used to simplify calculations and promote reuse.
2.3.3 Environmental and service life data
For buildings, the LCA data were obtained from reference cases corresponding to each archetype, sourced from existing reports developed by Aalborg University for the Danish government (Lund et al. 2022; Tozan et al. 2023).
Tozan et al. (2023, 2024) analyse 163 representative new buildings built between 2015 and 2020. Their study served as the basis for Danish legislation on the environmental impact of buildings and was therefore considered a valid source for the present study. The environmental data used for the calculation of these 163 buildings are derived from ÖKOBAUDAT 2023 (German Federal Ministry for Housing, Urban Development and Building 2023), which complies with EN 15804+A2 (CEN 2021), as well as a newly developed Danish generic database of CO2e values for the 30 most commonly used building materials (Kragh & Birgisdottir 2023).
The values for climate impact per m2 for each building type during the construction process (modules A4–A5) were derived from a recent Danish study that analysed the climate impact of 52 construction sites (Kanafani et al. 2023). Module A5 encompasses emissions related to energy-consuming activities on-site as well as emissions associated with construction waste.
For reused buildings, the study made use of the underlying data from yet another report (Lund et al. 2022) that covers various renovation cases. Of these, four cases involving renovations due to a change in use were considered relevant for the types of building transformations occurring on-site.
From these reports, median values of climate impact per m2 for each building type and life-cycle module included in the scope were utilised (see Document S8 in the supplemental data online). Detailed analyses of selected buildings within the area revealed significant similarity in physical properties such as depth, height and structural systems, indicating a predominance of standardised housing and office buildings. This finding supported the use of median values.
For the demolition of buildings on the site prior to development, demolition data for single-family houses (Tozan et al. 2023) were used. The buildings demolished were primarily one- to two-storey brick structures (see Document S4 in the supplemental data online), and the single-family house category was considered most similar in terms of material quantity and properties.
As for infrastructure and landscape, LCA data were directly derived from calculations within InfraLCA, a publicly accessible tool developed by the Danish Road Directorate (2023). It is designed primarily for infrastructure, but encompasses all elements pertinent to both landscape and infrastructure construction in the case neighbourhood, materials as well as major earthworks, bridges, etc. InfraLCA was used to generate CO2e for each infrastructure archetype and for the area as a whole based on the aggregate material quantity data from infrastructure archetypes (for the disaggregated results, see Document S7 in the supplemental data online).
Construction products with a shorter service life than the reference study period will need to be replaced one or more times during that period. For a list of examples of the service life data utilised for B4 calculation and their sources, see Document S8 in the supplemental data online.
3. Results
The total gross floor area of buildings in the neighbourhood is 291,786 m2, including 26,118 m2 in basements. When including car parking facilities, this is 339,180 m2, which aligns with the maximum limit of 350,000 m2 outlined in the local plan, with some buildings still pending construction (see Document S5 in the supplemental data online).
Multi-storey residential buildings (four to six stories), classified under archetype AN1, dominate the constructed area, occupying approximately 66% of the total building floor area (Figure 8). Row houses (two to three stories) make up 1%; and office buildings constitute 18%. A total of 39,619 m2 of the existing buildings on-site were demolished, while 35,210 m2 were repurposed and transformed for new functions.
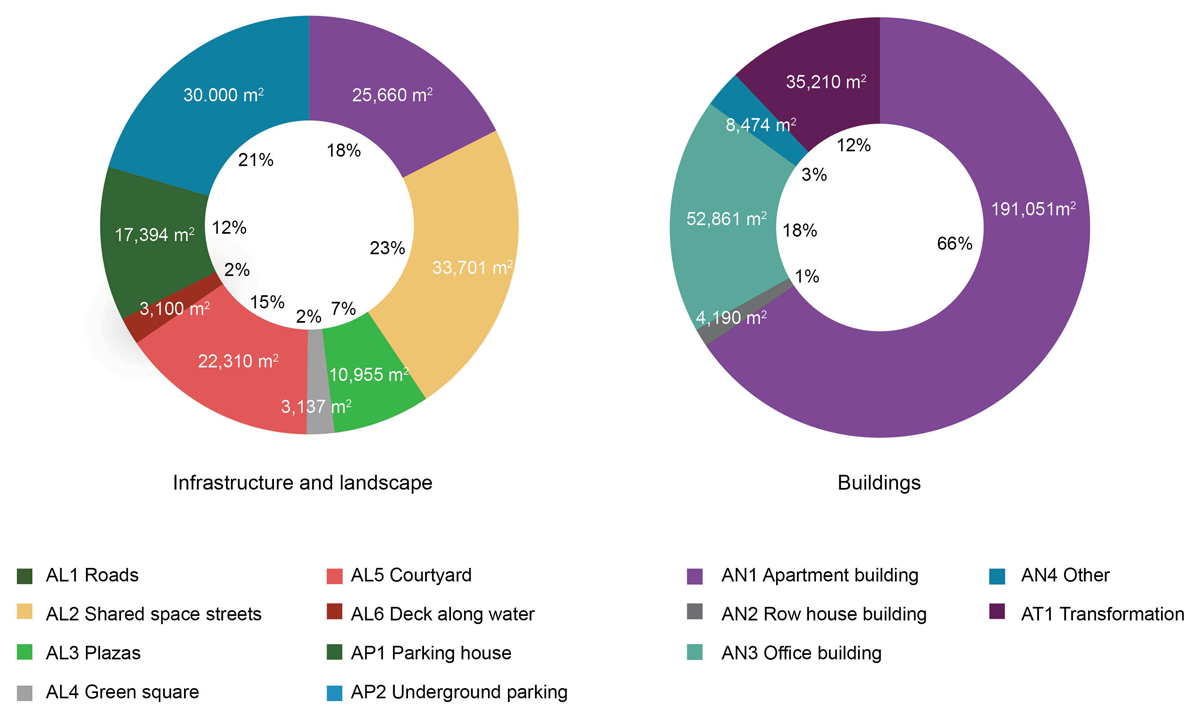
Figure 8
Built areas in the case neighbourhood.
In terms of infrastructure and landscape, the case neighbourhood encompasses 98,864 m2 of open space, nearly 10 ha. Approximately 23% of this space is in private courtyards, while the remainder is in public roads, pavements and other public spaces.
3.1 Total embodied climate impacts
The embodied climate impact for the area as a whole is 172,149 tonnes CO2e over a 50-year study period. This equates to approximately 589 kg CO2e/m2 of building over 50 years.
The majority of these emissions, accounting for approximately 78%, can be attributed to buildings, while the remaining 22% are allocated to infrastructure and landscape (Figure 9). The substantial share of embodied CO2e emissions from buildings is likely linked to the high building density in the area. However, it is important to note that the metro is excluded from the calculation.
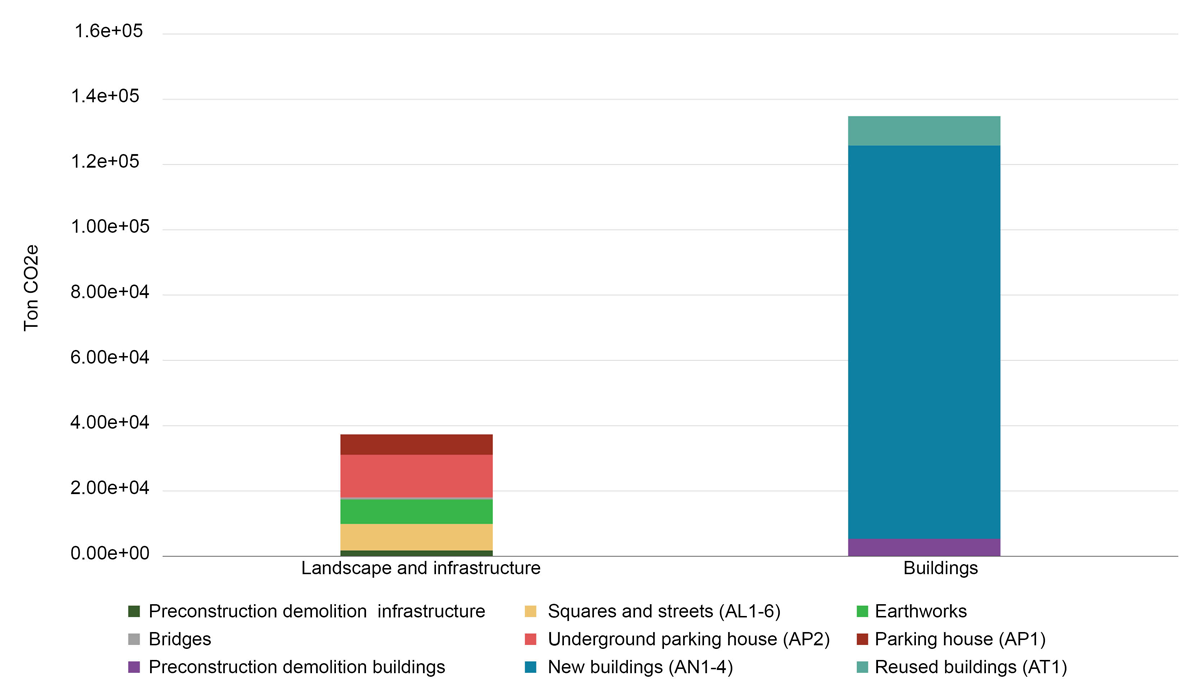
Figure 9
Total climate impacts in the case neighbourhood.
When examining the allocation of climate impact across various life-cycle stages, it becomes evident that the majority of embodied emissions (127,532 tonnes CO2e, or 74%) occur upfront, primarily during material production (modules A1–A3), the vast majority of which are allocated to new buildings (Figure 10).
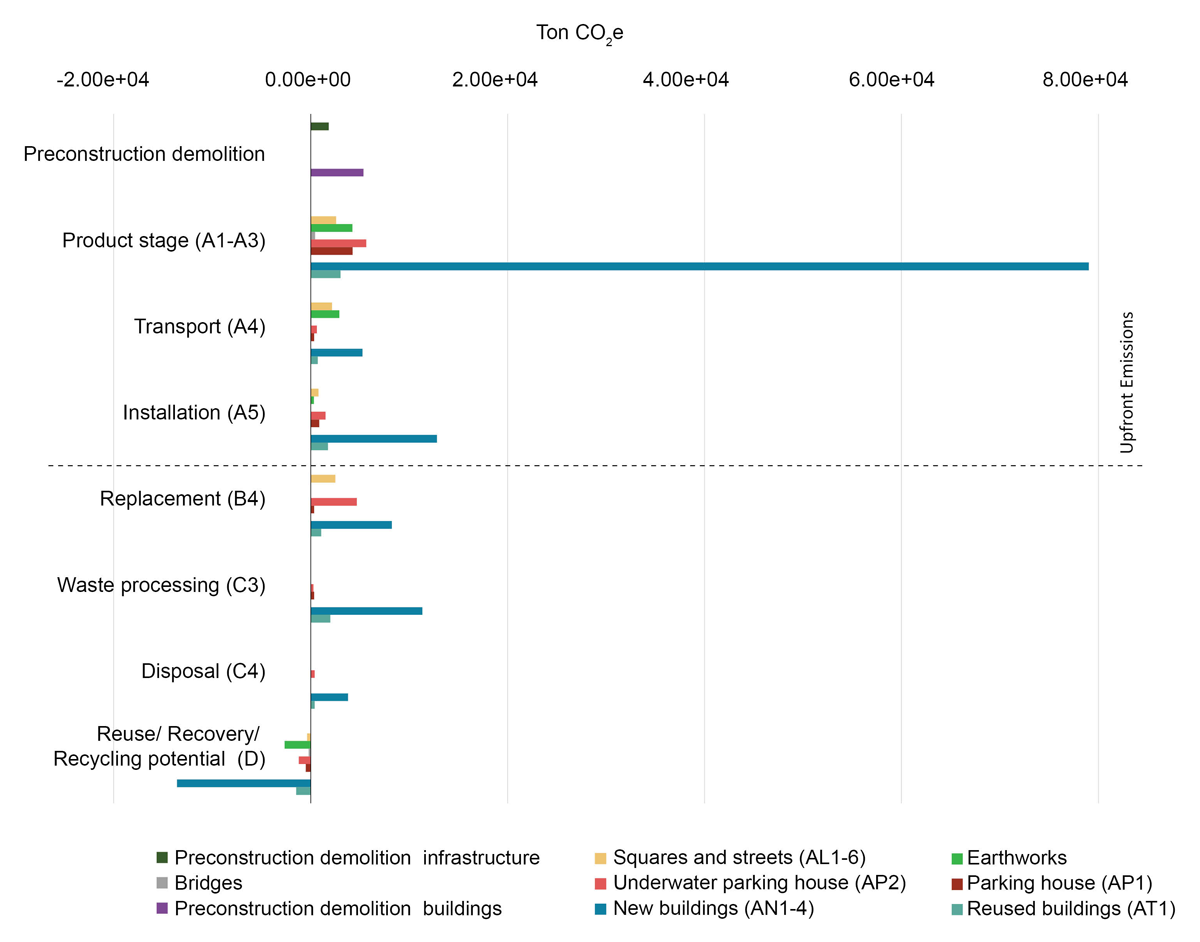
Figure 10
Global warming potential (GWP) total embodied climate impact.
3.2 Landscape and infrastructure
The total life-cycle embodied carbon emissions related to landscape and infrastructure, including both streets and squares (archetypes), major earthworks and car parking facilities, is 37,321 tonnes over the 50-year reference study period. Around half of the new climate impacts associated with infrastructure and landscape (19,336 tonnes CO2e, or 52%) are in car parking facilities, around one-fifth (8225 tonnes CO2e, or 22%) are in streets and squares, and another one-fifth (8090 tonnes CO2e, or 20%) are in major earthworks (e.g. landfill, canal excavation and retaining wall construction) The preconstruction demolition and bridges account for a relatively small portions of the climate impacts (5% and 1%, respectively).
With a total open space area of 98,864 m², the CO2e emissions linked to infrastructure and landscape average 377 kg/m² of open space over the entire life-cycle.
Figure 11 illustrates the archetypes of streets and squares developed in this study, highlighting that the deck along the waterfront stands out with the highest emissions at 4.42 kg CO2e/m2/year. This is primarily due to its construction resembling that of a bridge, suspended over water and supported by a substantial steel structure. In contrast, the other archetypes, which share more similarities, exhibit a range from 1.31 kg CO2e/m2/year for courtyards to 2.57 kg CO2e/m2/year for plazas.
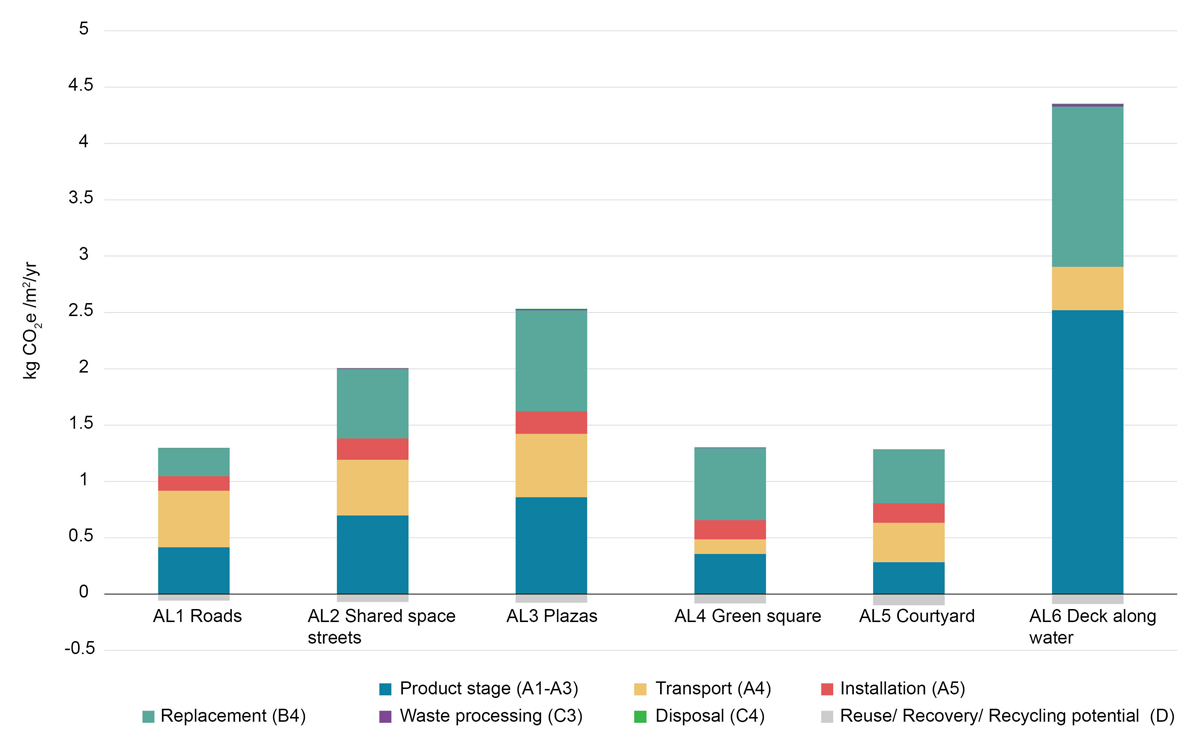
Figure 11
Global warming potential (GWP), average embodied climate impact in landscape and infrastructure archetypes (kg CO2e/m2/year).
It is noteworthy that AL1 roads have a significantly lower climate impact than plazas, despite their deeper build-up. This is because aggregates have a relatively low climate impact compared with surface materials such as concrete tiles, street furniture and lighting.
The earthworks category includes several significant hotspots, notably the addition of 300,000 m3 of soil and sand to the area, which contributes around 5600 tonnes CO2e, i.e. 9% of the total embodied carbon in infrastructure and landscape. The establishment of nearly 5000 m2 of retaining walls is another key factor, accounting for 1700 tonnes CO2e over the life-cycle, also equivalent to 9% of the total embodied carbon in this category.
3.3 Buildings
The total life-cycle embodied carbon emissions related to buildings are 134,828 tonnes CO2e over the entire life-cycle, of which 108,774 tonnes CO2e (80%) are upfront.
Around 120,499 tonnes CO2e (88.9% of all building-related emissions) are attributed to new buildings (archetypes AN1–AN4), while 8966 tonnes CO2e (6.6% of all building-related emissions) are attributed to the transformation of existing buildings. The remaining 4.5% are attributed to preconstruction demolition.
The average CO2e/m²/year for building archetypes (as outlined in Document S8 in the supplemental data online) falls within a relatively narrow range, from 9.0 kg CO2e/m²/year for two- to three-storey row houses (archetype AN2) to 9.6 kg CO2e/m²/year for apartment buildings (AN1). For context, data from two actual on-site multi-storey residential buildings were analysed, yielding 8.66 and 9.33 kg CO2e/m²/year, both closely aligning with these reference values.
Document S9 in the supplemental data online provides the background data for Figure 10, showing that the aggregated results for each archetype group are nearly proportional to the total floor area of each archetype, as all archetypes exhibit relatively consistent climate impacts per m². The majority of the climate impact is attributed to apartment buildings, particularly archetype AN1. The reuse of existing buildings contributes only marginally to reducing overall embodied carbon emissions due to their relatively low proportion compared with the total building mass.
3.4 Sensitivity analysis
Sensitivity analysis assesses how variations in input parameters affect the model results, providing insights into the robustness of the findings. In this study, the sensitivity analysis focuses on building category, which is expected to have the highest uncertainty due to the use of archetypes derived from the literature. The analysis calculates the climate impact range for archetypes AN1–AN4 and demolished buildings using impact values defined by the lower and upper quartiles (Q1 and Q3, respectively) from Tozan et al. (2023) (left side of Figure 12). This approach captures a range of high and low emission scenarios from a building sample representative of modern construction practices in Denmark, excluding extreme values. For archetype AT1, the minimum and maximum values are based on the four cases from Lund et al. (2022). When compared with the median scenario aggregated for the category ‘buildings’ (right side of Figure 12), the total life-cycle climate impact is approximately 24% lower in the minimum scenario and about 17% higher in the maximum scenario. In the context of building LCA, factors that induce fluctuations exceeding 15% from the baseline are deemed highly sensitive (Li et al. 2023). This suggests that while employing archetypes that differentiate building types but assume uniform climate impacts per m2 and material requirements within each type may be suitable during the early planning phase of a neighbourhood, project-specific bills of quantities should take precedence in later planning phases, once such data become available.
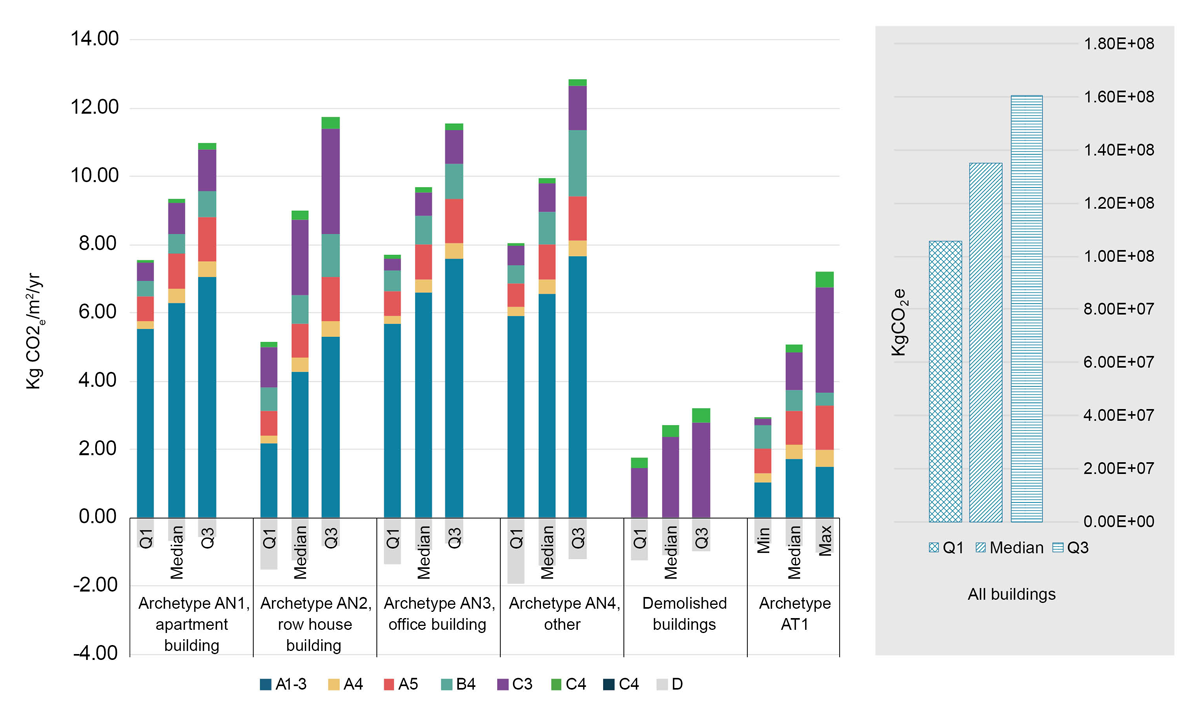
Figure 12
Sensitivity of the magnitude of buildings’ climate impact with respect to the range of impact per m2 from the chosen base studies.
3.5 Impacts per inhabitant
At the end of the study period, the area housed 2761 inhabitants, according to the developer (L. Rosenholm, SV: Indbyggertal for Århusgadekvarteret, personal communication, 1 November 2024). The total carbon emissions of 172,149 tonnes CO2e corresponds to an average impact of approximately 62 tonnes CO2e/inhabitant. It is noteworthy that around 15% of the gross floor area is dedicated to functions other than housing. This suggests that a portion of the emissions originates from mixed-use spaces, potentially affecting the overall per inhabitant impact assessment.
4. Discussion
The following discussion addresses the results and methods in relation to the research questions and current state of the art. Furthermore, it delves into the findings concerning the embodied climate impact of the case neighbourhood, contextualising them within existing research, the broader urban planning landscape and the forthcoming alignment with the Paris Agreement.
4.1 Hotspot analysis of embodied climate impact
4.1.1 Landscape, infrastructure and buildings
The relatively modest portion of embodied CO2e emissions assigned to the landscape and infrastructure category (22%, including 12% from car parking facilities) is consistent with existing research findings. Previous urban LCA and material flow analysis studies demonstrate the inherent correlation between infrastructure stock and urban density (Du & Wood 2017; Nichols & Kockelman 2014; Norman et al. 2006). More dispersed urban settings tend to see an increased share of materials and climate impacts linked to infrastructure and landscape. For example, Schiller (2007) found that in densely built areas, the size of infrastructure stocks is about one-sixth of the total built environment stock, while this rises to two-fifths in low building-density areas. Augiseau & Barles (2017) calculated the share of infrastructure stock in Paris and its suburbs and found that infrastructures account for 10% of the total built environment material stock of the city, while it increases to 18% in the inner suburbs and 40% in in the outer suburbs. The UDA analysed in the present study exhibits a relatively high density; it is therefore unsurprising to see roughly one-fifth of embodied emissions attributed to infrastructure.
However, it was somewhat surprising that the two car parking facilities had a greater climate impact than the 10 ha of open space. Additionally, despite significant earthworks such as landfill, canal excavation and retaining wall construction, the share of climate impact remains relatively low.
Emissions for streets and squares alone (excluding bridges and major earthworks) are 82 kg CO2e/m², equivalent to an annual rate of 1.64 kg/m². These results align with findings from previous research. A comparison with Lanau & Liu’s (2020) archetypes of standard roads and paths shows that they range between approximately 56 and 80 kg life-cycle aggregated CO2e/m2 for modern roads compared with the range between 66 and 128 in this study (excluding archetypes AL5 and AL6: the courtyard and a deck along the water). However, the archetypes in this study include more elements, such as lighting and sewage systems, which contribute to the higher impact.
Nevertheless, it is crucial to emphasise that the relatively low share of climate impacts assigned to infrastructure and landscape does not imply insignificance. The embodied emissions linked to infrastructure and landscape (37,321 tonnes over the entire life-cycle) represent a noteworthy amount of embodied CO2 emissions, particularly seen through an absolute sustainability lens. It is also important to note that the metro, which is not included in this calculation, could substantially increase the relative share attributed to infrastructure and landscape. Looking ahead, the relative share of climate impact associated with infrastructure is expected to rise as climate regulations with stricter limits apply to buildings but not to infrastructure (The Ministry of Social Affairs, Housing and Senior Citizens 2024). In other words, the climate optimisation of infrastructure is not officially mandated. This underscores the increasing relevance of infrastructure, especially in more dispersed suburban settings where its share is higher, as indicated by previous research (Schiller 2007; Augiseau & Barles 2017). Future studies could delve deeper into these dynamics, exploring relationships across various urban settings such as greenfield, brownfield and different densities.
Within buildings, it is noteworthy that new constructions for housing and offices (archetypes AN1–AN4) account for 89.3% of all building-related emissions and 70.7% of the area’s total embodied climate impact. These buildings display striking similarities in terms of morphology and structure. This underscores the significance of these constructions and the potential impact that building technologies (e.g. using wood instead of concrete) as well as carbon regulations for new buildings could have. This could provide valuable input to the ongoing debate and calls for more stringent legislation regarding LCA targets for buildings.
4.1.2 Reuse
The environmental impact of reused buildings is significantly lower than that of new buildings, making it a favourable strategy at the building level, although reused buildings still generate significant emissions, and the degree of transformation and resulting impacts can vary widely (Lund et al. 2022).
Yet, at the level of the case neighbourhood, reuse marginally contributes to reducing the neighbourhood’s total embodied climate impact due to the low proportion of reused buildings compared with new builds (a characteristic shared with other similar neighbourhoods, albeit to somewhat varying degrees). Moreover, the potential to increase the share of reuse within the case neighbourhood is small, as relatively few buildings were demolished compared with the amount of new builds. This finding underscores a critical dilemma in Copenhagen’s urban planning. While there is increasing interest in reuse as a sustainable strategy, much of the new construction occurs in areas with limited existing buildings available for reuse, thus restricting potential environmental benefits.
The limited impact of building retention in this neighbourhood does not diminish the broader value of reuse as a sustainability strategy (Pomponi & Moncaster 2016). Instead, it highlights the importance of context-sensitive approaches to sustainability. Additionally, the findings suggest a potential tension between compact city policies promoting high-density development (Bibri et al. 2020) and building retention goals—an area beyond the scope of this study but deserving of further exploration.
Ultimately, the limited benefits of reuse in the studied neighbourhood point to several potential strategies: reducing new construction altogether, emphasising low-carbon materials and technologies for new builds, developing planning models that prioritise existing building inventories over land availability, or adopting a combination of these approaches. This calls for further research to fully understand the broader implications and balance these complex, interrelated priorities.
4.2 Methodological approach
While all neighbourhood-scale LCAs are inherently complex (Lotteau et al. 2015), the specific complexity of this case study led to a focus exclusively on embodied impacts, as including operational energy would have excessively expanded the scope. Despite this limitation, the study provides valuable findings and serves as a stepping stone for more comprehensive future research. Drawing on existing research, a broader approach could include operational energy or compare embodied impacts across different urban contexts (e.g. Du & Wood 2017; Norman et al. 2006) or development scenarios within the same area (e.g. Cerezo Davila & Reinhart 2013; Riera Pérez & Rey 2013; Trigaux et al. 2014). Variations in demolition levels could also be explored, particularly in areas with more existing buildings or demolition activity.
A key aspect of this study involved applying an archetype approach to large, complex areas characterised by mixed typologies, including both new builds and reuse projects. Existing archetype studies often focus on more homogeneous areas (e.g. Cerezo Davila & Reinhart 2013; Nichols & Kockelman 2014; Stephan et al. 2013), while mixed-use areas often are smaller in scale, allowing for a building-by-building approach (e.g. Sigurðardóttir et al. 2023). Challenges persist in defining meaningful groupings of elements, such as the categorisation of reuse buildings in this context. However, this approach offers useful insights for studying mixed-use areas, which are common in contemporary urban development with limited or complex data.
The decision to combine on-site data with external reference cases for archetype generation was guided by the area’s composition and data availability. While this approach created a flexible framework adaptable to various contexts, some limitations remain. Relying on external references reduces contextual accuracy and impacts validity. Similarities in height, building type and structural system within each archetype—particularly for archetypes AN1 and AN2—further support this approach, though the alignment was less pronounced for the transformation archetype (AT1). Comparisons with on-site reference cases (see Section 3.3) suggest reasonable accuracy, especially since all the new building archetypes had relatively similar values for kg CO2e/m2, yet this limitation persists. Closer alignment with actual building characteristics or exclusive use of on-site data could further streamline system boundary definitions. However, using more on-site data must balance improved precision with time efficiency.
There is a high level of uncertainty regarding the impact per m2 of reused buildings due to their diverse range of types and transformations (see Document S3 in the supplemental data online). Achieving greater resolution would have been beneficial, particularly in separating the impacts of the two main building types—tall silos and low brick buildings—rather than grouping them into a single category. Additionally, having more reference cases would have strengthened the analysis. Despite these limitations, the relatively minor contribution of this category suggests that the overall climate impact estimate remains robust. While additional on-site data would have enhanced accuracy, their absence highlights a key area for future research.
A final limitation concerns the availability and clarity of data for infrastructure and landscape elements. Building data are typically well-documented through BIM, but infrastructure, landscape and earthworks data often lack comparable spatial and temporal resolution which extend beyond neighbourhood boundaries, such as the metro in this case. This gap not only makes the inventory process labour intensive but also risks underestimating impacts related to infrastructure.
Using municipal and local planning frameworks to situate the study within a specific geographical and planning context differentiates it from existing Danish work (Schjørring Wied & Madsen 2023) and helps define the case study area, addressing the challenge of delineation (Lotteau et al. 2015). This approach aims to enhance the study’s usefulness by situating its results in relation to planning practices, while also facilitating assessments of its broader applicability and comparability for future research. Further refinement could extend this method to broader planning contexts and explore its implications for planning practices in greater depth.
4.3 Climate impact in relation to absolute boundaries
A final point of discussion is the climate impact of the case neighbourhood in relation to absolute boundaries.
The allocation of global boundaries raises ethical considerations beyond the scope of this paper. Therefore, this study relies on an established reduction roadmap (Petersen et al. 2022). This roadmap scales global GHG emission target levels (2.51 Gt CO2e/year) down to the national level using an equal per capita sharing principle (with Denmark representing 0.075% of the global population), then to the industry level (where new housing accounts for 3.3% of Denmark’s emissions), and finally to new housing construction (approximately 3,072,000 m2/year). With this methodology, the housing sector is granted an annual CO2e budget of 62,122 tonnes.
Comparing this approach with the case neighbourhood, the total upfront embodied carbon amounts to 127,532 tonnes over the nine-year construction period from 2015 to 2023, resulting in an average emission of 14.170 tonnes CO2e/year. The annual embodied emissions of the case neighbourhood would constitute approximately 23% of the yearly national budget assigned to the housing sector. Additionally, the upfront emissions associated with landscape and infrastructure are 28,668 tonnes CO2e, corresponding to 3185 tonnes CO2e/year. This would constitute 5.1% of the yearly national budget allocated to the housing sector.
The studied UDA exhibits a rather typical density and rate of reuse compared with other UDAs in Copenhagen, as well as relatively typical construction practices. Therefore, extrapolating results from the present study to other Copenhagen UDAs can provide a rough order of magnitude of embodied emissions from development in these UDAs. The upfront emissions are approximately 507.6 kg CO2e/m² of built gross floor area (including car parking facilities). Multiplying this by the 456,000 m² built annually in UDAs in Copenhagen results in a total of 231,441 tonnes CO2e, roughly 374% of Denmark’s total annual carbon budget for housing. Notably, this figure excludes the 24% of construction occurring outside of UDAs.
It is important to note that this quick comparison is intended to provide a general sense of scale. The method has several limitations, such as comparing the area’s upfront carbon emissions with the housing’s budget (despite around 15% of the neighbourhood’s built area being dedicated to other functions). Additionally, comparing historical development with forecasted carbon budgets introduces inherent uncertainties.
Despite these challenges, the comparison offers valuable insights into the climate impacts of urban design, particularly UDAs, and the challenge of aligning with the Paris Agreement. The substantial share of the national CO2 budget attributed to the case neighbourhood also confirms the need for alternative planning models, as outlined in Section 4.1.2.
5. Conclusions
The life-cycle assessment (LCA) for urban development areas (UDAs) is complex, involving both detailed inventory and analysis, with limited literature available. To the authors’ knowledge, this study is the first analysis of urban transformation encompassing both reuse and new construction, with diverse building typologies and functions, characteristic of contemporary urban development, particularly within a Danish context.
The results show that the overall impact of the neighbourhood amounts to 172,000 tonnes CO2e over a 50-year period. The majority of embodied emissions (74%) occur upfront, primarily during material production (modules A1–A3). The yearly upfront emissions correspond to 23% of Denmark’s yearly budget for housing according to the Reduction Roadmap (n.d.).
The combination of archetypes and LCA, utilising cross-referenced on-site and average data, establishes a robust and adaptable analytical framework applicable to future studies in diverse urban contexts, allowing for tailored applications based on data availability.
The results show that the majority of emissions originate from new buildings, particularly apartments, highlighting the need to focus on this area. This underscores the significance of these constructions and the potential impact of building technologies (e.g. using wood instead of concrete) and climate impact regulations for new buildings. These insights could inform the ongoing debate for more stringent carbon limits in building legislation. A reduction to 4.0 kg CO2e/m2/year (excluding LCA phases A4–A5), as seen in recent best-practice examples (Garnow et al. 2024), could reduce emissions by 70,000 tonnes, or nearly 40%, for the entire neighbourhood. It should be noted that landscape and infrastructure also emit substantial amounts of CO2e, and their share will likely increase with the continuous tightening of building regulations in Denmark.
Overall, the findings underscore the significant climate impact related to urban planning, particularly the development of UDAs such as the case neighbourhood, especially regarding upfront carbon and absolute environmental boundaries at both city and neighbourhood scales.
The study highlights the potential for urban planning practices and policies to align with the Paris Agreement. In addition to focusing on low-carbon materials and technologies for new construction, strategies could include planning models that prioritise the reuse of existing buildings over land availability, or a combination of both approaches. Ultimately, there may also be a need to reduce new construction altogether by revising permissible building rights.
Competing interests
The authors have no competing interests to declare.
Data accessibility
The data supporting this study are provided in the supplemental data online. Additional data is available from the author upon reasonable request.
Funding
This research is part of an industrial PhD funded by Innovation Fund Denmark and Cobe.
Supplemental data
Supplemental data for this paper can be found at: https://doi.org/10.5334/bc.478.s1