
Table 1
Performance goals for passive massing and envelope strategies.
| Results | Baseline | Target |
|---|---|---|
| EUI (%) reduction from baseline | 0% | 70% |
| Site EUI, kBTU/ft²/yr (kWh/m2/yr) | 51 (160.9) | 16 (50.5) |
[i] Note: EUI = energy-use intensity.
Table 2
Weeks 1–7: studio schedule and process.
| Weekly topic (or activity) | Testing method or reference | Sharing | Gathering and discussion format | |
|---|---|---|---|---|
| W1 | Passive and adaptive building envelopes | Joe Lstiburek’s Perfect Wall and Loonen’s Climate Adaptive Building Shells (CABS) taxonomy | Wall sections | Whole studio: Steps 1 and 2 |
| W2 | Passive strategies (massing, form, location, orientation, glazing) iterations | Sefaira Energy modeling (Workshop 1—Passive) and climate consultant site analysis to create the baseline performance | Site analysis with climate consultant or Ladybug, massing thematic ideation through models | Whole studio: Steps 1–3 |
| W3 | Iterative development of passive massing strategies | Testing each massing strategy for Architecture 2030 performance measures with Sefaira | Baseline models, Sefaira test performance results for massing iterations: energy-use intensity (EUI), CO2, daylighting metrics, renewable energy needs | Whole studio: Steps 1 and 2 |
| W4 | Passive and adaptive envelope strategies | Testing net positive (different calculations and metrics dependent on strategies) | Energy production strategies, wall sections and massings of passive and adaptive envelopes | Within small groups: Steps: 1–3 |
| W5 | Active systems (heating, ventilation and air-conditioning—HVAC) | Sefaira Energy modeling (Workshop 2—Systems and Envelopes) | Wall sections, Sefaira passive strategy results, adaptive or net-positive ideation | Within small groups: Steps 1 and 2 |
| W6 | Taking stock: passive massive and envelope Architecture 2030 performance; net-positive and adaptive envelope strategies | Architecture 2030 the goal requirement with Sefaira | Sefaira test performance results of passive envelope and HVAC selections: EUI, CO2 emissions; identifying issues and questions for final discussion | Whole studio: Steps 1 and 3 (regrouping for final discussion, roster preparation only) |
| W7 | Final versions of all artifacts for passive, adaptive and net-positive strategies | Energy modeling results for passive strategies | Second iteration of issues and questions for discussions | Whole studio: Step 1 (for discussion only) |
[i] Note: Step 1: Setting the table: displaying and sharing all work; Step 2: Conflation: discussing all work, finding groupings of multiple works based on emerging thematic commonalities without regards for individual authorship; and Step 3: Self re-assignment of ownership: student(s) take responsibility for forwarding work groupings based on interest, strengths (skills they can contribute or teach) or deficits (skills they need to learn) rather than ownership.
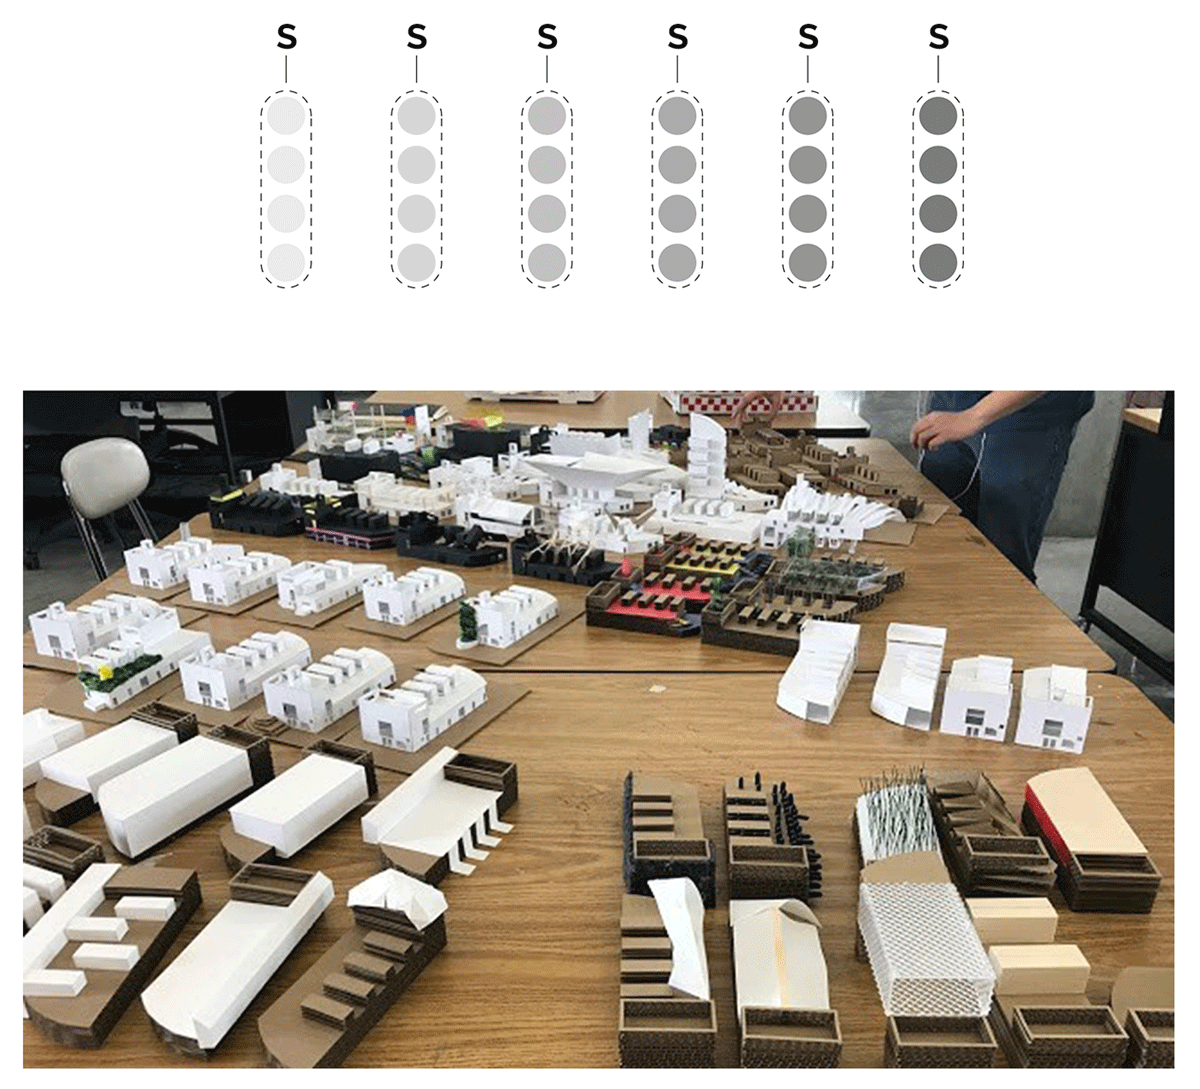
Figure 1
Step 1: Setting the table.
Note: Each student contributes multiple artifacts to the studio for discussion. Here, an individual student (S) is shown to contribute four artifacts (circles). It is understood that a student’s artifacts embody their attempts to give form to their ideas, perspectives, or questions about the architectural problem.
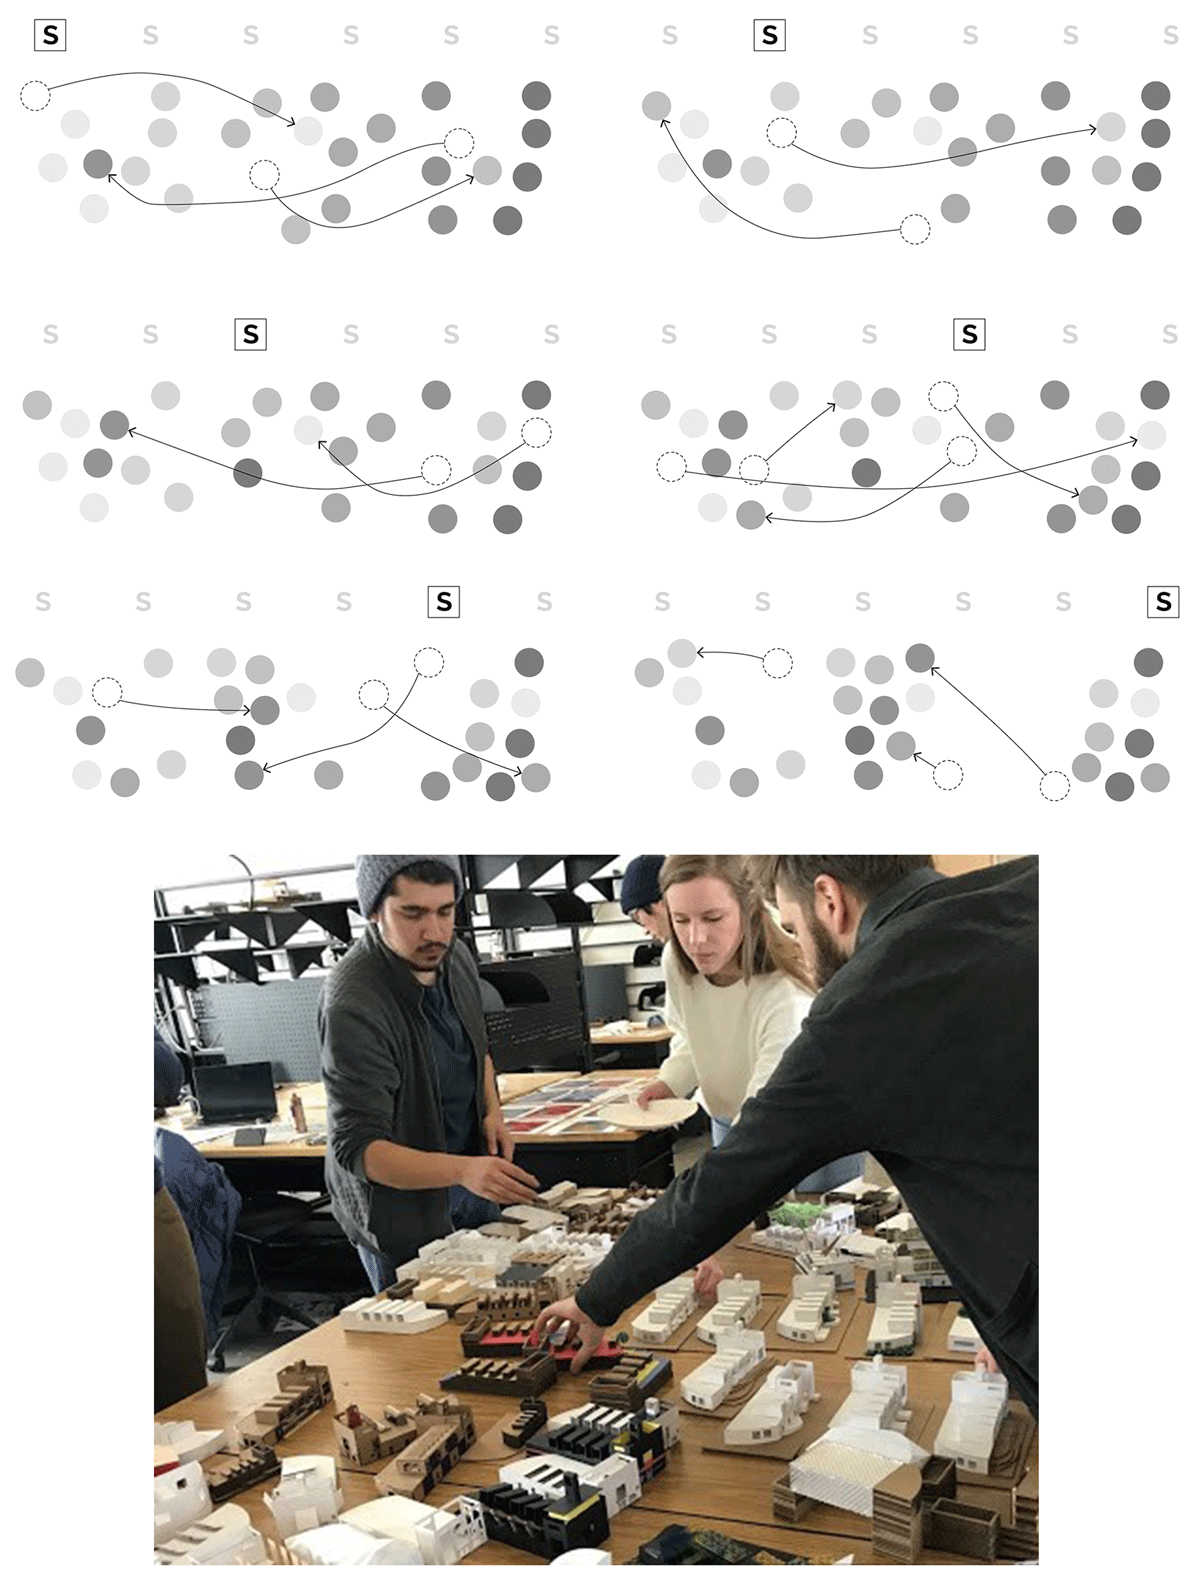
Figure 2
Step 2: Conflation.
Note: In this step, sets of artifacts contributed by individual students are discussed and provisionally combined into groups, based on the students’ collective assessment of the artifacts’ thematic affinity. Each student gets a turn to lead the discussion sharing their perspectives with the group, moving artifacts around to illustrate alternative groupings, readings, and generating potential design strategies for the studio to test. As a provisional step, conflation proceeds in an experimental and iterative manner: the students work collectively to test and discuss possible affinities among artifacts and future directions. Here, students (S) are shown to contribute various artifacts (circles). There is no expectation that all the artifacts produced by an individual student will ‘travel as a set’—instead, the artifacts produced by any one student may themselves be widely distributed across many different groups. Single artifacts may be determined to have thematic affinity with more than one group.
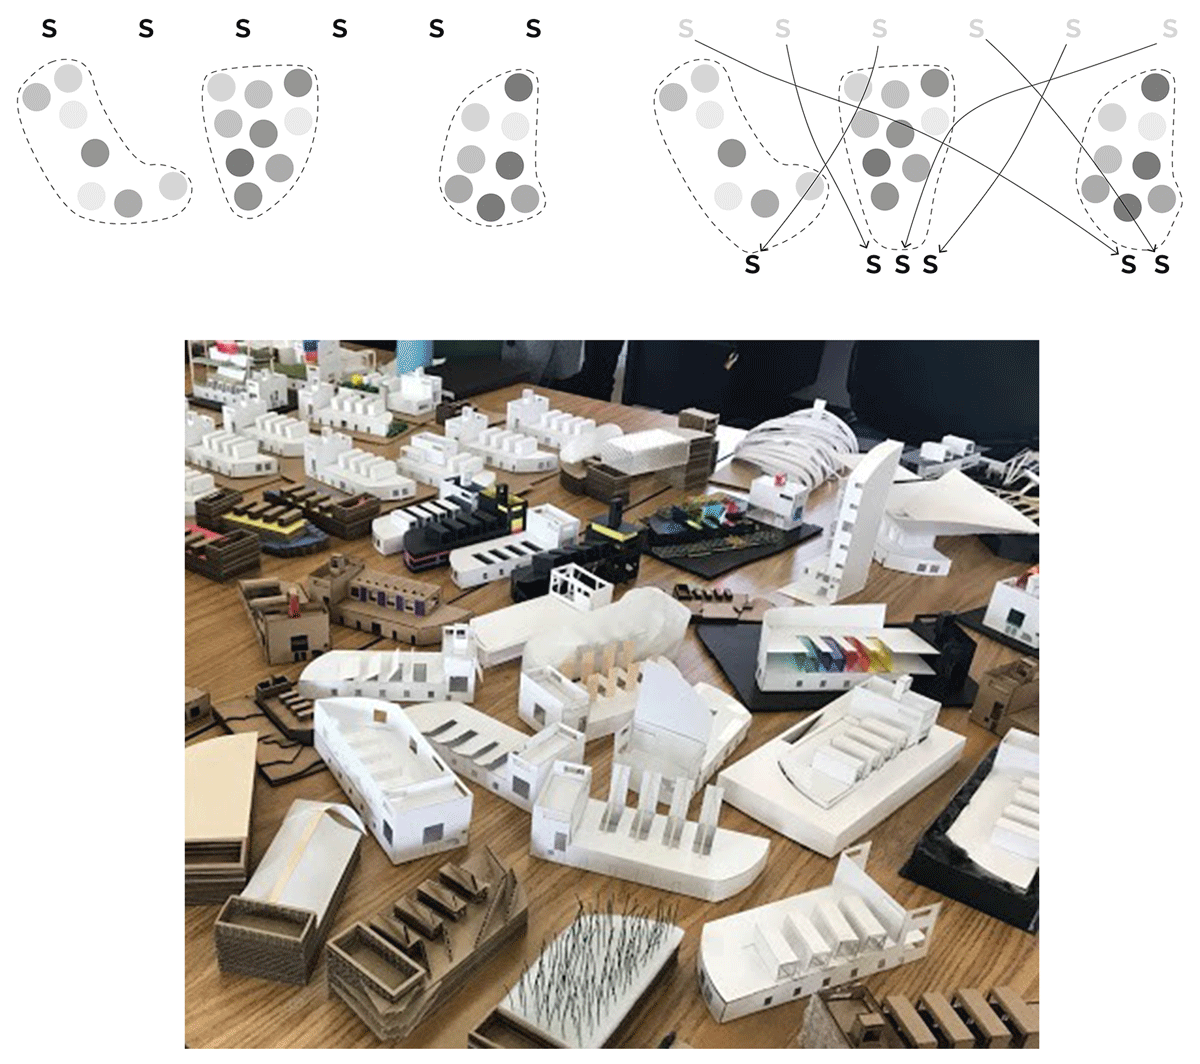
Figure 3
Step 3: Re-assignment of ownership.
Note: In this step, the testing of possible combinations is ended and the new groupings of artifacts are unambiguously defined and agreed upon. Through discussion, students (S) then develop a high level of transactive memory and assign themselves, based on self-identified strengths (skills they can contribute or teach) or deficits (skills they need to learn), to the responsibility of one or more groups of artifacts. The consequence of the re-assignment of ownership is that a student or group of students takes on responsibility for artifacts they did not themselves create, but for which they had agency in defining their thematic focus. In this way, students take on ownership of new combinations of ideas or questions that are understood to be embodied in the artifacts, learning from the perspective of their peers, while testing the thematic ideas through tools such as energy modeling in preparation for the next setting of the table where they can teach what they learned to the rest of the group.
Table 3
Comparisons of the student energy modeling result using the same baseline model and design iteration after several attempts to align the results by examining several design variables.
| Student code | First attempt to establish baseline energy models before cooperative peer-teaching and group work | Final effort to establish baseline energy models after cooperative peer-teaching and group work | ||||
|---|---|---|---|---|---|---|
| Sefaira area output, ft2 (m2) | Baseline site EUI = plug-in or web app, kBTU/ft²/yr(kWh/m2/yr) | Sefaira area output, ft2 (m2) | Baseline site EUI Sefaira plug in, kBTU/ft²/yr (kWh/m2/yr) | Baseline site EUI Sefaira web app, kBTU/ft²/yr (kWh/m2/yr) | Sketch-up versions used to input massing into Sefaira | |
| S1 | 4970 (461.7) | 60.2 (189.9) | 8429 (783) | 51 (160.9) | 51 (160.9) | Make—2017 |
| S2 | 4970 (461.7) | 57 (179.8) | 8429 (783) | 51 (160.9) | 49 (154.6) | Make—2017 |
| S3 | 10,653 (989.7) | 45 (142) | 8429 (783) | 51 (160.9) | 51 (160.9) | Make—2017 |
| S4 | 4970 (461.7) | 48 (151.4) | 8429 (783) | 51 (160.9) | 49 (154.6) | Make—2015 |
| S5 | 4971 (461.8) | 59 (186.1) | 8429 (783) | 51 (160.9) | 49 (154.6) | Make—2017 |
| S6 | 7670 (712.5) | 59 (186.1) | 8429 (783) | 51 (160.9) | 51 (160.9) | Make—2017 |
| S7 | 4970 (461.7) | 60 (189.3) | 8429 (783) | 51 (160.9) | 51 (160.9) | Make—2017 |
| S8 | 4970 (461.7) | 60 (189.3) | 8429 (783) | 51 (160.9) | 51 (160.9) | Pro—2018 |
| S9 | 4970 (461.7) | 60 (189.3) | 8429 (783) | 51 (160.9) | 49 (154.6) | Make—2017 |
| S10 | 4970 (461.7) | 60 (189.3) | 8429 (783) | 51 (160.9) | 48 (151.4) | Make—2017 |
| S11 | n.a. | n.a. | n.a. | n.a. | n.a. | n.a. |
| S12 | n.a. | n.a. | n.a. | n.a. | n.a. | n.a. |
[i] Note: EUI = energy-use intensity; n.a. = not available.
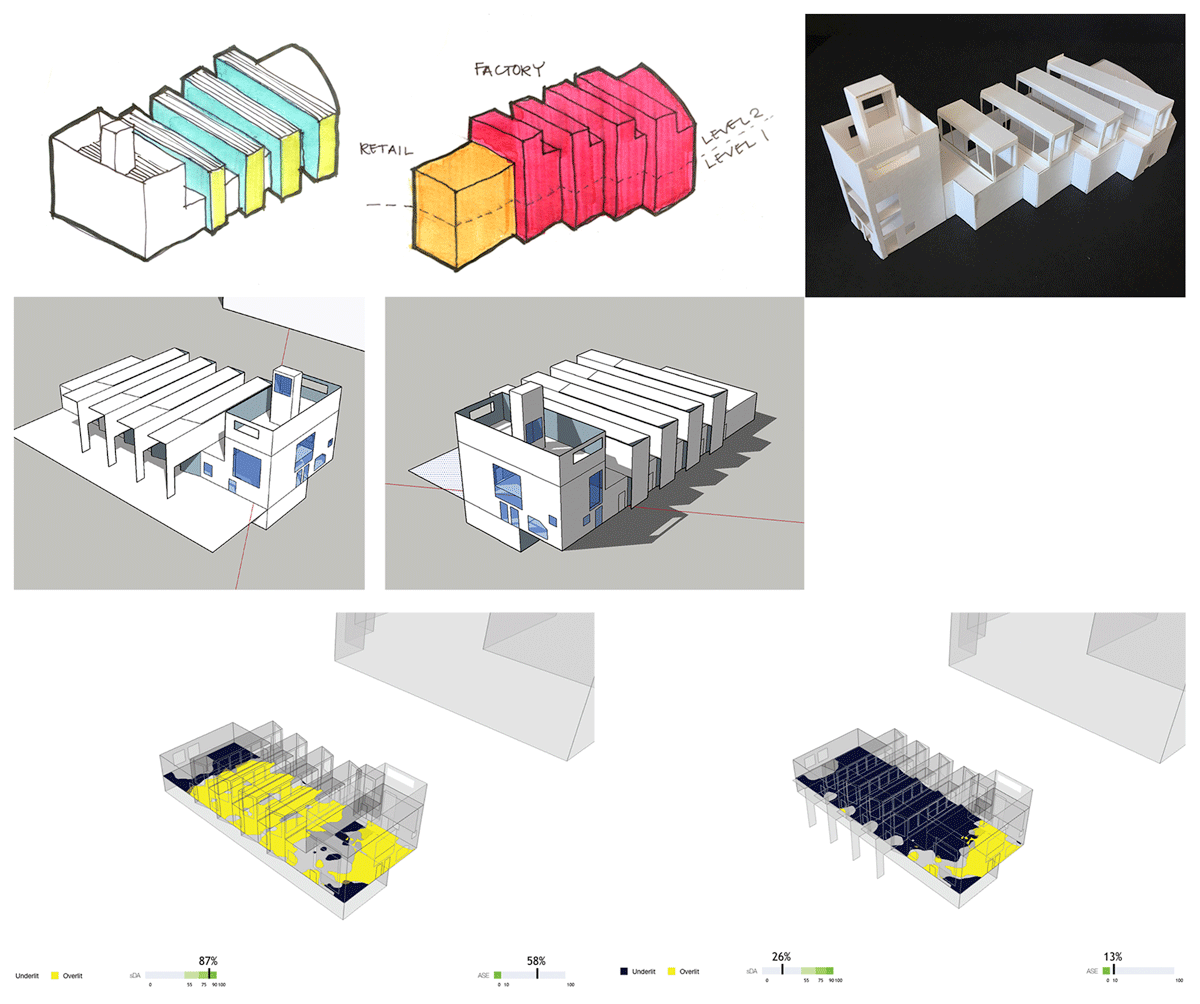
Figure 4
Cyclical process between ideation and testing.
Source: Drawings and models by Mackenzie Kusler.
Table 4
Comparisons of student energy modeling results, design and data cycle iterations to achieve Architecture 2030 targets (renewables for net-positive target).
| Student code | Weeks 2 and 3: passive strategies only | Weeks 4–6: passive strategies + R-values + HVAC systems | ||||||
|---|---|---|---|---|---|---|---|---|
| Iterations | Week 3 EUI range of iterations, kBTU/ft²/yr (kWh/m2/yr) | Iterations tried by student | Weeks 4–6 EUI range of iterations, kBTU/ft²/yr (kWh/m2/yr) | Final percentage reduction (%) | PV needed to achieve the 2030 target, ft2 (m2) | PV needed to achieve net positive, ft2 (m2) | Type of renewable energy researched, designed and estimated for the net-positive contribution | |
| S1 | 6 | 57–82 (179.8–258.7) | 18 | 54.0–24.5 (170.4–77.3) | 52% | n.c. | n.c. | Algae as fuel |
| S2 | 10 | 54–106 (170.4–334.4) | 24 | 36–11 (113.6–34.7) | 78% | None | 2834 (263.3) | Compost waste energy generation |
| S3 | 12 | 43–67 (135.7–211.4) | 49 | 71–27 (224.0–85.2) | 47% | 2794 (260) | 3999 (371.5) | PV |
| S4 | 9 | 39–70 (123.0–220.8) | 36 | 32–10 (101.0–31.5) | 80% | None | 1300 (120.8) | PV |
| S5 | 14 | 40–88 (126.2–277.6) | 35 | 44.0–13.5 (138.8–42.6) | 74% | None | 2860 (265.7) | Compost waste energy generation |
| S6 | 10 | 48–65 (151.4–2015.1) | 17 | 51–26 (160.9–82.0) | 49% | 1268 (117.8) | 3380 (314) | PV |
| S7 | 8 | 47–61 (148.3–192.4) | Several | 47–14 (148.3–44.2) | 72% | None | n.c. | PV |
| S8 | 7 | 50–65 (157.7–205.1) | 9 | 50.0–14.5 (157.7–45.7) | 71.5% | None | n.c. | PV |
| S9 | 4 | 45–60 (142.0–189.3) | 25 | 50–15 (157.7–47.3) | 70.5% | None | n.c. | Algae as fuel |
| S10 | 6 | 60–345 (1889.3–1088.4) | 19 | 47.0–11.5 (148.3–36.3) | 77% | None | 1725 (160.3) | Algae as fuel |
| S11 | n.a. | n.a. | n.a. | n.a. | n.a. | n.a. | n.a. | Compost waste energy generation |
| S12 | n.a. | n.a. | n.a. | n.a. | n.a. | n.a. | n.a. | PV |
[i] Note: EUI = energy-use intensity; HVAC = heating, ventilation and air-conditioning; n.a. = not available; n.c. = not calculated; PV = photovoltaics.
Table 5
Expansions to Loonen’s taxonomy for Climate Adaptive Building Shells (CABS).
| Loonen’s original categories based on primary function | Studio proposal 1: Power source that allows the adaptive envelope to respond to changing conditions | Studio proposal 2: Frequency of responsiveness of the adaptive envelope to changing conditions |
|---|---|---|
| Optical | Active power (renewable) | Continuous |
| Thermal | Active power (fossil fuel) | Seasonal |
| Airflow | Physical material properties for spontaneous response (e.g. composite laminates) | |
| Electrical | Human-powered (manual) |
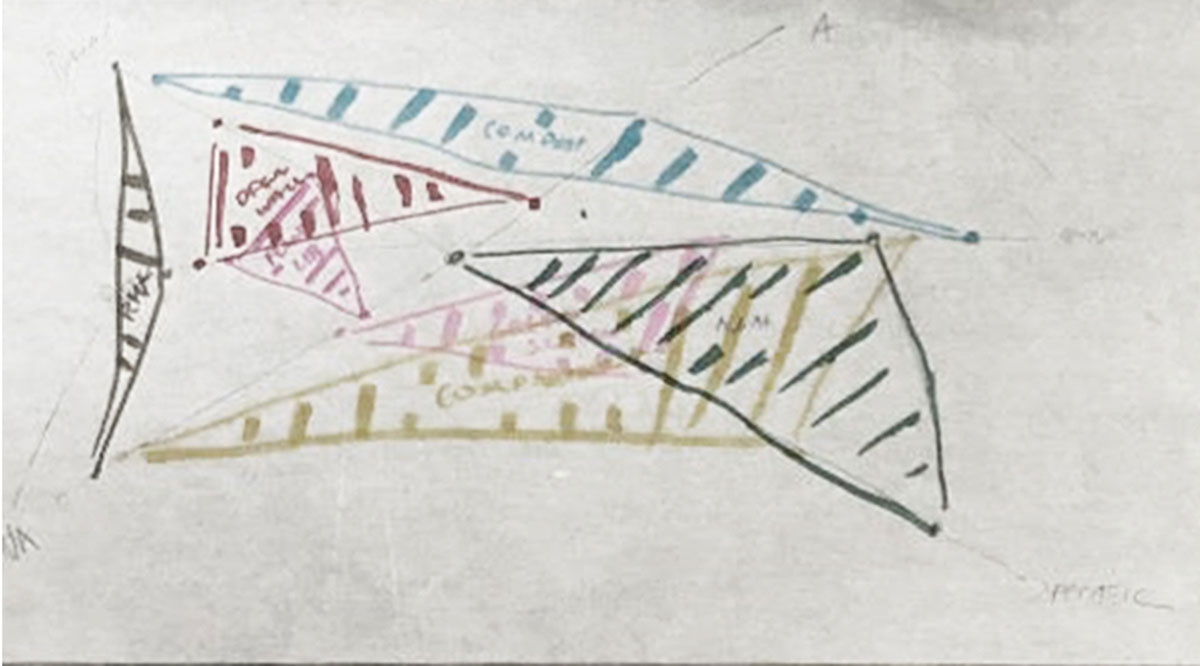
Figure 5
Practice review with spontaneous diagramming of thematic similarities and overlaps.
Source: Drawing by students in the Net Positive Studio.
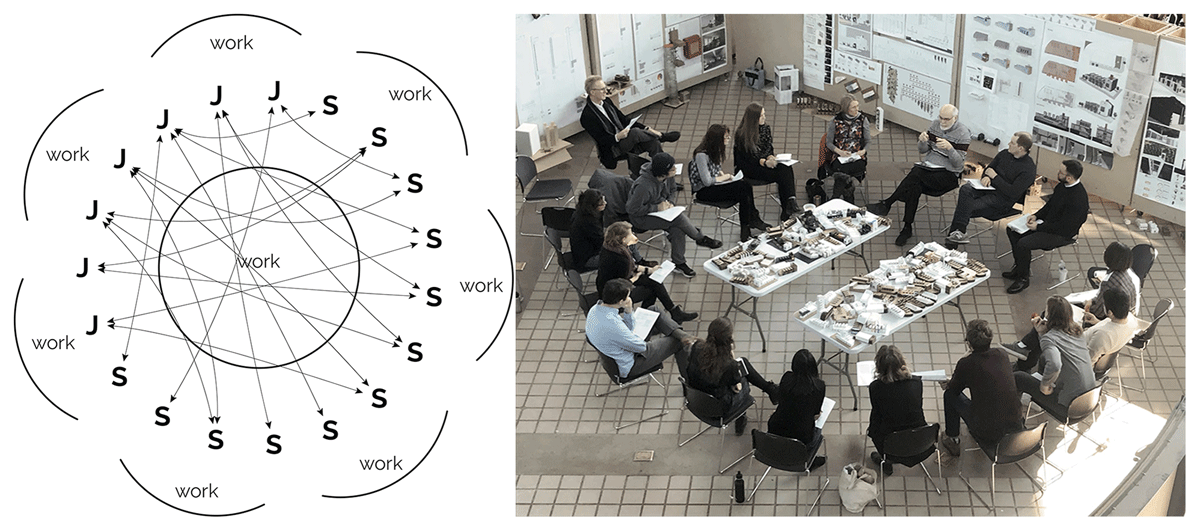
Figure 6
Discussion-based arrangement of the final review.
Note: J = jurors; S = students.
Source: Photo by Mike Christenson.