
Table 1
Descriptive statistics of the respondents and of the corresponding Finnish population.
| RESPONDENTS (N = 1448) | POPULATION IN FINLAND | |
|---|---|---|
| Age, average (years) | 52.7 | 49.4a |
| Household size, average | 2.4 | 2.4a |
| Gender (%) | ||
| Female | 53.3% | 51.1%a |
| Male | 46.7% | 48.9%a |
| Household gross income (€/month) | ||
| < €2,000 | 13.5% | – |
| €2,000–3,999 | 28.2% | – |
| €4,000–5,999 | 24.8% | – |
| €6,000–7,999 | 15.4% | – |
| €8,000–9,999 | 8.7% | – |
| > €10,000 | 6.1% | – |
| No response | 3.3% | – |
| Household gross income, average (€/month) | €4,920.0 | €4,309.1b |
| Education (%) | ||
| Primary, secondary (e.g. vocational degree) or other education | 55.6% | – |
| Higher education (university or applied sciences degree) | 44.4% | 33.0%c |
| Community type (urban–rural division) (%) | ||
| Town or city | 69.5% | 72.3%d |
| Sparsely populated area or small population centre | 29.9% | 27.7%d |
| Other or no response | 0.6% | – |
| Dwelling type (%) | ||
| Detached or semi-detached house | 51.2% | 47.8%e |
| Terraced house | 12.4% | 13.2%e |
| Apartment building | 34.9% | 37.7%e |
| Other or no response | 1.5% | 1.3%e |
[i] Note: aRandom sample (N = 10,000) obtained from the civil registry.
bDisposable mean income per household in Finland in 2021 (Official Statistics of Finland 2024).
cFinnish population of over 15-year-olds in 2021 (Official Statistics of Finland 2023a).
dGeographical information system (GIS)-based urban–rural classification for Finland and the Finnish population (Helminen et al. 2020).
eFinnish dwellings and housing conditions in 2021 (Official Statistics of Finland 2023b).
–, Unavailable national-level information.
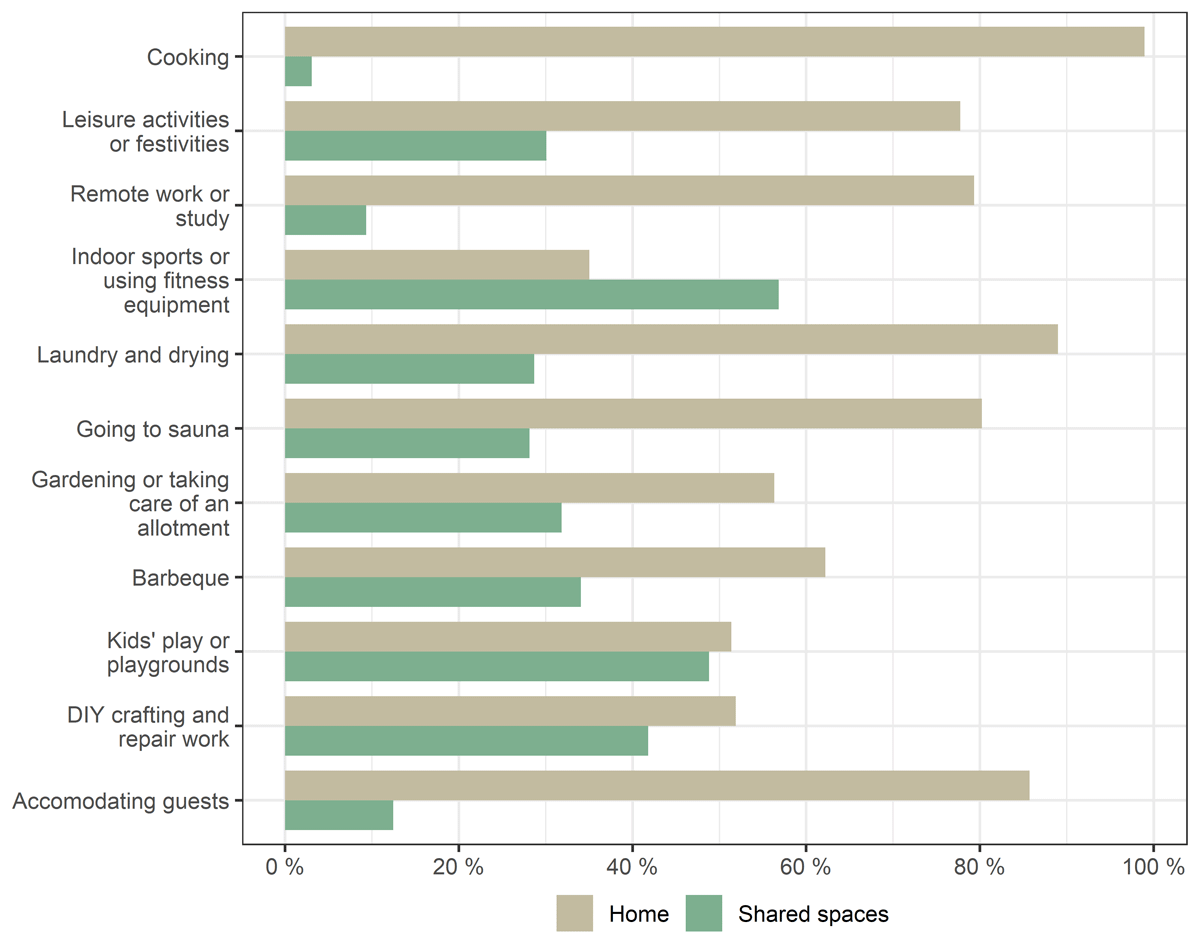
Figure 1
Response distribution to the question: ‘What activities do you think are important to be able to do in the home and what activities in common spaces of the housing association or neighbourhood? (N = 1436).
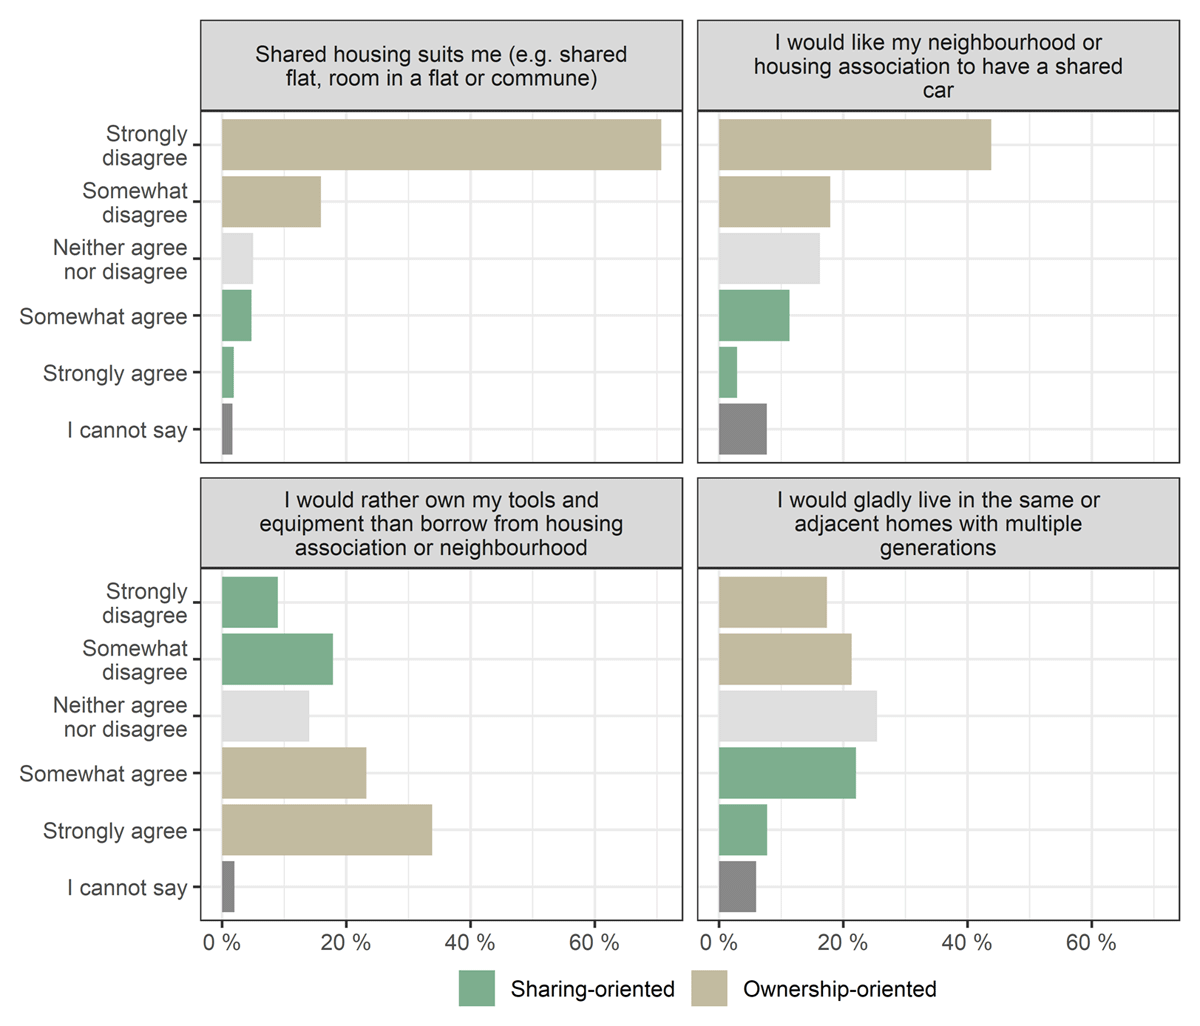
Figure 2
Response distribution of the four background statements concerning housing preferences.
Note: The colour-coding of responses reflects those in favour of sharing-oriented pro-environmental behaviour in contrast to ownership-oriented behaviour.
Table 2
Response distributions of two dependent variables.
| DEPENDENT VARIABLE IN THE NEGATIVE BINOMIAL MODEL: NUMERICAL COUNT OF SPACE-SHARING ACTIVITIES | FULL SAMPLE FREQUENCY (N = 1448) | FULL SAMPLE PROPORTION (%) (N = 1448) | FINAL SAMPLE FREQUENCY (N = 1409) | FINAL SAMPLE PROPORTION (%) (N = 1409) |
|---|---|---|---|---|
| 0 | 364 | 25% | 359 | 25% |
| 1 | 144 | 10% | 140 | 10% |
| 2 | 155 | 11% | 153 | 11% |
| 3 | 144 | 10% | 142 | 10% |
| 4 | 163 | 11% | 158 | 11% |
| 5 | 109 | 8% | 105 | 7% |
| 6 | 138 | 10% | 136 | 10% |
| 7 | 78 | 5% | 76 | 5% |
| 8 | 80 | 6% | 80 | 6% |
| 9 | 43 | 3% | 42 | 3% |
| 10 | 14 | 1% | 14 | 1% |
| 11 | 4 | 0% | 4 | 0% |
| DEPENDENT VARIABLE IN THE BINOMIAL PROBIT MODEL: WILLINGNESS FOR SPACE-SHARING ACTIVITIES | ||||
| 0 | 364 | 25% | 359 | 25% |
| 1 (if count of space-sharing activities ≥ 1) | 1,072 | 74% | 1,050 | 75% |
| Missing observations | 12 | 1% | 0 | 0% |
Table 3
Explanatory variable descriptions and descriptive statistics for the final sample (N = 1409).
| EXPLANATORY VARIABLES | DESCRIPTION | MEAN OR SHARE | SD |
|---|---|---|---|
| Socio-demographic characteristics | |||
| Age | Respondent’s age | 52.7850 | 17.3678 |
| Female (1 if yes) | Respondent is female | 0.5351 | |
| High education (1 if yes) | Respondent has an applied sciences or university degree | 0.4471 | |
| City-like (1 if yes) | Respondent lives in a city or urban residential area | 0.6962 | |
| Home characteristics | |||
| Floor area/hhsize | Floor area (m2) per inhabitant in the respondent’s home | 52.0547 | 32.5505 |
| Rental (1 if yes) | Respondent lives in a rental dwelling | 0.2186 | |
| Detached house (1 if yes) | Respondent lives in a detached or semi-detached house | 0.5117 | |
| Attitudes and habits | |||
| CChuman (1 if yes) | Respondent believes that the climate is changing due to human activity only or for the most part | 0.7204 | |
| Uses car (1 if yes) | Respondent drives a petrol or diesel car at least weekly | 0.7842 | |
| Eats meat (1 if yes) | Respondent eats red meat as the main meal at least weekly | 0.6636 | |
Table 4
Results of the binomial probit and negative binomial regression models.
| VARIABLE | BINOMIAL PROBIT | NEGATIVE BINOMIAL | ||||||||
|---|---|---|---|---|---|---|---|---|---|---|
| COEFFICIENT | SE | T-RATIO | P-VALUE | COEFFICIENT | SE | T-RATIO | P-VALUE | |||
| Constant | 0.9249 | *** | 0.2381 | 3.8839 | 0.0001 | 1.2411 | *** | 0.1416 | 8.7635 | 0.0000 |
| Age | –0.0027 | 0.0026 | –1.0338 | 0.3012 | –0.0021 | 0.0016 | –1.3406 | 0.1800 | ||
| High education | 0.0305 | 0.0814 | 0.3748 | 0.7078 | 0.0186 | 0.0490 | 0.3791 | 0.7046 | ||
| Female | 0.0888 | 0.0773 | 1.1492 | 0.2505 | 0.1041 | ** | 0.0472 | 2.2050 | 0.0275 | |
| City-like | 0.3517 | *** | 0.0873 | 4.0306 | 0.0001 | 0.2995 | *** | 0.0616 | 4.8610 | 0.0000 |
| Floor area/hhsize | –0.0010 | 0.0012 | –0.8135 | 0.4159 | –0.0015 | * | 0.0009 | –1.7035 | 0.0885 | |
| Rental | 0.2662 | ** | 0.1290 | 2.0640 | 0.0390 | 0.0917 | 0.0658 | 1.3945 | 0.1632 | |
| Detached house | –0.4470 | *** | 0.0967 | –4.6206 | 0.0000 | –0.3591 | *** | 0.0598 | –6.0025 | 0.0000 |
| CChuman | 0.2337 | *** | 0.0846 | 2.7633 | 0.0057 | 0.2522 | *** | 0.0547 | 4.6066 | 0.0000 |
| Uses car | –0.3175 | *** | 0.1142 | –2.7795 | 0.0054 | –0.2112 | *** | 0.0606 | –3.4854 | 0.0005 |
| Eats meat | –0.0527 | 0.0869 | –0.6066 | 0.5441 | –0.1250 | ** | 0.0501 | –2.4922 | 0.0127 | |
| Alpha | 1.7859 | *** | 0.1739 | 10.2717 | 0.0000 | |||||
| Model characteristics | ||||||||||
| LL | –713.33 | –3,111.66 | ||||||||
| LL(0) | –799.66 | –3,468.85 | ||||||||
| McFadden pseudo-R2 | 0.11 | 0.10 | ||||||||
| AIC/N | 1.028 | 4.43 | ||||||||
| Respondents (N) | 1,409 | 1,409 | ||||||||
| Parameters (K) | 11 | 12 | ||||||||
[i] Note: AIC = Akaike information criterion; LL = log-likelihood.
Significance at the *0.1, **0.05 and ***0.01 levels.