
Table 1
Different stages of retrofit, based on LETI (2021)
| TASK | RETROFITTING PROJECT TASK | DESCRIPTION OF ACTIVITIES |
|---|---|---|
| 1 | Defining project and outcomes | Writing any funding application, preparing a business case, setting the retrofit outcomes and developing a plan of work |
| 2 | Understanding the building and risks | Preparatory work to assess the condition of the target buildings, including surveying, checking risks (e.g. flood, fire safety) and setting up prespecified performance indicators |
| 3 | Design work | Includes listing and evaluating improvement options, producing a detailed design for each project phase, and developing material lists necessary to complete subsequent retrofit tasks |
| 4 | Determining sources of technology and material supply | Procurement of technology, products and services |
| 5 | Physical installation, quality check and remedial work | Installing planned retrofit measures (e.g. heating, insulation, draught proofing, glazing) on site. This might also include remedial work to repair any damage prior to installation |
| 6 | Commissioning and handover to residents | Transition from any on-site construction work to the occupants (social housing tenants). New technologies and systems are set up and explained to occupants |
| 7 | Monitoring performance in use | A trial period to evaluate whether the installed measures meet the expected performance |
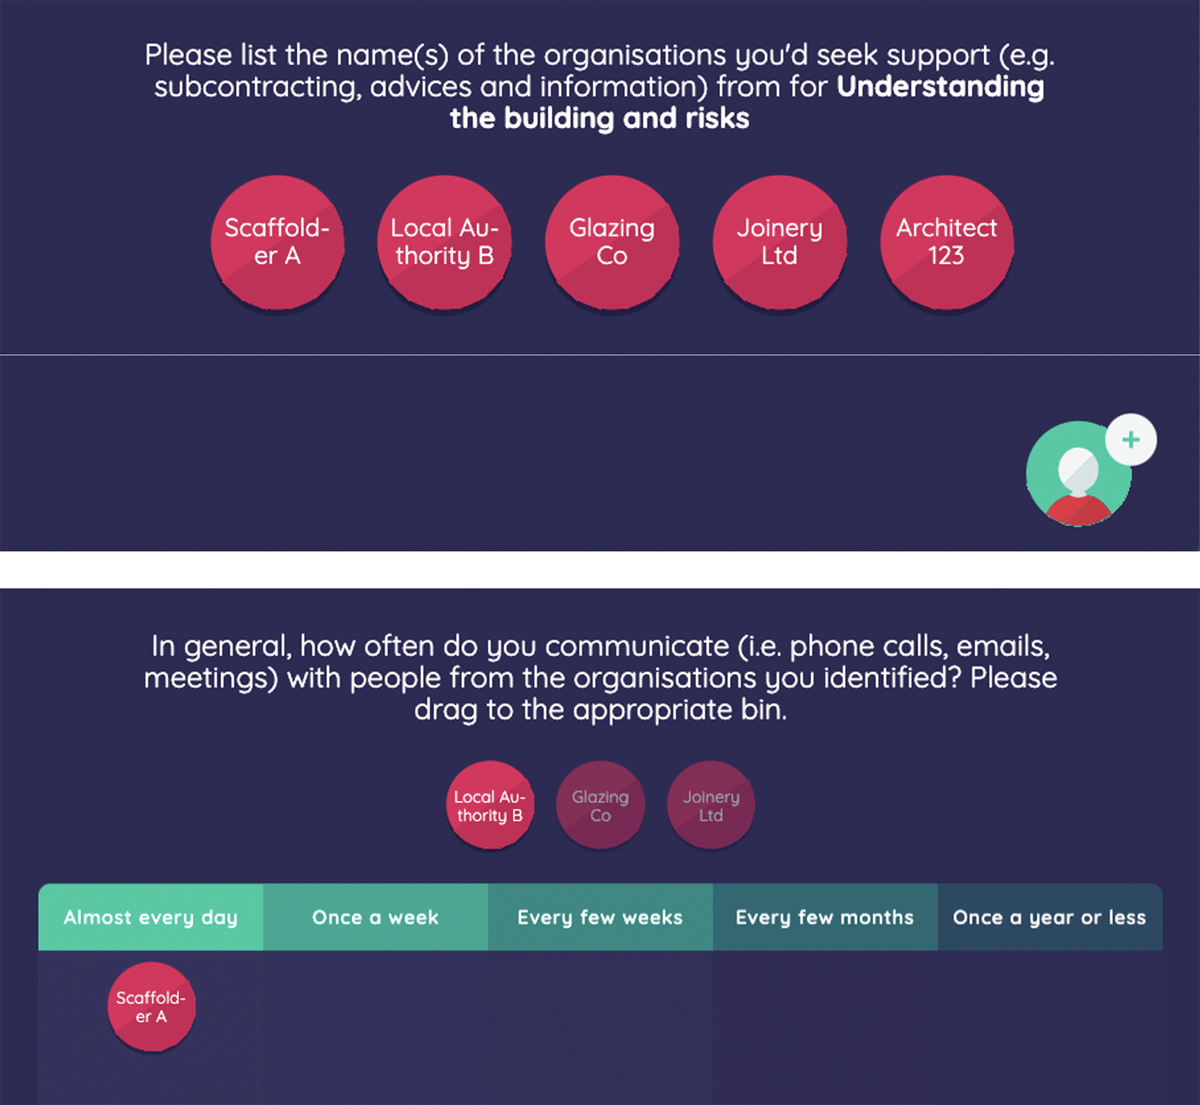
Figure 1
Screenshot of the survey questions in Network Canvas, using fictional data. Participants ‘dragged and dropped’ nominated organisations into columns indicating communication frequency.
Table 2
Summary of the social network analysis (SNA) metrics adopted and their implications for this study (Marsden 2002; Scott 2012)
| SNA METRIC | DEFINITION | IMPLICATION FOR THIS STUDY | FORMULA | RESULT |
|---|---|---|---|---|
| Node-level metrics | ||||
| In-degree centrality | Number of incoming links received by a node | Degree of support needed by an organisation to complete retrofit tasks | where IDC(Ni) is in-degree centrality of node i; and counts the number of direct ties that node has received from the g–1 other nodes (i ≠ j) excludes i is relation to itself | Range = 0–X, where 0 = no incoming links; and X = number of incoming links from the others |
| Closeness centrality | Minimum number of connections until the arrival of a piece of information through/from an actor | An organisation with higher closeness centrality indicates a faster access to a piece of retrofit task-related information | where Cc(Ni) is the closeness centrality for node i; and computes the sum of geodesic distances between node i and each of the g–1 other nodes | Range = 0–X, where 0 = disconnected; and X = reverse value of the sum of the shortest path between one node to each of the other nodes. The higher is X, the faster the transmission of information |
| Network-level metrics | ||||
| Network density | Total number of ties in a network relative to the number of potential ties—overall connectedness | A cohesive structure indicates a higher number of communication links per actor, and information and knowledge tend to be disseminated more quickly (Pryke et al.2018) | where L is the number of existing links; and is the maximum number of ties possible among the number of existing nodes | Range = 0–1, where 0 = no one is connected to anyone else; 1 = everyone is connected to everyone else |

Figure 2
Whole-house retrofitting network.
Note: Each organisation is represented by a numbered node (shape); all organisations, their characteristics and centrality scores are listed in Appendix D in the supplemental data online. Node shape and colour indicate the size and service scale of the organisation, respectively; node size indicates how well the organisation is connected. Ties (connections shown in grey) indicate the frequency and direction of communication; a single-headed arrow indicates that the recipient named the originator as important, but not vice versa (or the originator did not complete the survey; see Appendix D online); and a double-headed arrow indicates that both parties named each other as important.
Node shape = organisation size
 Micro (1–9 employees)
 Small (10–49 employees)
 Medium (50–249 employees)
 Large (250+ employees)
Node colour = organisation service scale
 Local
Local
 National
 International
Node size: The extent to which one organisation bridges otherwise unconnected others.
Tie characteristics: The wider the tie, the more frequent the communication. The arrow illustrates the direction of communications.
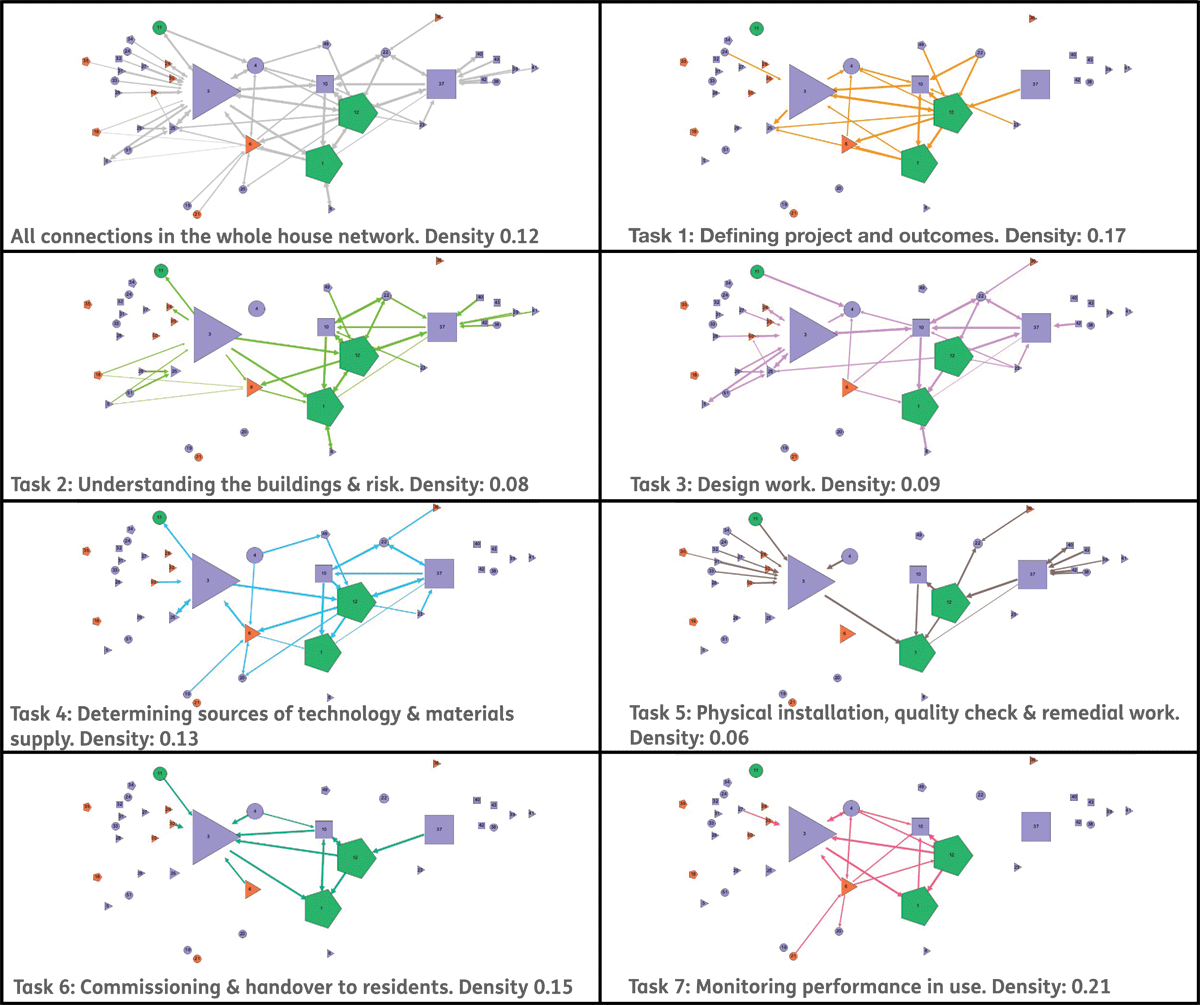
Figure 3
Sequence of communication for the whole-house network.
Note: The top left diagram illustrates all communication links in the network; the subsequent diagrams illustrate communication links for each retrofitting task, in turn. Density scores are calculated for the network involved in each task. See Figure 2 for the legend.