
1. Introduction
The majority of existing buildings in the UK require energy retrofitting to meet greenhouse gas emission reduction targets (CCC 2019). Retrofitting includes improving the building fabric and implementing low carbon technologies. Retrofitting supply chains are shaped by the PAS2035 standard,1 which requires a whole-house approach that treats the building as a system of different interacting elements (Topouzi et al. 2019). PAS2035 was implemented to overcome problems created by previously fragmented supply chains, including poor teamwork across design and construction processes (Swan et al. 2018), and inconsistent knowledge of energy performance across trades (Simpson et al. 2020).
Greater collaboration within supply chains is often called for to deliver sustainable buildings (e.g. Schröpfer et al. 2017), and there are indications of critical points of interaction for energy retrofitting. A review of whole-house retrofitting activities under the Retrofit for the Future programme indicated problems emerging from the design, installation or commissioning of technical systems (Gupta et al. 2015), but does not specifically address communication for overcoming this. McElroy & Rosenow (2018) identified incorrect installation as a problem in whole-house retrofit; they suggest that design and construction are particularly important, but do not elaborate on how organisations might collaborate during these stages. For whole-house retrofit, Topouzi et al. (2019: 1350) suggest that:
poor communication between designers, users and installers at design and in-use stage can lead to inappropriate choices of technology, installation failures or on-site problem solving disconnected from other […] design and usability principles.
Despite this, communication patterns across the whole-house retrofitting process have not been formally documented; this could be crucial for understanding the nature of collaboration and potential points for improvement.
This paper, therefore, develops and tests a social network analysis (SNA) approach for analysing communication in retrofitting supply chains. The literature review introduces SNA and its existing application to construction supply chains. The SNA method developed here is then detailed before preliminary results are presented. The discussion and conclusions reflect on the use of SNA for understanding retrofit supply chains, and make suggestions for how the technique can be developed.
2. What insights might be gained by mapping supply chains?
SNA maps the actors and social ties that form a network (Borgatti et al. 2022). Whilst surveys and interviews with construction team members offer an insight into project dynamics, they do not allow for evaluating overall ‘global’ patterns of communication (Herrera et al. 2020). As Pryke (2004: 792) notes:
organisations are suspended in multiple, complex, overlapping webs of relationships and we are unlikely to see the overall pattern from the point of view of one organisation.
Although not previously applied to retrofitting, SNA has been used to understand the coordination of different actors in construction projects (Pryke et al. 2018). Here, the technique has shown how documenting the characteristics of the network, and the position of actors within it, can provide an insight into communication patterns and how they might influence project success.
First, overall network structure can be an important indicator of collaboration and knowledge transfer. Network density is a measure of connectedness amongst all organisations in a network. This metric has been used by af Hällström et al. (2021) to compare interaction intensity among organisations in two distinct construction projects. They found that dispersed network structure (low density) resulted in arm’s-length relationships and conflict. However, the analysts applied quantitative metrics to qualitative interview data to build the network, which may lead to the misinterpretation of relationship strength. Using an online survey, Herrera et al. (2020) identified low network density amongst the design team on a high-rise building project, suggesting this meant that some members had limited knowledge about the roles across the network and learning opportunities were restricted, although this only focused on one stage of the work. Low network density can limit the transfer of complex and tacit knowledge (Reagans & McEvily 2003), although Schröpfer et al. (2017) find that strong ties within low-density networks can facilitate the transfer of tacit knowledge. These authors consider five distinct projects, but use random sampling to survey workers during a single site visit, which may have missed key participants.
Second, the position of individual organisations within a network might shape collaboration potential (Loosemore et al. 2020); the key SNA metric for measuring this is centrality. In-degree centrality, or the number of incoming links received by an actor, has been used to explore knowledge transfer by identifying who is perceived by others in the network to be knowledgeable (Schröpfer et al. 2017). Herrera et al. (2020) look at the range of in-degree centrality across their design team network, and suggest that a wide range of in-degree values indicates an inconsistent flow of information with a focus on particular groups (the project manager and architect, in this case). This is not necessarily problematic if, for example, the project manager is coordinating communication amongst subcontractors. Closeness centrality, a measure of the minimum number of connections needed to arrive at a piece of information, is useful for evaluating this. Closeness centrality provides an indication of communication efficiency and accuracy (Loosemore et al. 2020), with a higher value indicating faster access to information. Loosemore et al. (2020) use interviews with construction project managers to suggest that, for success, the project manager should remain socially ‘close’ to leaders at all stages, but this has not been studied through quantitative network analysis.
Thus, SNA might be useful for evaluating how overall network structure and the position of individual organisations can shape communication throughout a construction project. However, the technique has not yet been applied to understand communication through the different stages of a retrofit project. The following section outlines an SNA approach for this.
3. A method for mapping retrofit supply chains
3.1 Data collection
SNA is used here to study the network of organisations delivering whole-house retrofit in a single case study city’s social housing.2 Here, the local authority works closely with an arm’s-length management organisation (ALMO),3 which acts as a managing agent for the local authority-owned housing stock. The local authority secures funding for energy retrofit projects and the ALMO oversees project delivery. The local authority and ALMO have pursued both over time (measures are added piece by piece in different phases) and one-off (multiple measures added instantaneously) strategies for whole-house approaches to social housing retrofit. In this case, the one-off strategy has been supported by off-site manufacture and also includes an energy performance contracting agreement.
The first phase of data collection used semi-structured interviews with eight key stakeholders to gather understandings of the retrofitting projects underway. Interviewees were identified through initial project contacts (for details, see Appendix A in the supplemental data online); the interviews were recorded and transcribed verbatim. The interviews informed the development of a commonly used tool for collecting social network data: a survey (see Appendix B online) (Wasserman & Faust 2009). The social housing retrofit network in the case study city was relatively well-established, with participants noting that projects often ran concurrently and teams overlapped. For this reason, participants were asked to name organisations with which they worked, rather than individuals. To protect commercial sensitivities, participants preferred to discuss the supply chain in general terms, rather than for a specific case study (this is distinct to many SNA studies; for a review, see Herrera et al. 2020). This led to supply chains for both one-off and over-time approaches being discussed together. However, all participants worked on whole-house social housing retrofit in the case study city. The supply chain was taken to include organisations engaged in planning, execution and problem-solving during a retrofitting project (Killip et al. 2020); they include tradespeople, technology suppliers, architects, coordinating organisations, the local authority and the ALMO.
Survey participants were identified through snowball sampling (Illenberger & Flötteröd 2012), commencing from three initial contacts (known as seeds; all members of the group initially interviewed). The snowball approach allowed for the identification of contractors involved throughout different retrofitting stages, rather than those available at the time of a site visit. The survey asked participants to identify organisations with which they worked (known as a name generation survey; Burt et al. 2012; Schröpfer et al. 2017) for specific retrofitting tasks (defined in Table 1). The retrofitting tasks were determined using industry guidance (LETI 2021), although some categories were updated to align with participants’ own terminology. Nominated organisations (ties) were then approached to complete the survey; this was repeated until few new nominees were identified (Scott 2012). Ties were defined as interactions where ‘ideas, goods or information’ (Borgatti et al. 2022) are exchanged in the delivery of a particular task. These interactions could be both formal (e.g. contracts) and informal (e.g. phone call). The survey was written in Network Canvas and administered via Microsoft Teams (Birkett et al. 2021) (Figure 1).
Table 1
Different stages of retrofit, based on LETI (2021)
| TASK | RETROFITTING PROJECT TASK | DESCRIPTION OF ACTIVITIES |
|---|---|---|
| 1 | Defining project and outcomes | Writing any funding application, preparing a business case, setting the retrofit outcomes and developing a plan of work |
| 2 | Understanding the building and risks | Preparatory work to assess the condition of the target buildings, including surveying, checking risks (e.g. flood, fire safety) and setting up prespecified performance indicators |
| 3 | Design work | Includes listing and evaluating improvement options, producing a detailed design for each project phase, and developing material lists necessary to complete subsequent retrofit tasks |
| 4 | Determining sources of technology and material supply | Procurement of technology, products and services |
| 5 | Physical installation, quality check and remedial work | Installing planned retrofit measures (e.g. heating, insulation, draught proofing, glazing) on site. This might also include remedial work to repair any damage prior to installation |
| 6 | Commissioning and handover to residents | Transition from any on-site construction work to the occupants (social housing tenants). New technologies and systems are set up and explained to occupants |
| 7 | Monitoring performance in use | A trial period to evaluate whether the installed measures meet the expected performance |
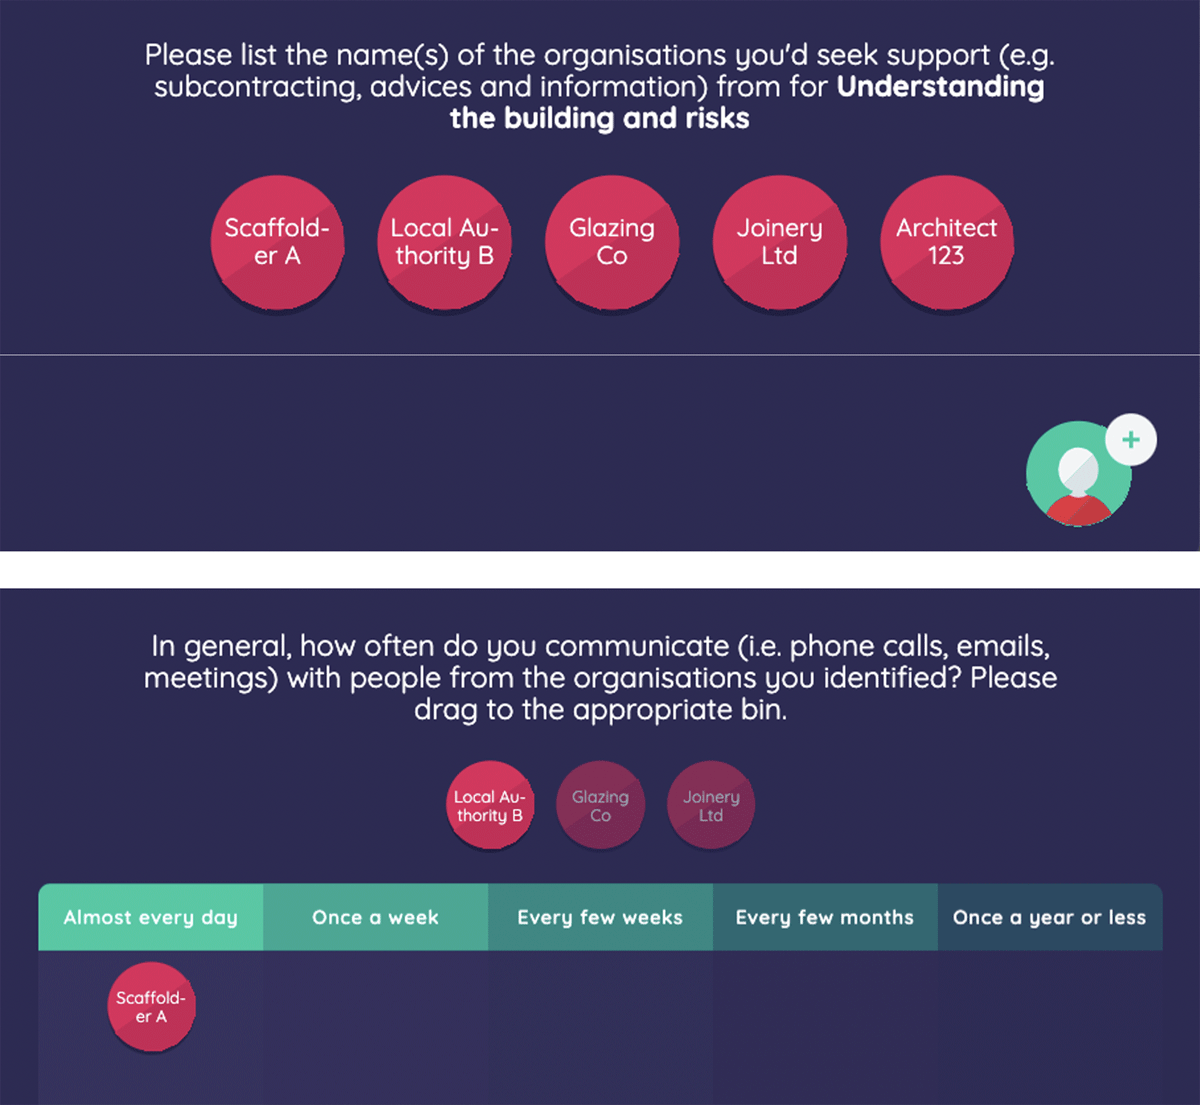
Figure 1
Screenshot of the survey questions in Network Canvas, using fictional data. Participants ‘dragged and dropped’ nominated organisations into columns indicating communication frequency.
Data collection was reliant on participants nominating others. Participants were asked to seek permission from nominees before sharing contact details with the research team. Not all nominated organisations completed the survey, despite several reminders. This is common in SNA, but since they have been nominated by others, non-respondents were still regarded as part of the network (Borgatti & Molina 2005). If someone declined, basic organisational characteristics were gathered via an online search and they were included in the overall network map (Appendix D in the supplemental data online includes all organisations and whether they completed the survey).
3.2 Data analysis
Data collection identified 45 organisations (nodes) and 184 connections between them (ties). Seven industry bodies were removed as they do not specifically work on the projects in the case study city, leaving 38 nodes and 169 ties for analysis. Connections between pairs of nodes were documented in an Edgelist (see the supplemental data online), before Gephi 0.9 and the ForceAtlas 2 algorithm were used to visualise the network with highly connected nodes at the centre (Figure 2). Overall communication patterns were explored using network-level metrics (network density), whilst the roles of individual organisations were evaluated using node-level metrics (in-degree and closeness centrality). Overall centrality scores for all organisations are included in Appendix D in the supplemental data online, and centrality scores for each task are in Appendix E online. Table 2 provides the formulae for calculating these SNA metrics, alongside their implications in this study.
Table 2
Summary of the social network analysis (SNA) metrics adopted and their implications for this study (Marsden 2002; Scott 2012)
| SNA METRIC | DEFINITION | IMPLICATION FOR THIS STUDY | FORMULA | RESULT |
|---|---|---|---|---|
| Node-level metrics | ||||
| In-degree centrality | Number of incoming links received by a node | Degree of support needed by an organisation to complete retrofit tasks | where IDC(Ni) is in-degree centrality of node i; and counts the number of direct ties that node has received from the g–1 other nodes (i ≠ j) excludes i is relation to itself | Range = 0–X, where 0 = no incoming links; and X = number of incoming links from the others |
| Closeness centrality | Minimum number of connections until the arrival of a piece of information through/from an actor | An organisation with higher closeness centrality indicates a faster access to a piece of retrofit task-related information | where Cc(Ni) is the closeness centrality for node i; and computes the sum of geodesic distances between node i and each of the g–1 other nodes | Range = 0–X, where 0 = disconnected; and X = reverse value of the sum of the shortest path between one node to each of the other nodes. The higher is X, the faster the transmission of information |
| Network-level metrics | ||||
| Network density | Total number of ties in a network relative to the number of potential ties—overall connectedness | A cohesive structure indicates a higher number of communication links per actor, and information and knowledge tend to be disseminated more quickly (Pryke et al.2018) | where L is the number of existing links; and is the maximum number of ties possible among the number of existing nodes | Range = 0–1, where 0 = no one is connected to anyone else; 1 = everyone is connected to everyone else |

Figure 2
Whole-house retrofitting network.
Note: Each organisation is represented by a numbered node (shape); all organisations, their characteristics and centrality scores are listed in Appendix D in the supplemental data online. Node shape and colour indicate the size and service scale of the organisation, respectively; node size indicates how well the organisation is connected. Ties (connections shown in grey) indicate the frequency and direction of communication; a single-headed arrow indicates that the recipient named the originator as important, but not vice versa (or the originator did not complete the survey; see Appendix D online); and a double-headed arrow indicates that both parties named each other as important.
Node shape = organisation size
 Micro (1–9 employees)
 Small (10–49 employees)
 Medium (50–249 employees)
 Large (250+ employees)
Node colour = organisation service scale
 Local
Local
 National
 International
Node size: The extent to which one organisation bridges otherwise unconnected others.
Tie characteristics: The wider the tie, the more frequent the communication. The arrow illustrates the direction of communications.
4. Preliminary results
4.1 Overview of the whole house retrofitting network
The SNA identified 38 organisations involved in whole-house retrofitting projects in the case study city (Figure 2). Over half the organisations identified did not complete the survey (see Appendix D in the supplemental data online), but these non-respondents have been included in the map (see Section 3.1). Most non-respondents were micro- and small peripheral contractors. Reasons for declining included time scarcity, a reluctance to share business-sensitive information and contractors feeling they were not part of a relevant project despite being nominated. The lack of the ability to engage these groups represents a significant limitation of the approach used here, and is discussed in Section 5.1.
The network created from the available data exhibits low overall connectivity with a density score of 0.12 (density scores between 0.4 and 0.7 have been identified amongst construction worksite teams; Priven & Sacks 2015). This could be indicative of slower transmission of information, or information sharing primarily within clustered groups, although this is not necessarily problematic. The social housing sector has complex governance structures (Cauvain et al. 2018) and can adopt a variety of retrofitting business models (Tingey et al. 2021) and public procurement approaches (Palmer et al. 2018). Here, the SNA indicates that project leaders are ‘socially close’, with a strong tie (thicker tie width) between the local authority (1) and ALMO (12).4 The quantitative method does not consider the governance structures that may underpin this, but during preliminary interviews a local authority officer referred to the ALMO as ‘part of the council […] it’s just that they are a separate department’. The interviewee explained that the council oversees the finance and reporting requirements, whilst the ALMO manages the procurement and contracting.
Discussing the supply chain network in general terms helped to mitigate concerns about commercial sensitivity and acknowledged that the same contractors will often work on multiple social housing projects (Palmer et al. 2018). However, this has also resulted in supply chains for two distinct approaches (over time and one-off) being mapped together in Figure 2, which makes it difficult to draw definitive conclusions about the supply chains for each approach. Organisations working on over time and one-off are clustered around (37) and (3), respectively. (37) is a private sector company that provides engineering, procurement and contracting services and follows an over-time strategy, whilst (3) is a private, medium-sized national organisation which coordinates a one-off retrofitting strategy with performance contracting. The organisations are both perceived by others to be knowledgeable, with in-degree centrality scores of 36 and 15 for (3) and (37), respectively. There are 11 organisations connected only to (3) and six connected only to (37). This indicates that (3) and (37) introduce contractors who otherwise would not be part of the network. However, the range of in-degree centrality scores across all organisations in the network is between zero and 36, with many peripheral subcontractors having no inward connections. This indicates uneven knowledge transfer across the network as a whole, but does not capture how communication might vary through the different retrofitting stages. This is addressed in the following section.
4.2 With whom organisations communicate to perform different retrofitting tasks
The time frame of this study did not coincide with the delivery of a specific retrofit project; participants were asked to complete the survey only once and reflect on their general communication frequency. This section, therefore, explores in broad terms how the connections between organisations might vary throughout the different stages retrofit (Figure 3).
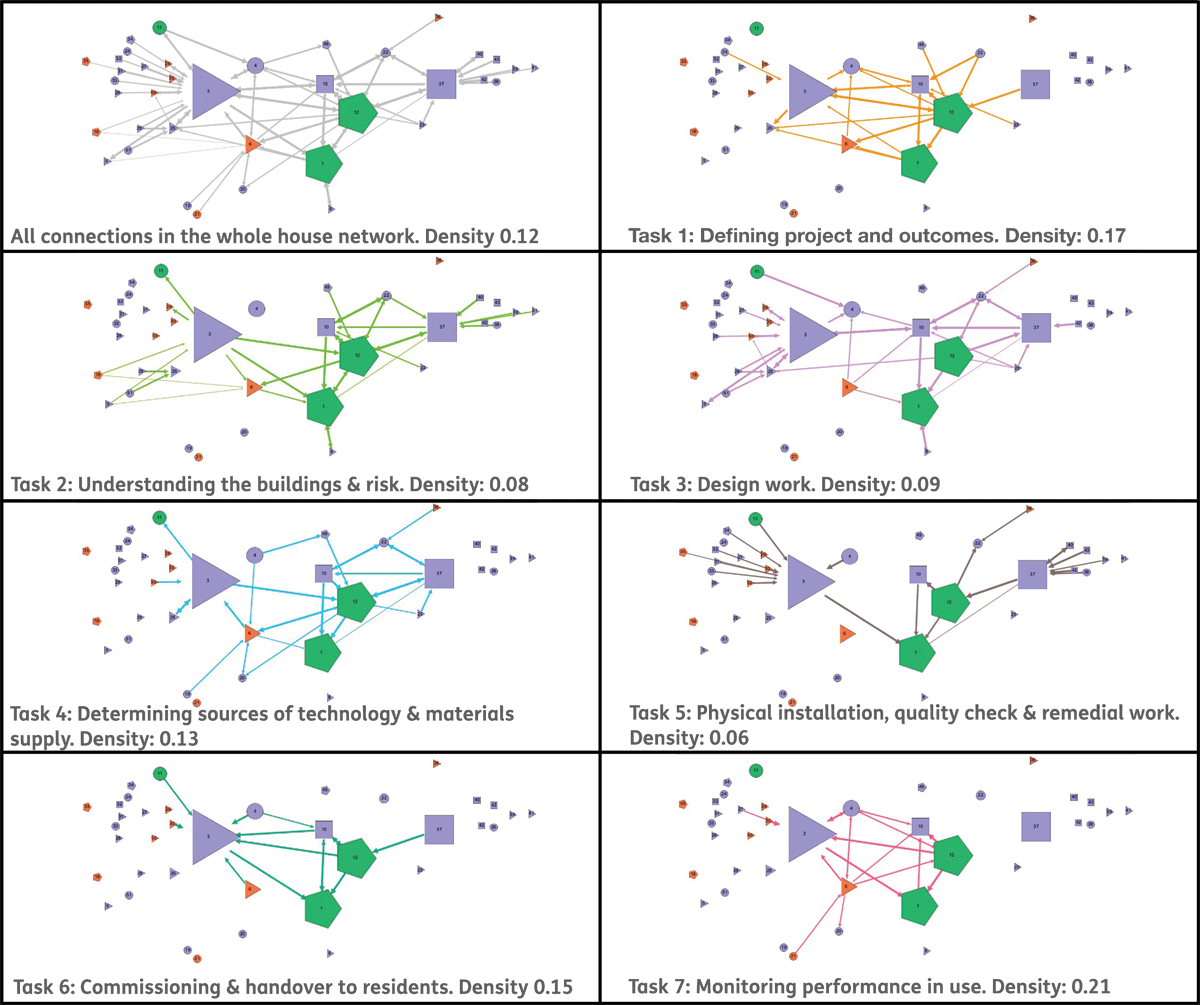
Figure 3
Sequence of communication for the whole-house network.
Note: The top left diagram illustrates all communication links in the network; the subsequent diagrams illustrate communication links for each retrofitting task, in turn. Density scores are calculated for the network involved in each task. See Figure 2 for the legend.
Defining project and outcomes (task 1) has one of the highest density scores (0.17) and is primarily carried out through coordination between the local authority, ALMO and tier-one contractors. This is in keeping with established public procurement models whereby local authorities, ALMOs, and a small number of contracted organisations plan and coordinate the works. These organisations have strong ties (thick connecting lines) indicating frequent communication and potentially supporting the transfer of complex information.
Understanding the buildings and risk (task 2) and design work (task 3) have lower density networks with scores of 0.08 and 0.09, respectively. These stages include involvement from a wider range of organisations, with subcontractors included where relevant, but there are weaker ties between them. However, the local authority, ALMO and tier-one contractors have particularly high in-degree centrality in these stages (with scores between 6 and 10). This indicates that these organisations are perceived by others in the network to hold important information for completing the task.
In contrast, peripheral organisations dominate physical installation, quality check and remedial work (task 5). The two tier-one contractors (37) and (3) have the highest closeness scores for the physical installation stage with 0.71 and 1, respectively. This indicates that they have fast access to retrofitting information from peripheral contractors. However, this task also has the lowest density score with 0.06, and the highest range of in-degree scores, with an in-degree centrality of 9 for organisation (3), but zero for 14 of the peripheral contractors involved in the task. This wide range could indicate inconsistent information transfer, and the thin lines connecting organisations could indicate infrequent communication. However, many of the peripheral contractors were also non-respondents so it is difficult to evaluate their involvement.
Commissioning and handover (task 6) and monitoring performance in use (task 7) are both higher density activities, with scores of 0.15 and 0.21, respectively. There are fewer organisations involved in these stages and thicker lines connecting coordinating organisations, indicating frequent communication. There is no involvement from (37) in monitoring performance. This is not necessarily problematic: in this case, the local authority noted they have the ‘largest energy services department of any council’ including those involved in monitoring performance (organisation (1) interview), meaning there is no need to outsource this work for more traditional over-time approaches. However, organisation (3) is heavily involved in the process. This reflects the blurring of two networks, with (3) working to a performance contract whilst (37) does not. Organisations (6) and (4) are specifically involved in monitoring work under a performance contract; these organisations have a high closeness centrality during this stage (0.86 and 0.75, respectively), indicating efficient access to information.
5. Discussion
5.1 Preliminary insights
In keeping with established governance structures for social housing retrofit (Genovese et al. 2013), the local authority, ALMO and tier-one contractors were key actors, central to all retrofitting stages. They were particularly dominant during the project definition, commissioning and monitoring performance-in-use stages. Here, higher density and frequent communication are supportive of the transfer of complex and tacit information amongst these actors. In addition, the presence of these project managers throughout the whole retrofitting process likely ‘plays an important role in developing common project language […] to bind various stages together’ (Loosemore et al. 2020: 1071), and coordinating different subcontractors.
However, this could also be a risk, since overall network connectivity is dependent on how effective these actors are (Scott 2017). The quantitative approach used here does not provide insight into the specific content of the interactions. However, there was a large range of in-degree centrality for the different actors in the network, indicating uneven communication between the central coordinating organisations and more peripheral contractors involved in design, determining sources of technology and physical installation. Specifically for physical installation, tier-one contractors had high closeness centrality, indicating fast access to information from relevant subcontractors. However, subcontractors tended to have an in-degree centrality of zero, and weaker ties (thinner connecting lines), indicating infrequent communication and less transfer of complex, tacit information. Further, subcontractors tend to be connected only to the tier-one contractors (3) or (37), but not to one another. This could be an artefact of the sampling and non-responses (see Section 4.1), but could also indicate a lack of communication. It is not necessary for all contractors to speak with all other contractors, but arguably, some communication between peripheral contractors whose work intersects (e.g. heating and insulation installers) could help in the development of shared understandings amongst distinct but interrelated professions (see Killip et al. 2014 for a discussion of how shared tasks and close working can help in a multi-skilled retrofit team).
Limitations in the approach used here mean that these findings can only be taken as tentative. It is unclear, for example, whether PAS2035 and the whole-house approach studied here address problems of supply chain fragmentation. The network maps appear to show lack of involvement from subcontractors in the design and planning stages, and more limited communication at the physical installation stage, suggesting the potential continuation of problems caused through fragmentation (Gupta et al. 2015; McElroy & Rosenow 2018). However, the quantitative data here do not convey the content of interactions at different stages, or the multiple roles that could be played by individuals within the same organisation (e.g. in-house design teams). The blurring of different approaches also makes it difficult to assess whether over time or one-off is more or less suited to overcoming fragmentation. The following section reflects on developing the approach, and the use of SNA more broadly, for generating further insights into retrofitting supply chains.
5.2 Reflections on SNA as a method for mapping retrofit supply chains
SNA has been useful here for exploring how communication patterns amongst all organisations change over the course of a retrofitting project. However, an entirely quantitative approach to SNA has also been criticised for creating an ‘abstract, formal and structural mapping’ of social life (Loosemore et al. 2020: 1062, citing Crossley 2010). A specific challenge is the ambiguity in the interpretation of quantitative metrics, e.g. frequent communication and close interactions can be useful for the transfer of tacit knowledge (Schröpfer et al. 2017), but might also indicate conflict (Loosemore 1998). In addition, SNA metrics alone do not provide detail on the nature of a communication exchange. Future SNA of communication in retrofitting supply chains might therefore be strengthened through exploring the type of information exchanged (Schröpfer et al. 2017), and incorporating interviews as the project is unfolding (Pirzadeh & Lingard 2017). Additionally, mapping the network does not provide any indication of which communication patterns work well and which do not; for this, future SNA of communication networks could be supplemented with the evaluation of project success (e.g. did the retrofitting project achieve anticipated energy savings and run to time and budget?).
Further, with non-participation being common in SNA (Borgatti & Molina 2005), it is difficult to evaluate the accuracy of the network maps developed. Snowball sampling can be an effective route to accessing participants, but it also means that the recruitment is influenced by the respondents themselves (Illenberger & Flötteröd 2012), whilst measures such as closeness centrality can be skewed by participants nominating those they are highly connected to (Borgatti et al. 2022). An alternative approach is random sampling, e.g. through handing out surveys on site visits (Schröpfer et al. 2017). However, this may miss those who are not physically on site at the time of survey distribution. Further, the analysis here has grouped organisations, rather than focusing on the relationships between individuals. It may be that individuals from a single firm play quite different roles in the retrofitting process; this could be captured through surveying multiple people within larger firms and taking project roles rather than organisations as the unit of analysis (af Hällström et al. 2021). The triangulation of data collected through, for example, qualitative interviewing, contractual information and network surveys could also mitigate concerns with participation.
The exclusion of small- and medium-sized enterprises (SMEs) is potentially troublesome for future SNA of the retrofitting sector. Whilst SNA can capture the larger organisations involved in social housing retrofit, the approach used here is unlikely to be suitable for studying private sector retrofit which is dominated by SMEs operating in the repair, maintenance and improvement sector (Killip et al. 2021). Much work in the private sector takes place on a measure-by-measure basis, with separate tradespeople performing different tasks over time, and varied routes to project management and subcontracting (Maby & Owen 2015). Private sector SNA might therefore initiate via local trade merchants, which offer a physical site at which to survey tradespeople (Wade et al. 2016), or via geographically co-located householders who have applied for government retrofitting grants (Owen et al. 2023).
6. Conclusions
This first application of social network analysis (SNA) to retrofitting supply chains has shown that the method can provide an insight into how communication patterns change across the different stages of a project. The preliminary findings indicate socially close project leaders, with the local authority and arm’s-length management organisation (ALMO) working closely with tier-one contractors at key decision-making stages including project definition, understanding the building and design work. Tier-one contractors are socially close to subcontractors during physical install, indicating fast access to information, but the ties are weaker, which could mean it is harder to share complex, tacit information. Testing the approach here illustrated how the data collection strategy can have significant impacts on the research outcomes, and that the quantitative metrics developed through SNA are subject to interpretation. Future work could develop further understanding of how network structure influences retrofitting success by focusing on a single retrofitting project and incorporating detail on the types of information exchanged and evaluation of project outcomes.
Supplemental data
Supplemental data for this article can be accessed at: https://doi.org/10.5334/bc.448.s1
Notes
[2] Social network data can be more difficult to anonymise than other forms of data. Research subjects can be potentially identified through a combination of attributes (Borgatti & Molina 2005). In this case, the connection between organisations could carry commercial sensitivities, and organisations could be easily identifiable if the case study location were named (Kotsios et al. 2019). Consequently, each organisation is identified by a number (see Appendix D in the supplemental data online) and the case study location is not named.
[3] ALMO’s are a separate legal entity from the controlling local authority and are run on a not-for-profit basis. They are paid to deliver services such as repair and maintenance on behalf of the local authority; see https://www.gov.uk/hmrc-internal-manuals/business-income-manual/bim58210/.
Acknowledgements
The authors thank the anonymous reviewers who took a lot of time and care to provide insightful and helpful comments throughout the review process; they helped to strengthen the paper. The authors also thank the participants who completed interviews and surveys.
Competing interests
The authors have no competing interests to declare.
Data accessibility
All cleaned, anonymised data used in this analysis are detailed in the supplemental data online.
Ethical approval
All participation was voluntary and informed consent was confirmed prior to the survey commencing (see Appendix C in the supplemental data online). Ethics approval was granted by the University of Edinburgh.
Funding
This work was supported by UK Research and Innovation through a grant to the Centre for Research on Energy Demand Solutions (grant number EP/R035288/1).
Author contributions
FW led the project, drafting and editing of the paper. YH undertook research design, data collection and analysis, and contributed to drafting and editing the paper.