
Table 1
Summary of the variables and data sources
| VARIABLE | ABBREVIATION | SOURCE/REFERENCE | YEAR(S) |
|---|---|---|---|
| Mental health outcomes | |||
| Small Area Mental Health Index (SAMHI) | SAMHI | PLDR (Daras & Barr 2020) | 2015 |
| Depression prevalence | Dep. prev. | PLDR (Daras et al. 2023) | 2015 |
| Depression prevalence change, 2011–19 (%) | Δ Dep. 2011–19 | PLDR (Daras et al. 2023) | 2011, 2019 |
| Depression prevalence change, 2019–22 (%) | Δ Dep. 2019–22 | PLDR (Daras et al. 2023) | 2019, 2022 |
| Housing characteristics | |||
| % Homes with an EPC rating ≥ C | % Homes ≥ C | EPCs (DLUHC 2023) | 2008–23 |
| Median EPC rating | Median EPC | EPCs (DLUHC 2023) | 2008–23 |
| Mode of EPC band | Mode EPC | EPCs (DLUHC2023) | 2008–23 |
| Median floor area (m2) | Floor area | EPCs (DLUHC 2023) | 2008–23 |
| % Homes built pre-1950 | % Homes pre-1950 | EPCs (DLUHC 2023) | 2008–23 |
| % Flats, maisonettes or apartments | % Flats | EPCs (DLUHC 2023) | 2008–23 |
| % Social or private rented | % Rented | EPCs (DLUHC 2023) | 2008–23 |
| Demographics | |||
| Income deprivation score | Inc. score | National Statistics (MHCLG 2015) | 2015 |
| Education deprivation score | Edu. score | National Statistics (MHCLG 2015) | 2015 |
| Mean household size (n) | HH size | Census (ONS 2013) | 2011 |
| % Population age ≥ 65 | % Age ≥ 65 | ONS (2015) | 2015 |
| % Population female | % Female | ONS (2015) | 2015 |
| Environmental factors | |||
| Air pollution (PM10) (μg/m3) | PM10 | AHAH v2 (Daras et al. 2019) | 2017 |
| Distance to nearest active green space (km) | Green space | AHAH v2 (Daras et al. 2019) | 2017 |
| Average winter temperature (°C) | Winter temp. | HadUK (Met Office 2023) | 1990–2020 |
[i] Note: AHAH v2 = Access to Healthy Assets & Hazards v2; EPC = Energy Performance Certificate; PLDR = Place-based Longitudinal Data Resource.
Table 2
Descriptive statistics for continuous variables for N = 31,802 lower layer super output areas (LSOAs) in England
| VARIABLE AT LSOA LEVEL | MEAN | SD | MINIMUM | 25% PERCENTILE | 50% PERCENTILE | 75% PERCENTILE | MAXIMUM |
|---|---|---|---|---|---|---|---|
| Mental health outcomes | |||||||
| SAMHI (2015) | –0.02 | 0.91 | –2.03 | –0.66 | –0.18 | 0.47 | 6.45 |
| Dep. prev. (%) (2015) | 7.4 | 2.2 | 1.0 | 5.9 | 7.3 | 8.8 | 17.4 |
| Δ Dep. 2011–19 (%) | –0.3 | 3.3 | –16.1 | –2.4 | –0.4 | 1.6 | 22.0 |
| Δ Dep. 2019–22 (%) | 2.0 | 1.2 | –11.7 | 1.3 | 1.8 | 2.6 | 13.8 |
| Housing characteristics | |||||||
| % Homes ≥ C | 39% | 16% | 1% | 28% | 38% | 50% | 100% |
| Median EPC | 65.7 | 4.9 | 41 | 63 | 66 | 68 | 87 |
| Floor area (m2) | 80.5 | 14.1 | 31 | 71 | 79 | 88 | 160 |
| % Homes pre-1950 | 38% | 27% | 0% | 15% | 35% | 57% | 100% |
| % Flats | 20% | 23% | 0% | 4% | 11% | 27% | 100% |
| % Rented | 37% | 20% | 2% | 20% | 33% | 51% | 98% |
| Demographics | |||||||
| Income score | 0.15 | 0.10 | 0.01 | 0.07 | 0.11 | 0.20 | 0.64 |
| Education score | 0.12 | 0.08 | 0.00 | 0.06 | 0.10 | 0.16 | 0.58 |
| Household size (n) | 2.3 | 0.3 | 1.1 | 2.1 | 2.2 | 2.4 | 4.8 |
| % Age ≥ 65 | 18% | 8% | 0% | 12% | 18% | 24% | 61% |
| % Female | 51% | 2% | 15% | 50% | 51% | 52% | 65% |
| Environmental factors | |||||||
| PM10 (μg/m3) | 13.5 | 2.2 | 7.5 | 11.4 | 13.8 | 15.2 | 17.5 |
| Green space (km) | 0.59 | 0.58 | 0.04 | 0.32 | 0.46 | 0.67 | 33.1 |
| Winter temp. (°C) | 5.1 | 0.6 | 1.6 | 4.6 | 5.0 | 5.5 | 8.5 |
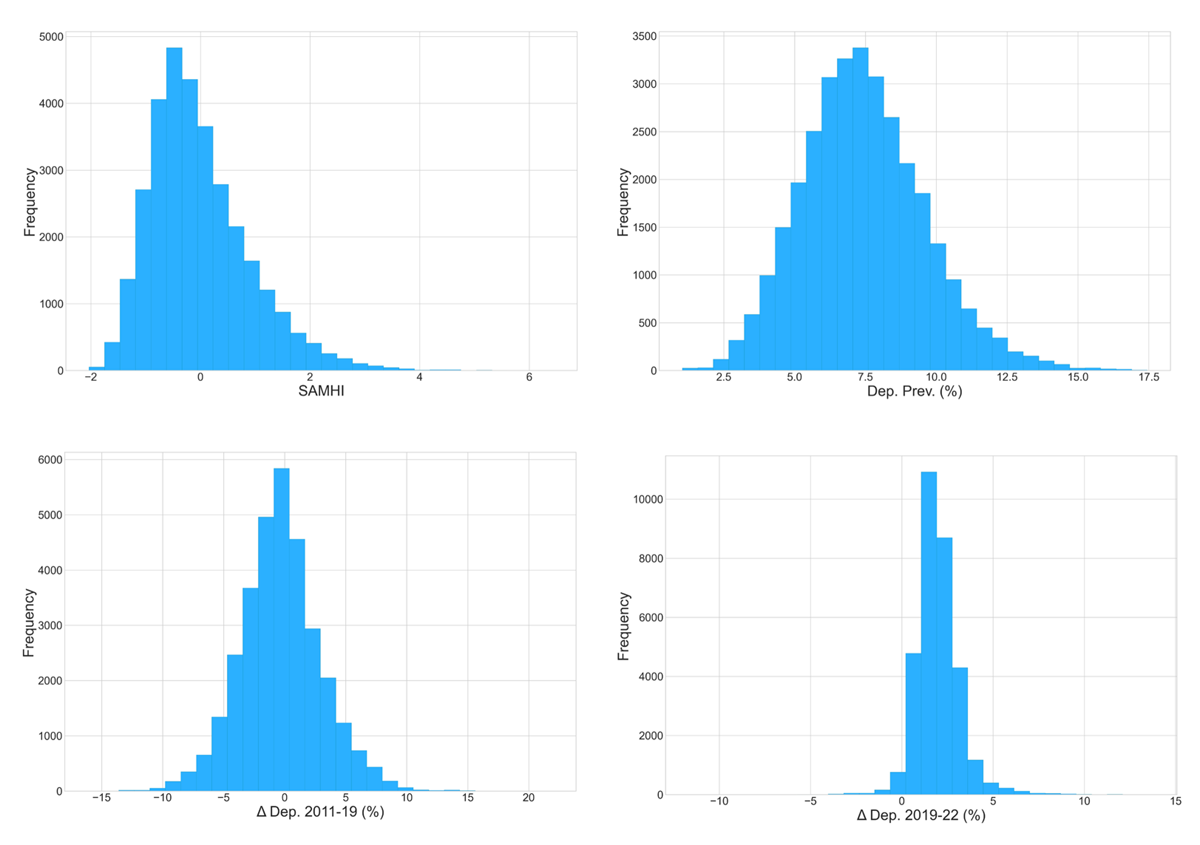
Figure 1
Mental health outcome variables.
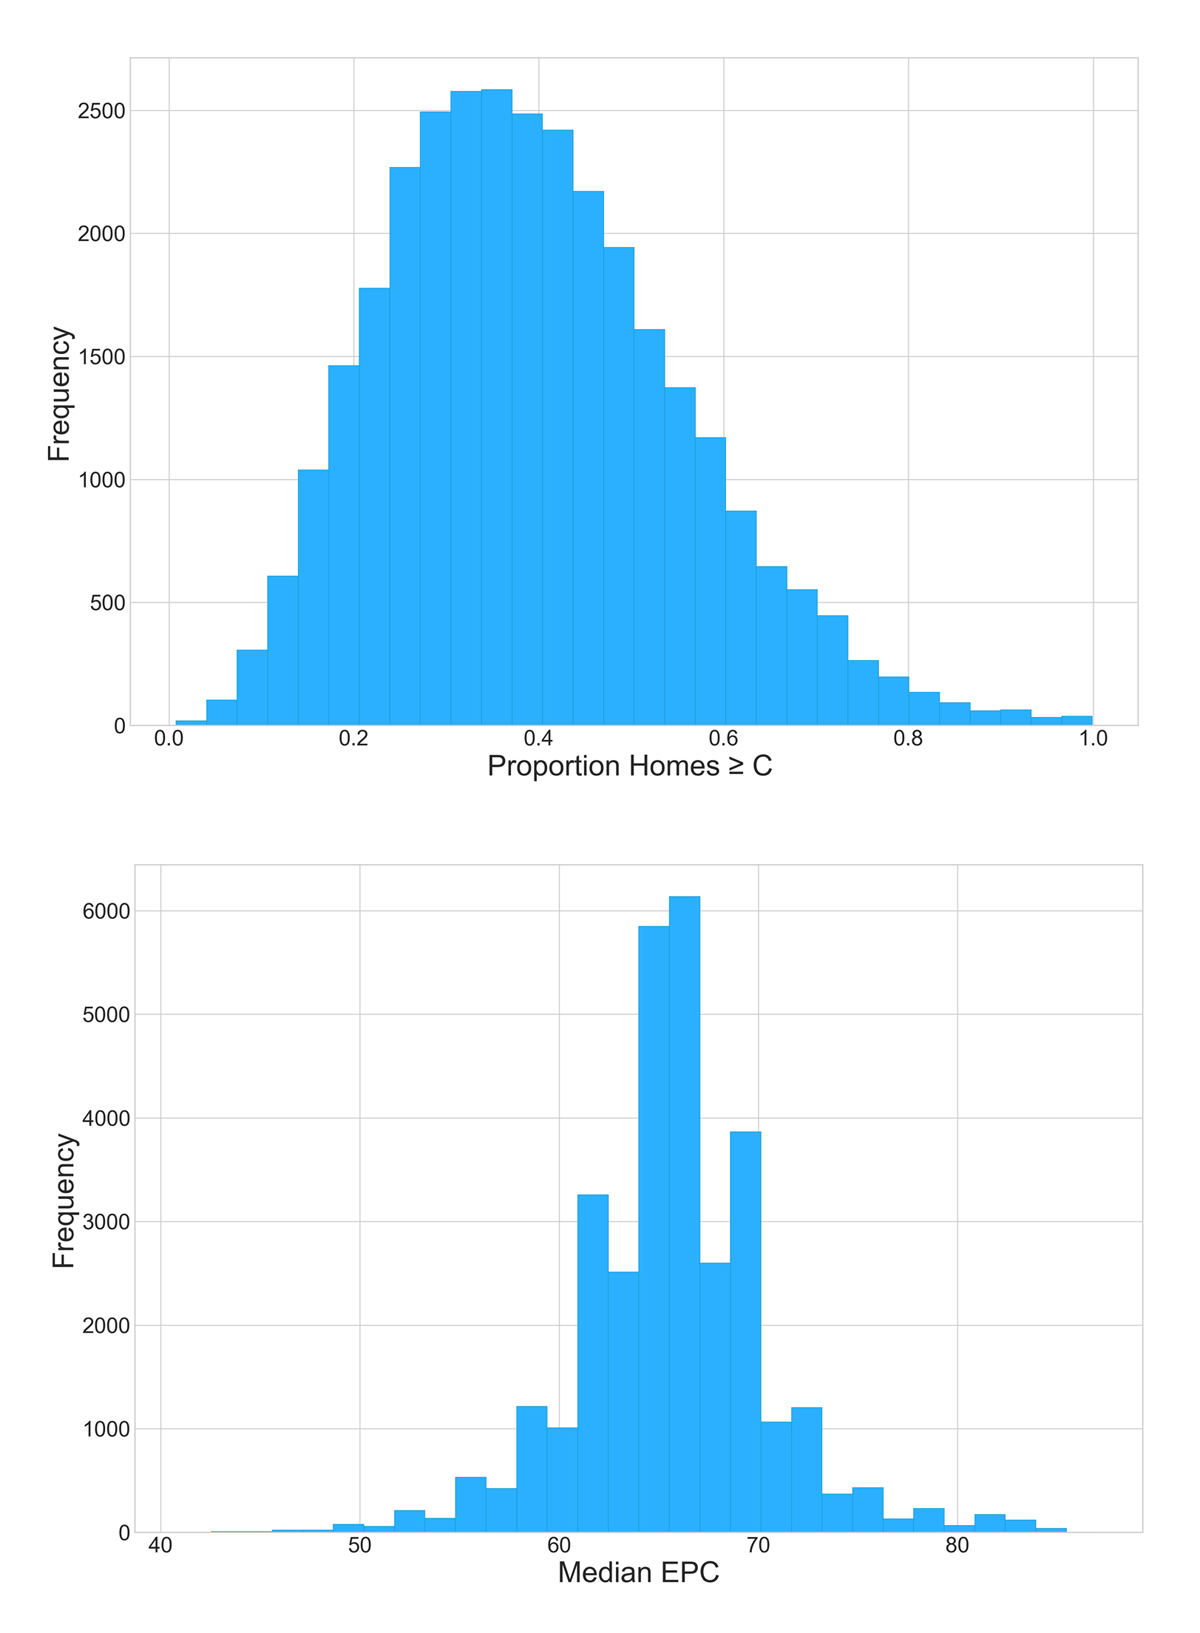
Figure 2
Home energy efficiency (HEE) characteristics.
Table 3
Pearson correlations of housing, socio-demographic and environmental variables to mental health metrics
| SAMHI (2015) | DEP. PREV. 2015 | Δ DEP. 2011–19 | Δ DEP. 2019–22 | |
|---|---|---|---|---|
| % Homes EPC ≥ C | 0.20** | 0.08** | –0.01 | 0.00 |
| Median EPC | 0.18** | 0.08** | 0.01 | 0.01 |
| Floor area | –0.33** | –0.05** | –0.08** | 0.01* |
| % Homes pre-1950 | –0.07** | –0.15** | 0.03** | –0.07** |
| % Flats | 0.01 | –0.19** | 0.01* | –0.16** |
| % Rented | 0.37** | –0.02** | 0.07** | –0.08** |
| Inc. score | 0.63** | 0.15** | 0.14** | 0.07** |
| Edu. score | 0.75** | 0.23** | 0.13** | 0.13** |
| HH size | –0.05** | –0.19** | 0.12** | –0.15** |
| % Age ≥ 65 | 0.01 | 0.06** | –0.12** | 0.12** |
| % Female | 0.06** | 0.06** | –0.01 | 0.08** |
| PM10 | –0.44** | –0.34** | 0.06** | –0.23** |
| Green space | –0.11** | –0.02** | –0.06** | 0.00 |
| Winter temp. | –0.12** | –0.20** | 0.05** | –0.10** |
[i] Note: P-values: **< 0.005, *< 0.05.
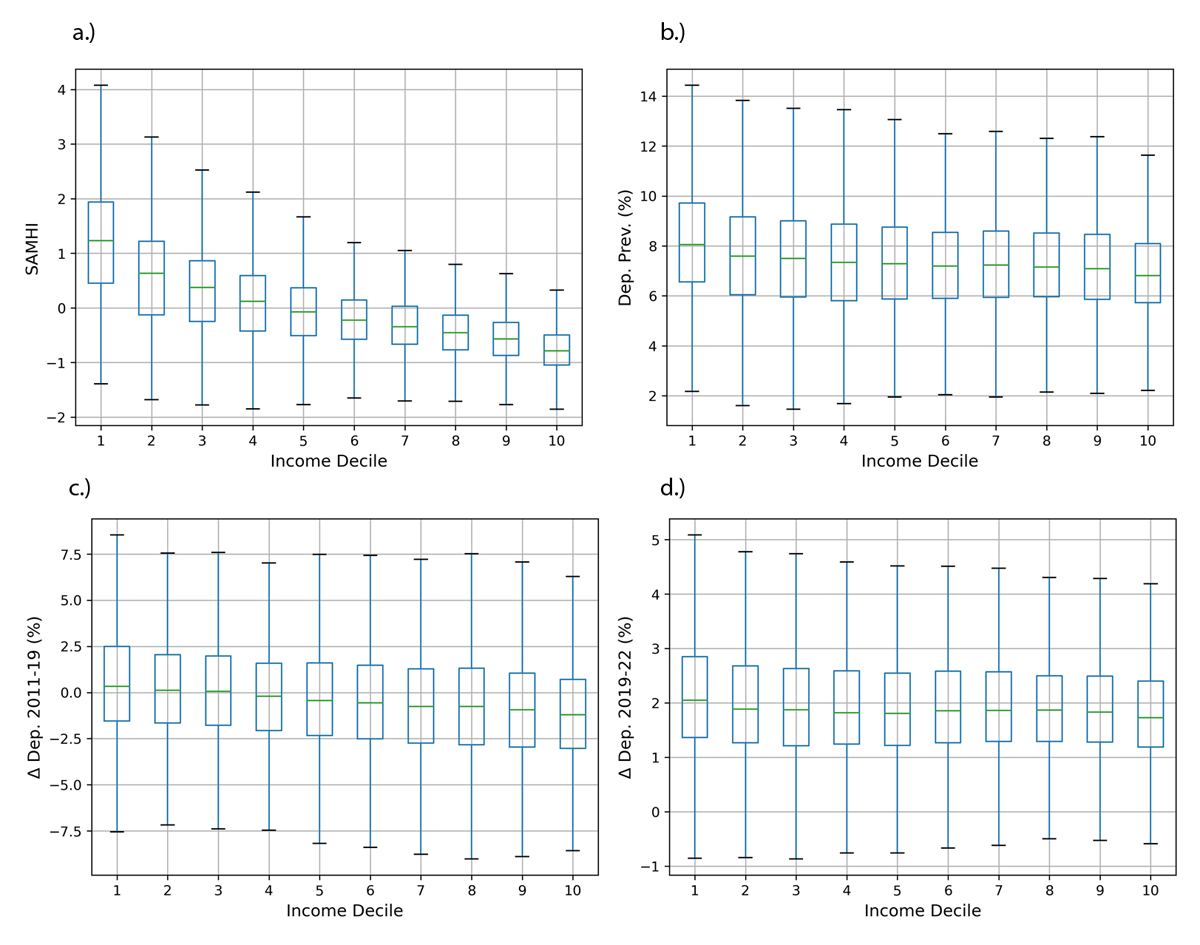
Figure 3
Income decile (where 1 is the most deprived 10% of lower layer super output areas—LSOA) versus mental health metrics.
Table 4
Descriptive statistics and analysis of variance (ANOVA) results for mental health indices grouped by Energy Performance Certificate (EPC) rating bands
| MODE EPC | N LSOAS | MEAN | SD | MINIMUM | 25% | 50% | 75% | MAXIMUM |
|---|---|---|---|---|---|---|---|---|
| SAMHI (2015), F-statistic: 343.1, p = 2.8E–219 | ||||||||
| B | 338 | –0.35 | 0.80 | –0.87 | –0.45 | –0.02 | –1.71 | 5.27 |
| C | 7435 | 0.25 | 1.02 | –0.49 | 0.06 | 0.87 | –2.01 | 5.90 |
| D | 23489 | –0.09 | 0.86 | –0.70 | –0.22 | 0.38 | –2.03 | 6.45 |
| E | 540 | –0.48 | 0.52 | –0.79 | –0.56 | –0.24 | –1.35 | 4.44 |
| Dep. prev. (2015) (%), F-statistic: 35.5, p = 6.5E–32 | ||||||||
| B | 338 | 7.2 | 2.2 | 5.8 | 6.9 | 8.6 | 2.2 | 15.6 |
| C | 7435 | 7.6 | 2.2 | 6.1 | 7.5 | 9.0 | 1.3 | 16.6 |
| D | 23489 | 7.4 | 2.2 | 5.9 | 7.3 | 8.7 | 1.0 | 17.4 |
| E | 540 | 7.0 | 1.6 | 5.9 | 7.0 | 8.1 | 1.5 | 11.8 |
| Δ Dep. 2011–19 (%), F-statistic: 10.7, p = 5.2E–7 | ||||||||
| B | 338 | –0.6 | 3.0 | –2.6 | –0.6 | 1.2 | –10.5 | 7.8 |
| C | 7435 | –0.3 | 3.4 | –2.4 | –0.4 | 1.6 | –13.8 | 16.4 |
| D | 23489 | –0.3 | 3.3 | –2.4 | –0.4 | 1.6 | –16.1 | 22.0 |
| E | 540 | –1.1 | 3.3 | –3.3 | –1.2 | 0.9 | –12.8 | 7.0 |
| Δ Dep. 2019–22 (%), F-statistic: 6.2, p = 3.2E–4 | ||||||||
| B | 338 | 1.8 | 1.2 | 1.0 | 1.8 | 2.5 | –1.7 | 8.4 |
| C | 7435 | 2.0 | 1.2 | 1.2 | 1.8 | 2.6 | –8.7 | 12.1 |
| D | 23489 | 2.0 | 1.2 | 1.3 | 1.9 | 2.6 | –11.7 | 13.8 |
| E | 540 | 1.8 | 1.1 | 1.2 | 1.8 | 2.4 | –4.3 | 5.6 |
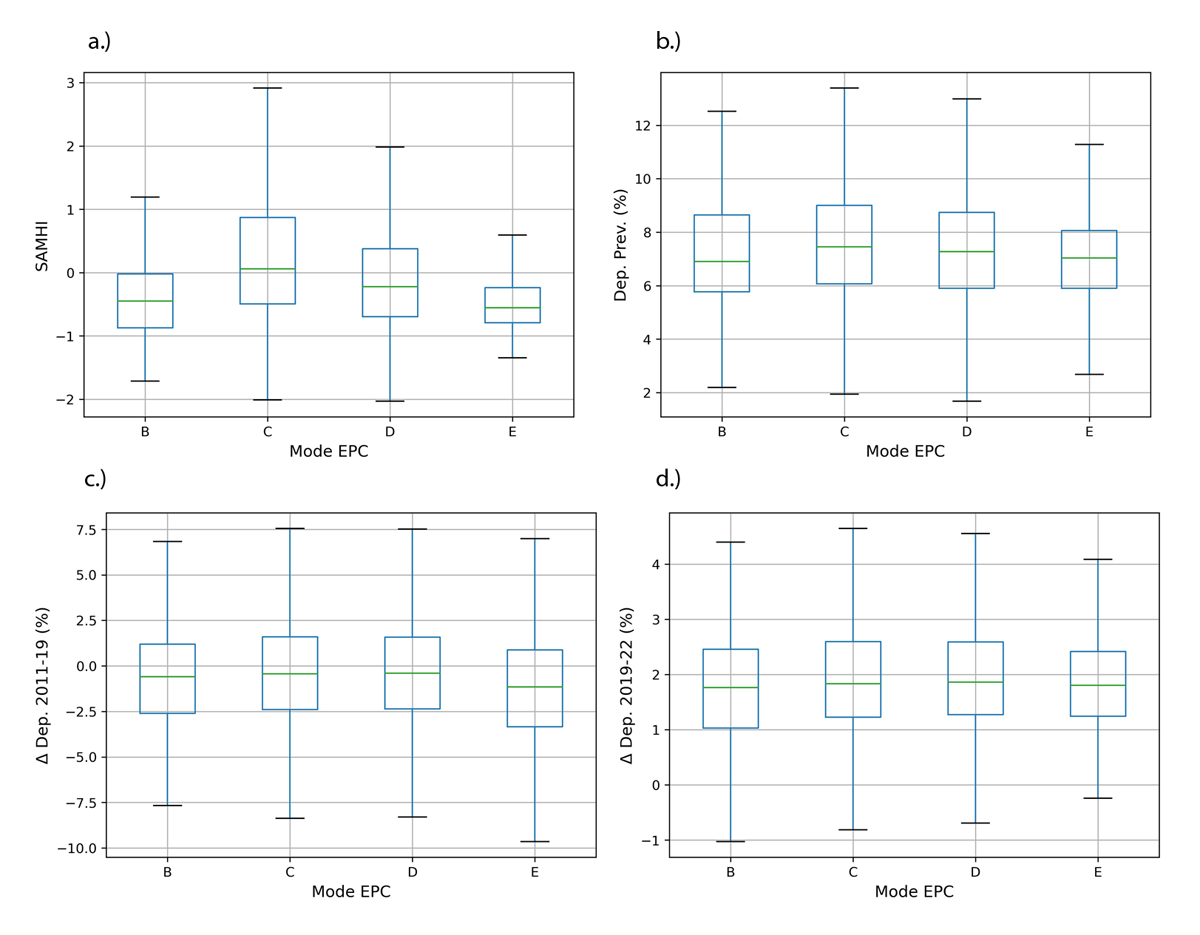
Figure 4
Mode Energy Performance Certificate (EPC) band for lower layer super output areas (LSOAs) versus mental health outcomes.
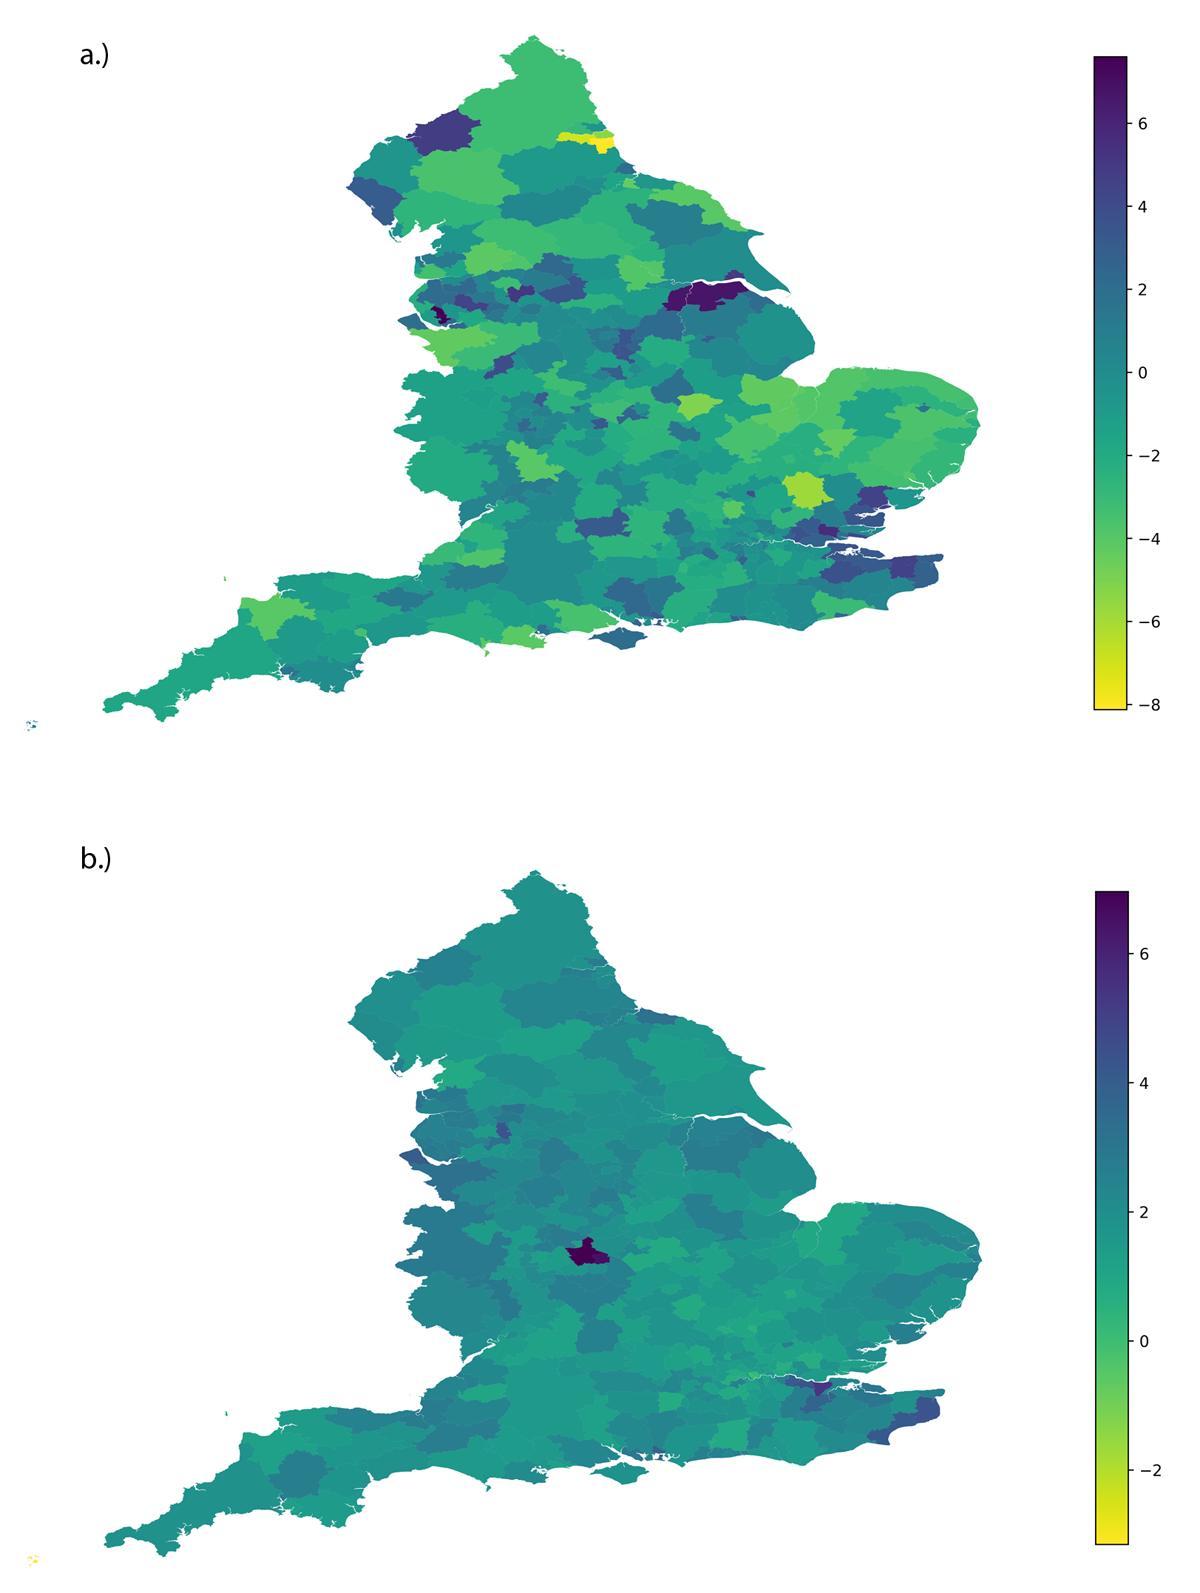
Figure 5
Median change in depression prevalence (%) at the local authority level for the periods 2011–19 (a) and 2019–22 (b).