
1. Introduction
1.1 Background
In the face of the climate crisis, countries worldwide must urgently retrofit buildings to achieve net zero and reduce carbon emissions associated with heating and cooling. The English housing stock is considered amongst the oldest and least energy efficient in Europe (Piddington et al. 2020). Homes are responsible for 22% of the UK’s carbon emissions, and around 43% of total domestic fuel consumption is used for space heating (HM Government 2023a).
The ongoing energy crisis has led to high levels of inflation globally. In the UK, this has led to a cost-of-living crisis resulting in the largest decline in living standards on record (Office for Budget Responsibility (OBR) 2023). Despite energy price caps and government intervention, the National Energy Action (NEA) estimates the number of UK households in fuel poverty to have risen from 4.5 million to 6.5 million between 2021 and 2023 (NEA 2024). Fuel poverty is not homogeneously distributed across England and there are higher rates in the West Midlands and the North East (HM Government 2023a). The Building Research Establishment (BRE) estimate the annual cost to the National Health Service (NHS) of excess cold in English homes to be £857 million (BRE Group 2023). Eradicating fuel poverty through the provision of cheap, clean energy to energy-efficient homes may also provide a co-benefit to population health.
Mental disorders are a leading cause of morbidity and mortality, responsible for one in six years lived with disability worldwide (WHO 2022). In the UK, approximately one in four people experience mental health issues each year, and suicide is the leading cause of death in males under the age of 45 years (Mind 2020). Since 2020, there has been a steady increase in contacts with NHS mental health services in England, from 1.32 million in July 2020 to 1.83 million in October 2023 (NHS Digital 2023). Poor mental health carries an economic and societal cost of £105 billion per year in England (Mental Health Taskforce 2016). Evidence of a link between home energy efficiency (HEE) and population mental health may provide a further incentive to decarbonise the housing stock, not typically considered in health co-benefit calculations (Milner et al. 2023; UKHSA 2023).
1.2 Sociodemographic determinants of mental health
A growing body of evidence suggests a strong socio-economic gradient with mental health (Alegría et al. 2018; Kirkbride et al. 2024). A multitude of complex, interlinked social determinants have causal links to mental health outcomes. Socio-economic disadvantage is a major factor, often coming with a lack of access to good education, employment and healthcare. Early life adversity, experiences of discrimination and social isolation/exclusion have also been identified as key determinants (Kirkbride et al. 2024). Financial and employment instability can result in a variety of harmful stressors that can lead to the onset of mental health conditions (Link & Phelan 1995; Guan et al. 2022; Rohde et al. 2016; Kopasker et al. 2018; Utzet et al. 2020). Socio-economic disadvantage can perpetuate a vicious cycle leading to widening inequalities in mental health (WHO 2022; Vereeken et al. 2023). Poor mental health may also be exacerbated through exposure to substandard physical environments, including unsafe and inadequate housing, exposure to air and noise pollution, and lack of access to green/blue space (Clark et al. 2007; Singh et al. 2019; Braithwaite et al. 2019; Borroni et al. 2022; Geneshka et al. 2021). However, there remains a lack of robust evidence on the causal relationships between physical environments and mental health (Clark et al. 2007; Moore et al. 2018).
1.3 Housing, energy poverty and mental health
Poor housing conditions have been shown to be linked to mental health problems, with affordability cited as major driver (Pevalin et al. 2017; Mental Health Network 2017). Living in fuel poverty has been linked with poor mental health outcomes (Mohan 2022). Recent studies indicate that improved HEE can have a moderate positive effect on health, with people on lower incomes observed to benefit the most (Maidment et al. 2014; Tu et al. 2022; Huebner et al. 2022; Symonds et al. 2021). Health benefits of improved HEE are realised through better winter thermal comfort and a reduction in mould and damp (Hamilton et al. 2015; Huebner et al. 2022). Lower energy bills can also help to reduce financial stress (IEA 2019). HEE also impacts the ventilative characteristics of homes, making them more airtight, reducing exposure to ambient air pollution (Noris et al. 2013). Compensatory ventilation is recommended to provide fresh air and remove harmful indoor contaminants; however, low-income groups are less likely to ventilate resulting in a systemic inequality (Ferguson et al. 2021).
1.4 Linking housing and mental health data
Previous studies linking HEE, socio-demographic and other local environment variables to mental health and wellbeing data have used self-reported (or subjective) health, typically at the household level (Riva et al. 2023; Siegel et al. 2024; Huebner et al. 2022). Huebner et al. (2022) and Riva et al. (2023) linked national housing surveys to self-reported mental health in England and Canada, respectively, finding lower occupant wellbeing associated with difficult to keep warm homes. Neighbourhood satisfaction is considered important to population wellbeing (Huebner et al. 2022; Diez Roux & Mair 2010). Therefore, it is important to link data at the neighbourhood as well as at the housing level. This paper builds on previous work and provides novelty, since it links mental health metrics based on clinical data for the whole of England at a small area level.
1.5 Aims and objectives
The primary aim of this paper is to link housing, socio-demographic and environmental factors with clinical mental health outcomes at a local area level for England. These three key factors were considered important determinants of mental health, based on the literature. This research is timely, since several openly accessible datasets have recently become available, which until now have not been linked. Diagnosed depression prevalence and a clinical mental index from the Place-based Longitudinal Data Resource (PLDR) were linked to HEE data from Energy Performance Certificates (EPCs) and other administrative data. The secondary aim of this paper was to demonstrate the utility of the linked data through an exploratory descriptive analysis. A descriptive analysis is required presently to understand better the utility of the data before asking more specific research questions. The objective was to investigate the relationships between housing, socio-demographic, and environmental factors and clinical mental health at the local area level. In particular:
the relationship between HEE and income with clinical mental health is investigated; and
changes in depression prevalence over two study periods (2011–19 and 2019–22) are mapped by local authority.
This paper does not investigate causal relationships between variables, due to the inherent challenges of using observational data, such as the inability to control for individual-level factors (Diez Roux & Mair 2010). The longitudinal nature of the clinical mental health data coupled with robust statistical analysis may make this a possibility in future work.
2. Methods
To address the main aims and objectives set out in the introduction, a dataset was compiled for England at the lower layer super output areas (LSOAs) level. An LSOA is a small geographical area that typically contains between 400 and 1200 households. The descriptive analysis is comprised of the following steps:
Combine open-source datasets for England at the LSOA level (N = 32,844, using 2011 LSOA boundaries) into a single dataset.
Assess correlations and plot relationships between key housing, socio-demographic and environmental variables.
Perform an analysis of variance (ANOVA) to establish whether there is a statistically significant difference in clinical mental health indicators between areas with modal EPC bands.
Use geographical information system (GIS) to map changes in depression prevalence for the two study periods (2011–19 and 2019–22).
2.1 Datasets and sources
This section describes the mental health, housing, socio-demographic and environment variables and the data sources from which they are derived. All data come from open-source databases. Table 1 summarises the variables and data sources used in this study. Where possible, data from 2015 have been used to match Office for National Statistics (ONS) data on indices of deprivation (only available in 2010, 2015 and 2019). Data from 2015 was not available for variables derived from EPCs, household size and environmental exposures.
Table 1
Summary of the variables and data sources
| VARIABLE | ABBREVIATION | SOURCE/REFERENCE | YEAR(S) |
|---|---|---|---|
| Mental health outcomes | |||
| Small Area Mental Health Index (SAMHI) | SAMHI | PLDR (Daras & Barr 2020) | 2015 |
| Depression prevalence | Dep. prev. | PLDR (Daras et al. 2023) | 2015 |
| Depression prevalence change, 2011–19 (%) | Δ Dep. 2011–19 | PLDR (Daras et al. 2023) | 2011, 2019 |
| Depression prevalence change, 2019–22 (%) | Δ Dep. 2019–22 | PLDR (Daras et al. 2023) | 2019, 2022 |
| Housing characteristics | |||
| % Homes with an EPC rating ≥ C | % Homes ≥ C | EPCs (DLUHC 2023) | 2008–23 |
| Median EPC rating | Median EPC | EPCs (DLUHC 2023) | 2008–23 |
| Mode of EPC band | Mode EPC | EPCs (DLUHC2023) | 2008–23 |
| Median floor area (m2) | Floor area | EPCs (DLUHC 2023) | 2008–23 |
| % Homes built pre-1950 | % Homes pre-1950 | EPCs (DLUHC 2023) | 2008–23 |
| % Flats, maisonettes or apartments | % Flats | EPCs (DLUHC 2023) | 2008–23 |
| % Social or private rented | % Rented | EPCs (DLUHC 2023) | 2008–23 |
| Demographics | |||
| Income deprivation score | Inc. score | National Statistics (MHCLG 2015) | 2015 |
| Education deprivation score | Edu. score | National Statistics (MHCLG 2015) | 2015 |
| Mean household size (n) | HH size | Census (ONS 2013) | 2011 |
| % Population age ≥ 65 | % Age ≥ 65 | ONS (2015) | 2015 |
| % Population female | % Female | ONS (2015) | 2015 |
| Environmental factors | |||
| Air pollution (PM10) (μg/m3) | PM10 | AHAH v2 (Daras et al. 2019) | 2017 |
| Distance to nearest active green space (km) | Green space | AHAH v2 (Daras et al. 2019) | 2017 |
| Average winter temperature (°C) | Winter temp. | HadUK (Met Office 2023) | 1990–2020 |
[i] Note: AHAH v2 = Access to Healthy Assets & Hazards v2; EPC = Energy Performance Certificate; PLDR = Place-based Longitudinal Data Resource.
Clinical mental health data are available from the Place-based Longitudinal Data Resource (PLDR), managed by the University of Liverpool, which provides annual data from a variety of sources (e.g. hospital admissions data, budgetary data, prescribing data) at LSOA level. It is used by researchers, practitioners and government to track changes in health indicators over time. Housing and HEE data are derived from EPCs, a requirement for homes built, sold or rented since the introduction of the policy in 2008 (HM Government 2024). EPC data were aggregated using medians, modes and proportions at the LSOA level for this study. The EPC dataset is comprised of 24,736,816 homes, with EPCs recorded between 1 October 2008 and 31 May 2023. For homes with multiple EPCs (N = 3,798,313), the most recent is used, but missing data are filled from the most recent previous certificates. EPCs were linked to 2011 Census LSOAs by postcode using the National Statistics Postcode Lookup (ONS 2022). Demographic data such as age, gender and deprivation indicators originate from the 2011 Census or other ONS sources.
The Access to Healthy Assets & Hazards (AHAH v2) dataset was used for environmental exposures, including air pollution and access to green space (Daras et al. 2019). AHAH is a multidimensional index developed by the Consumer Data Research Centre (CDRC) for Great Britain. It is used to provide an index for how ‘healthy’ a local area is. Finally, HadUK-Grid data at 1 × 1 km resolution was used to estimate winter (December–February) ambient temperatures (Met Office 2023).
2.2 Clinical mental health metrics
Two mental health indicators provided by the PLDR are used in this analysis. The Small Area Mental Health Index (SAMHI) and depression prevalence, both recorded annually at the LSOA level.
SAMHI is a composite metric that combines mental health data from several sources into a single index. SAMHI values range from around –2 to +6, representing very good to very poor levels of local area mental health, respectively. NHS Digital provides data on mental health-related hospital attendance rates, antidepressant prescription rates and depression prevalence as defined by the Quality of Outcomes Framework (QOF), whilst the Department of Work and Pensions (DWP) provides incapacity benefit and employment support allowance for mental illness. Each of these four indicators is standardised to have a mean of 0 and a standard deviation (SD) of 1 and is then combined into a single metric (Daras & Barr 2020). SAMHI is available for the period 2011–21; however, in this analysis data from 2015 were used to provide the local area mental health for a single year.
Depression prevalence (a component of SAMHI) is constructed at the LSOA level by dividing the estimated number of patients with a diagnosis of depression (as defined by the QOF) by the total number of patients registered at general practitioner practices (for full details, see Daras et al. 2023). Patients of all ages are included for the whole of England. PLDR provides these data, which currently cover the period 2011–22. Data from 2015 were used to provide data from a single year. The change in depression prevalence is also captured using data from 2011, 2019 and 2022, i.e. change in prevalence is calculated using the depression prevalence (%) in a local area in 2011 minus the prevalence (%) in 2019. The 2011–19 change covers the years of austerity in the UK (Raisin 2024), whilst the period 2019–22 captures the COVID-19 pandemic (Sherrington 2022) and the early stages of the cost-of-living crisis.
2.3 Housing variables
Housing information at the LSOA level is derived from EPC data. Several HEE metrics can be derived by aggregating data to the LSOA from individual EPC ratings (0–100) and EPC bands: A (most efficient) to G (least efficient). Individual ratings for homes are recorded by accredited EPC assessors using the UK government’s Reduced Standard Assessment Procedure (SAP) for dwellings (HM Government 2022). The three energy efficiency metrics aggregated at the LSOA level in this paper are:
the median EPC score of homes with an LSOA (possible range 0–100)
the percentage of homes with an EPC band ≥ C and
the mode of the EPC band (A–F).
The reason for selecting these variables is that they can be used in different ways in subsequent statistical analysis. The percentage of homes with an EPC band ≥ C was used, since it has policy relevance as households living in these homes are deemed not to be in fuel poverty according to the low income low energy efficiency (LILEE) definition (HM Government 2023a). The first two variables are continuous, whilst the mode of EPC rating is an ordered categorical variable.
Several other variables related to housing conditions are also included: median floor area, percentage of homes that are flats or maisonettes, percentage that are private or social rented, and percentage of homes built pre-1950. These variables are all derived from EPCs and aggregated at the LSOA level.
2.4 Sociodemographic variables
Various complex and interlinked factors have been shown to be associated with mental health. These consist of demographic and environmental factors and were identified a priori through a search of the literature (Kim & Kim 2017; Solmi et al. 2021; Rosenfield & Mouzon 2013). Similar factors were also included in Symonds et al. (2021).
Socio-demographic factors derived at the LSOA level for this study include age and gender: the percentage of people within an LSOA aged ≥ 65 or who are female, respectively. These are derived using ONS (2015) population data. Income and education deprivation scores provided by the Ministry of Housing, Communities & Local Government (MHCLG) (2015) are also included. These provide a relative score that can be used to compare deprivation between small areas in England. A higher score indicates increased levels of deprivation. Household size is also included and is calculated as the average number of people per dwelling in an LSOA using data from the 2011 Census (ONS 2013).
2.5 Local environment variables
Several environmental factors were also included in the study. Data from the AHAH v2 dataset was used to provide LSOA-level data on air pollution/particulate matter (PM10) and access to active green space (Daras et al. 2019). AHAH v2 provides data from 2017. The distance-to-active-green-space variable is the average distance (km) a person within an LSOA would need to travel to reach the nearest greenspace conducive to physical activity. Finally, the average winter ambient temperature was included. This is the average outdoor air temperature (°C) within an LSOA centroid over days in December–February between 1990 and 2020 using HadUK data (Met Office 2023).
2.6 Statistical analysis
After combining all data at the LSOA level, the first step in the analysis was to assess the strength of the association between mental health, and housing, socio-demographic and environmental variables. Pearson and Spearman correlations and the statistical significance of these values were calculated. Box plots were used to inspect visually the relationships between variables. For example, the relationship between mode EPC band and mental health outcomes was plotted to inspect whether there are higher or lower levels of poor mental health in local areas with different mode EPC bands.
The next step was to perform a one-way ANOVA to test the null hypothesis that the mean SAMHI/depression prevalence is the same between groups of LSOAs with different mode EPC bands. ANOVA was deemed an appropriate test, since data within each group are independent, close to normally distributed, and the variances are similar for the smallest and largest EPC band groups. ANOVA provides an F-statistic and a p-value which are used to indicate the statistical significance of the difference in means between groups. A p < 0.05 indicates a low probability (< 5%) of making such observations assuming that the null hypothesis is true. Following on from the ANOVA, Tukey’s range tests were performed to test for differences between means for all EPC band combinations. Regression analysis was not performed in this paper, since the primary focus was to match and explore the data, observe relationships between variables, and test whether there are statistical differences in clinical mental health between local areas with different modal EPC bands.
The final part of the analysis was to demonstrate how GIS can be used to map the data and reveal regional differences in mental health. Mental health metrics have been mapped at local authority level (N = 326), using the median LSOA value within each local authority. These metrics were mapped using Geopandas (0.6.1) (Jordahl et al. 2020). Python (v3.8.2) was used for data aggregation, merging and statistical analysis (Van Rossum & Drake 2009).
3. Results
3.1 Descriptive statistics
Table 2 provides descriptive statistics for all key continuous variables included in the analysis using the linked LSOA data for England (N = 31,802). A total of 1042 LSOAs were excluded due to missing EPC data for homes within these LSOAs. Figures 1 and 2 show histograms for the mental health and continuous HEE metrics, respectively. Appendix 1 in the supplemental data online provides histograms for socio-demographic and environmental variables. Due to its normalisation, SAMHI (2015) has a mean close to 0 and SD ~ 1 with a slight positive skew. The mean depression prevalence across LSOAs in 2015 was 7.4%. Averaged across LSOAs, depression prevalence decreased by 0.3% between 2011 and 2019 and increased by 2.0% between 2019 and 2022. Regarding HEE, on average 39% of homes within an LSOA achieve and EPC rating band of ≥ C and have a median EPC rating of 65.7.
Table 2
Descriptive statistics for continuous variables for N = 31,802 lower layer super output areas (LSOAs) in England
| VARIABLE AT LSOA LEVEL | MEAN | SD | MINIMUM | 25% PERCENTILE | 50% PERCENTILE | 75% PERCENTILE | MAXIMUM |
|---|---|---|---|---|---|---|---|
| Mental health outcomes | |||||||
| SAMHI (2015) | –0.02 | 0.91 | –2.03 | –0.66 | –0.18 | 0.47 | 6.45 |
| Dep. prev. (%) (2015) | 7.4 | 2.2 | 1.0 | 5.9 | 7.3 | 8.8 | 17.4 |
| Δ Dep. 2011–19 (%) | –0.3 | 3.3 | –16.1 | –2.4 | –0.4 | 1.6 | 22.0 |
| Δ Dep. 2019–22 (%) | 2.0 | 1.2 | –11.7 | 1.3 | 1.8 | 2.6 | 13.8 |
| Housing characteristics | |||||||
| % Homes ≥ C | 39% | 16% | 1% | 28% | 38% | 50% | 100% |
| Median EPC | 65.7 | 4.9 | 41 | 63 | 66 | 68 | 87 |
| Floor area (m2) | 80.5 | 14.1 | 31 | 71 | 79 | 88 | 160 |
| % Homes pre-1950 | 38% | 27% | 0% | 15% | 35% | 57% | 100% |
| % Flats | 20% | 23% | 0% | 4% | 11% | 27% | 100% |
| % Rented | 37% | 20% | 2% | 20% | 33% | 51% | 98% |
| Demographics | |||||||
| Income score | 0.15 | 0.10 | 0.01 | 0.07 | 0.11 | 0.20 | 0.64 |
| Education score | 0.12 | 0.08 | 0.00 | 0.06 | 0.10 | 0.16 | 0.58 |
| Household size (n) | 2.3 | 0.3 | 1.1 | 2.1 | 2.2 | 2.4 | 4.8 |
| % Age ≥ 65 | 18% | 8% | 0% | 12% | 18% | 24% | 61% |
| % Female | 51% | 2% | 15% | 50% | 51% | 52% | 65% |
| Environmental factors | |||||||
| PM10 (μg/m3) | 13.5 | 2.2 | 7.5 | 11.4 | 13.8 | 15.2 | 17.5 |
| Green space (km) | 0.59 | 0.58 | 0.04 | 0.32 | 0.46 | 0.67 | 33.1 |
| Winter temp. (°C) | 5.1 | 0.6 | 1.6 | 4.6 | 5.0 | 5.5 | 8.5 |
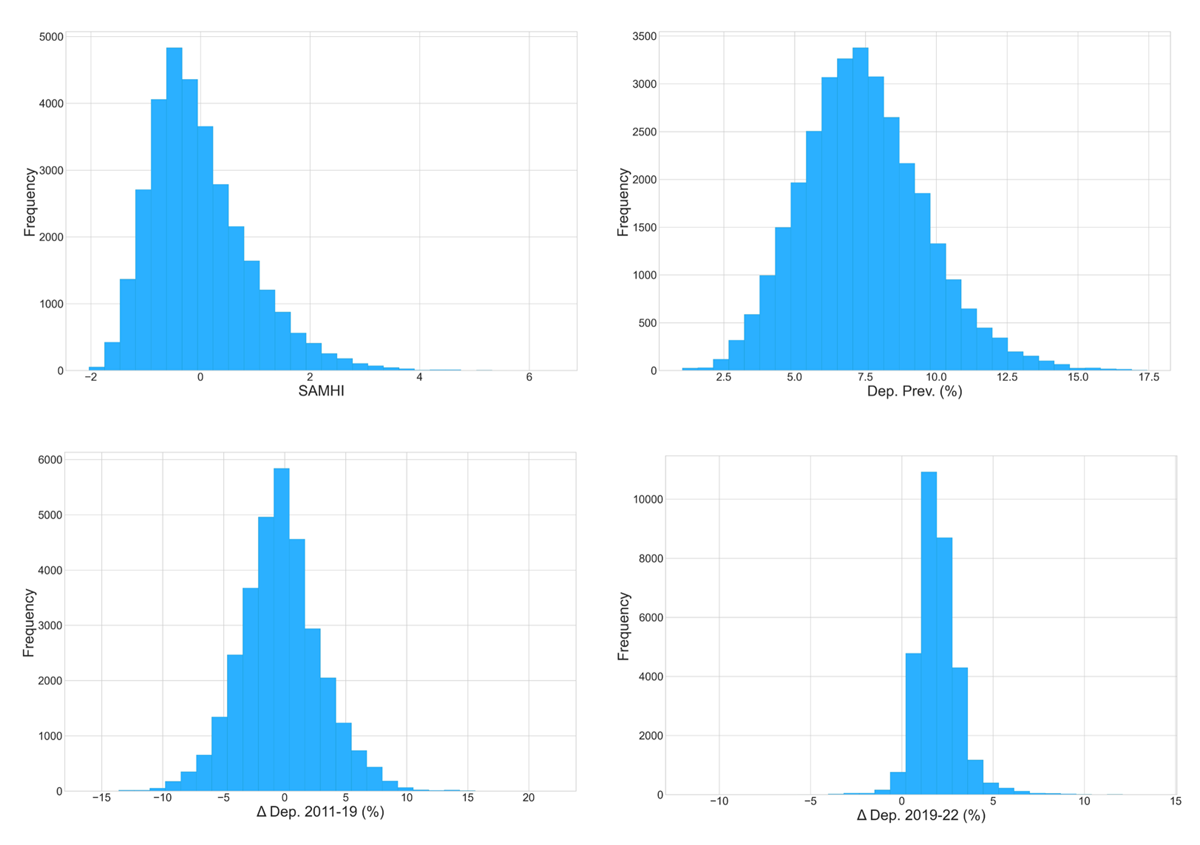
Figure 1
Mental health outcome variables.
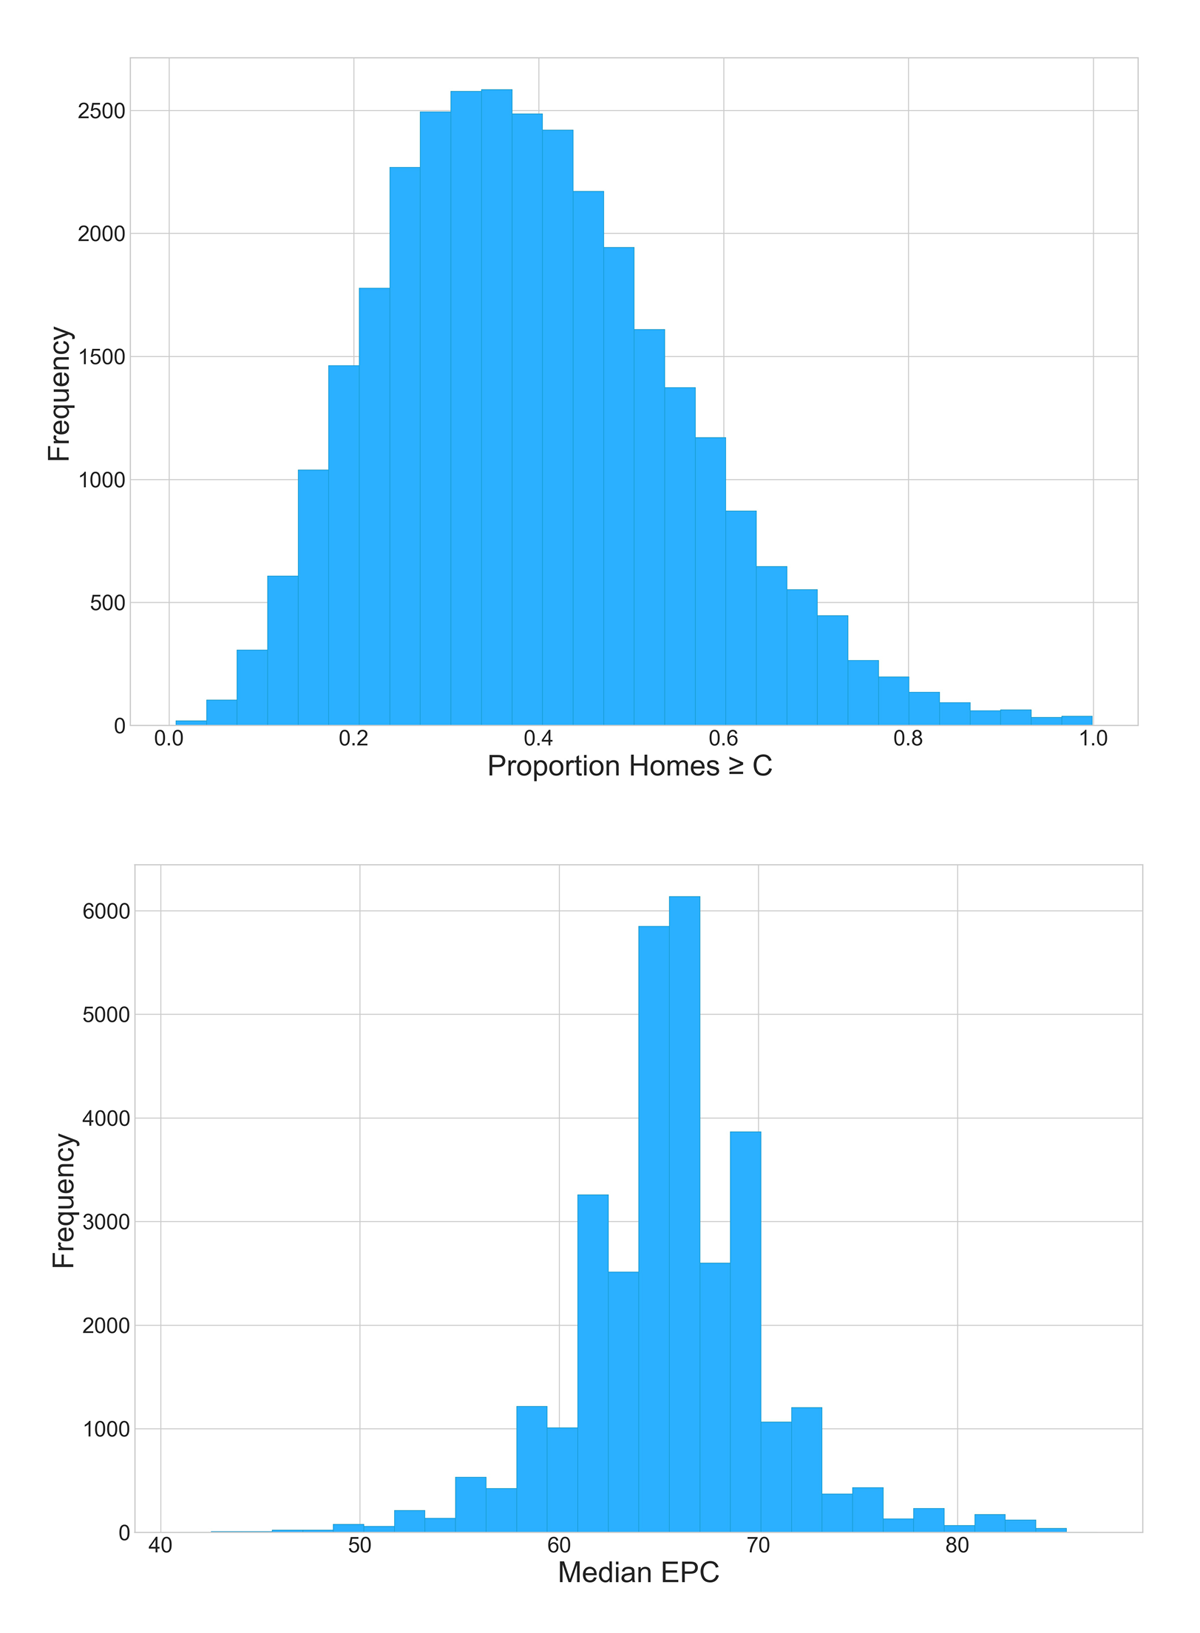
Figure 2
Home energy efficiency (HEE) characteristics.
3.2 Correlations with mental health metrics
Table 3 provides Pearson correlation coefficients between all variables in Table 1 and the four mental health metrics. Spearman and Pearson correlations between all variables are provided in Appendix 2 in the supplemental data online. For the time static mental health metrics (2015), high income and employment deprivation within LSOAs correlates with SAMHI and depression prevalence. Figure 3 shows a clear gradient in SAMHI and depression prevalence with income decile. This gradient/correlation is weaker for the change in depression prevalence over the COVID-19 study period. There is a general reduction in depression prevalence between 2011 and 2019 (except for income decile groups 1–3: low income). Over the COVID-19 study period (2019–22) there is an increase in prevalence for all income deciles.
Table 3
Pearson correlations of housing, socio-demographic and environmental variables to mental health metrics
| SAMHI (2015) | DEP. PREV. 2015 | Δ DEP. 2011–19 | Δ DEP. 2019–22 | |
|---|---|---|---|---|
| % Homes EPC ≥ C | 0.20** | 0.08** | –0.01 | 0.00 |
| Median EPC | 0.18** | 0.08** | 0.01 | 0.01 |
| Floor area | –0.33** | –0.05** | –0.08** | 0.01* |
| % Homes pre-1950 | –0.07** | –0.15** | 0.03** | –0.07** |
| % Flats | 0.01 | –0.19** | 0.01* | –0.16** |
| % Rented | 0.37** | –0.02** | 0.07** | –0.08** |
| Inc. score | 0.63** | 0.15** | 0.14** | 0.07** |
| Edu. score | 0.75** | 0.23** | 0.13** | 0.13** |
| HH size | –0.05** | –0.19** | 0.12** | –0.15** |
| % Age ≥ 65 | 0.01 | 0.06** | –0.12** | 0.12** |
| % Female | 0.06** | 0.06** | –0.01 | 0.08** |
| PM10 | –0.44** | –0.34** | 0.06** | –0.23** |
| Green space | –0.11** | –0.02** | –0.06** | 0.00 |
| Winter temp. | –0.12** | –0.20** | 0.05** | –0.10** |
[i] Note: P-values: **< 0.005, *< 0.05.
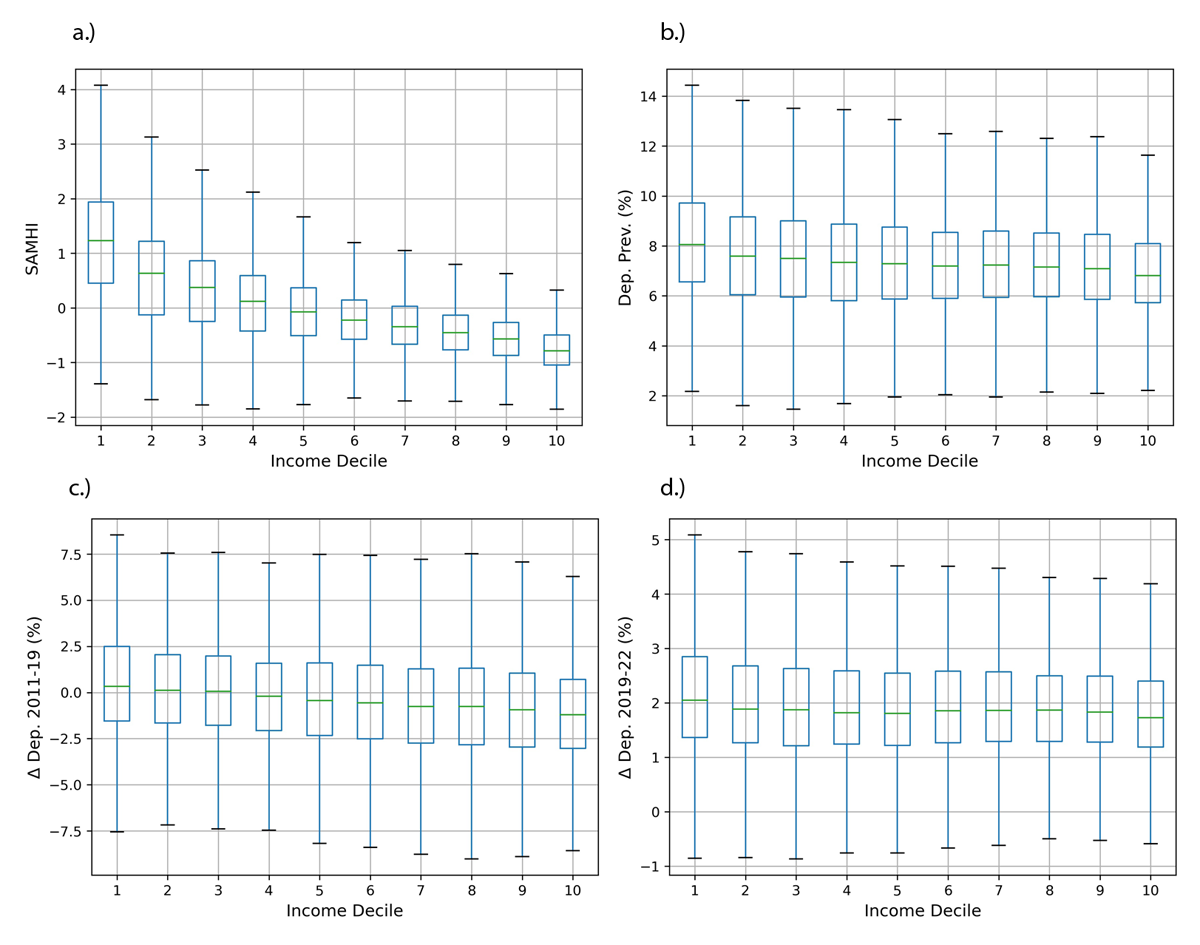
Figure 3
Income decile (where 1 is the most deprived 10% of lower layer super output areas—LSOA) versus mental health metrics.
3.2.1 Time-static mental health metrics
Areas with a higher percentage of females have a weak positive correlation with SAMHI and depression prevalence. A weak positive correlation is also observed between the percentage of people aged > 65 and depression prevalence; however, no correlation is observed for SAMHI (for box plots, see Appendix 3 in the supplemental data online).
With regards to the housing and household variables, there are moderate negative correlations for time static (2015) mental health metrics with household size, floor area and percentage of homes built pre-1950, and a moderate positive correlation for the HEE variables. The results are inconclusive for the percentage of flats and rentals within an LSOA, where there are weak negative correlations with depression prevalence, yet the percentage of rented accommodation has a positive correlation with SAMHI.
Regarding environmental variables, warmer areas are correlated with a lower SAMHI and depression prevalence. There is a moderate negative correlation for PM10 levels with SAMHI and depression prevalence (for box plots, see Appendix 3 in the supplemental data online). A weak negative correlation for static mental health metrics with distance to active green space is also observed.
3.2.2 Changes in mental health over the two study periods
For correlations related to changes in depression prevalence for the two study periods, the strongest correlations are with the income and education deprivation variables. Over both periods there were positive correlations between deprivation and increases in depression prevalence indicating widening inequalities in mental health. Several variables have a positive correlation for one period and a negative correlation for the other period, or vice versa. For example, age is negatively correlated with change in depression prevalence between 2011 and 2019, yet positively correlated for the period 2019–22. Another example of this is for PM10, where there is a weak positive correlation with change in depression prevalence for 2011–19, yet a moderate negative correlation for 2019–22. There is also a positive correlation for household (HH) size with change in depression prevalence for the period 2011–19, which is reversed for 2019–22.
3.3 Anova test for differences in mental health between modal epc bands
Table 4 provides descriptive statistics and ANOVA results for the four mental health metrics by modal EPC band for LSOAs. Results of the subsequent Tukey range tests are provided in Appendix 4 in the supplemental data online. The relationship between modal EPC band and mental health metrics is also shown in the box plots in Figure 4. For both static metrics using 2015 data, SAMHI and depression prevalence are highest in EPC rating band C and lowest in bands B and E, indicating a non-linear relationship between the energy rating of homes in an area and mental health outcomes. The ANOVA test supports this observation, particularly for SAMHI and depression prevalence where the null hypothesis is rejected at a high significance level. The ANOVA results are less conclusive for the changes in depression prevalence over the two study periods, although the null hypothesis can still be rejected at ≥ 99.9% confidence level in both cases. Since modal values were used, there were no LSOAs with a modal EPC in bands A, F or G. The number of LSOAs where modal EPC bands are B and E are low compared with bands C and D.
Table 4
Descriptive statistics and analysis of variance (ANOVA) results for mental health indices grouped by Energy Performance Certificate (EPC) rating bands
| MODE EPC | N LSOAS | MEAN | SD | MINIMUM | 25% | 50% | 75% | MAXIMUM |
|---|---|---|---|---|---|---|---|---|
| SAMHI (2015), F-statistic: 343.1, p = 2.8E–219 | ||||||||
| B | 338 | –0.35 | 0.80 | –0.87 | –0.45 | –0.02 | –1.71 | 5.27 |
| C | 7435 | 0.25 | 1.02 | –0.49 | 0.06 | 0.87 | –2.01 | 5.90 |
| D | 23489 | –0.09 | 0.86 | –0.70 | –0.22 | 0.38 | –2.03 | 6.45 |
| E | 540 | –0.48 | 0.52 | –0.79 | –0.56 | –0.24 | –1.35 | 4.44 |
| Dep. prev. (2015) (%), F-statistic: 35.5, p = 6.5E–32 | ||||||||
| B | 338 | 7.2 | 2.2 | 5.8 | 6.9 | 8.6 | 2.2 | 15.6 |
| C | 7435 | 7.6 | 2.2 | 6.1 | 7.5 | 9.0 | 1.3 | 16.6 |
| D | 23489 | 7.4 | 2.2 | 5.9 | 7.3 | 8.7 | 1.0 | 17.4 |
| E | 540 | 7.0 | 1.6 | 5.9 | 7.0 | 8.1 | 1.5 | 11.8 |
| Δ Dep. 2011–19 (%), F-statistic: 10.7, p = 5.2E–7 | ||||||||
| B | 338 | –0.6 | 3.0 | –2.6 | –0.6 | 1.2 | –10.5 | 7.8 |
| C | 7435 | –0.3 | 3.4 | –2.4 | –0.4 | 1.6 | –13.8 | 16.4 |
| D | 23489 | –0.3 | 3.3 | –2.4 | –0.4 | 1.6 | –16.1 | 22.0 |
| E | 540 | –1.1 | 3.3 | –3.3 | –1.2 | 0.9 | –12.8 | 7.0 |
| Δ Dep. 2019–22 (%), F-statistic: 6.2, p = 3.2E–4 | ||||||||
| B | 338 | 1.8 | 1.2 | 1.0 | 1.8 | 2.5 | –1.7 | 8.4 |
| C | 7435 | 2.0 | 1.2 | 1.2 | 1.8 | 2.6 | –8.7 | 12.1 |
| D | 23489 | 2.0 | 1.2 | 1.3 | 1.9 | 2.6 | –11.7 | 13.8 |
| E | 540 | 1.8 | 1.1 | 1.2 | 1.8 | 2.4 | –4.3 | 5.6 |
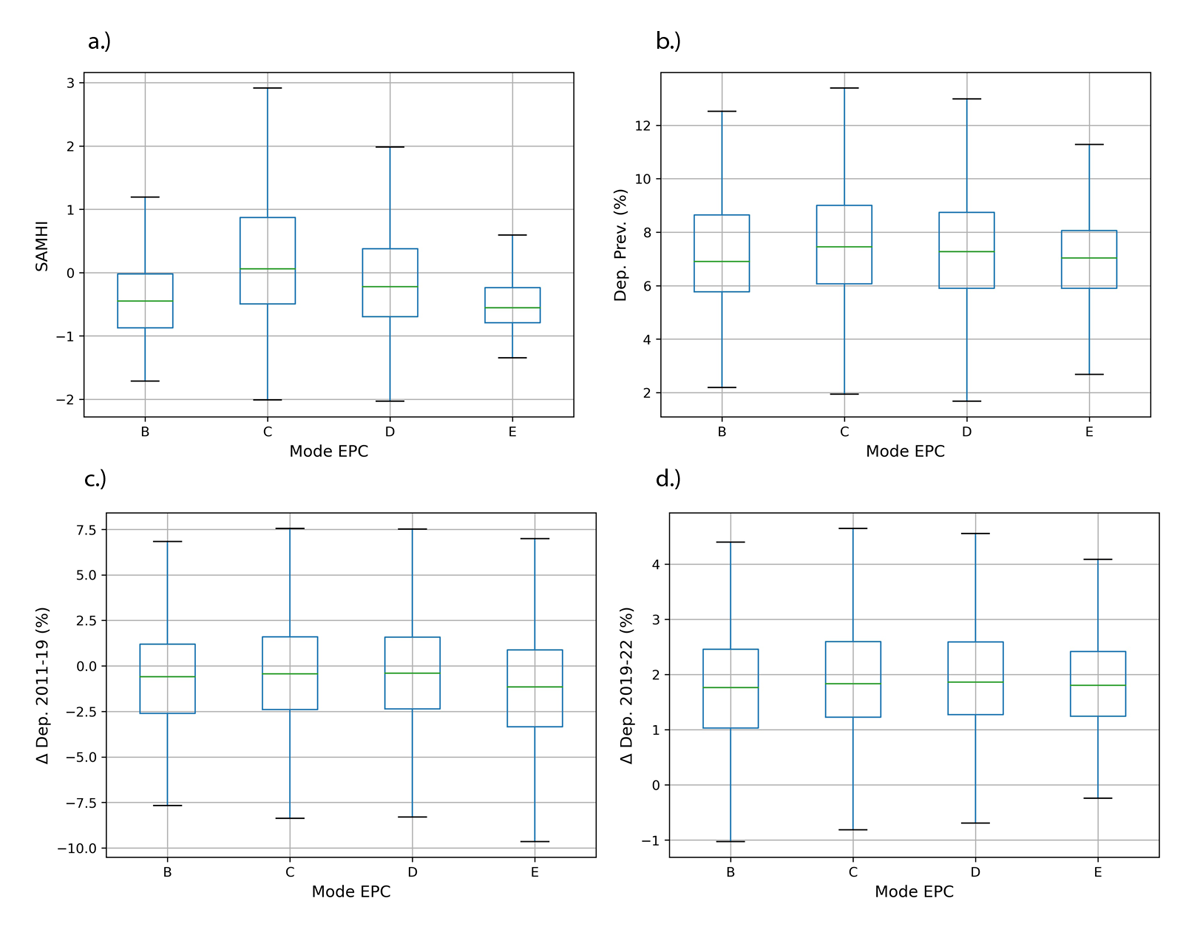
Figure 4
Mode Energy Performance Certificate (EPC) band for lower layer super output areas (LSOAs) versus mental health outcomes.
3.4 Mapping changes in depression prevalence
To demonstrate the use of GIS with the data, Figure 5 maps the change in depression prevalence for the two study periods for local authority districts (N = 326). SAMHI and depression prevalence for 2015 are also shown in Appendix 5 in the supplemental data online. These indicate that there were hotspots of improvement and deterioration in depression prevalence over both periods. During the austerity period (2011–19), Sunderland and Gateshead in the North East of England had the greatest improvement, whilst Knowsley in the North West had the greatest deterioration. For the COVID-19 period (2019–22), there were fewer places where improvements were observed, and improvements were more modest. The Isles of Scilly and parts of Central London (Kensington and Chelsea, and Westminster) had the greatest improvements, whilst parts of the Midlands (North Warwickshire, Nuneaton and Bedworth) and the South East (Gravesham) had the largest deterioration.
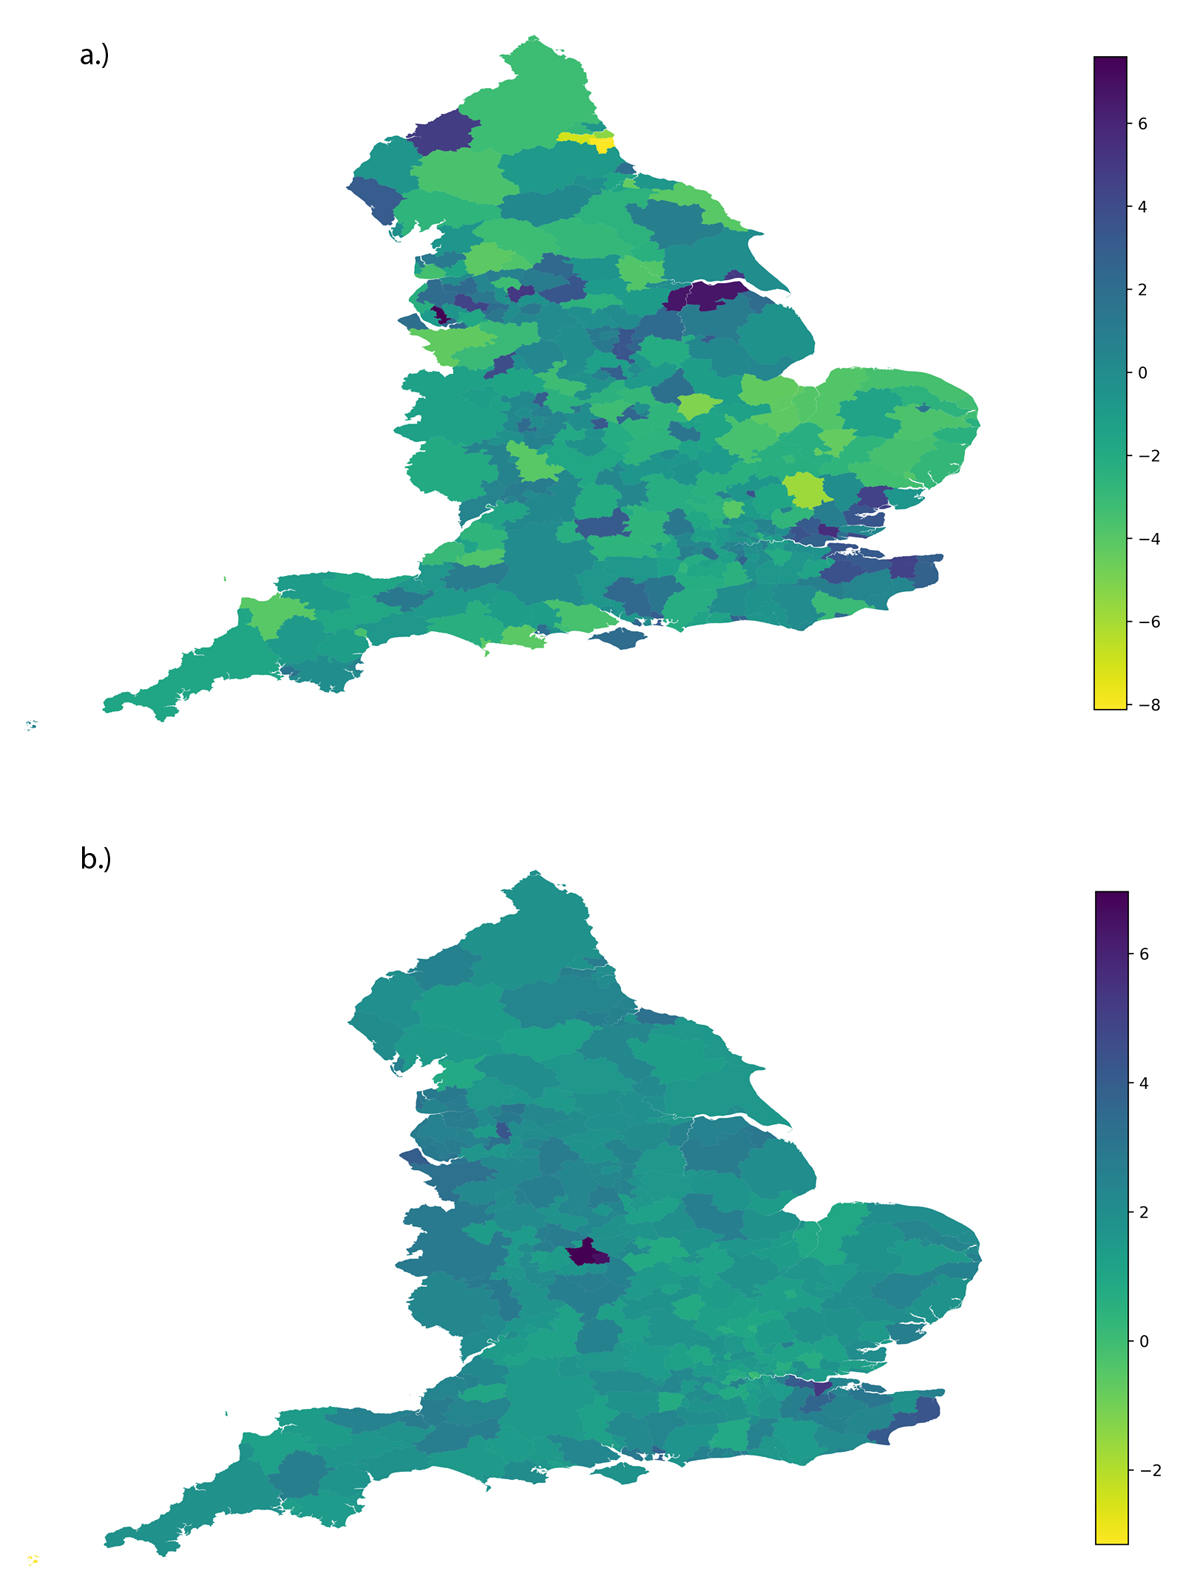
Figure 5
Median change in depression prevalence (%) at the local authority level for the periods 2011–19 (a) and 2019–22 (b).
4. Discussion
This paper links several open-source datasets at the LSOA level for England and provides an initial descriptive analysis. It builds on previous work that investigated subjective mental health within Greater London (Symonds et al. 2021). This work provides novelty since it links clinical mental health from the PLDR to housing data from EPCs, and other socio-demographic and environmental data for the whole of England. Given the large size of the linked dataset (N = 31,802), it can help provide new insights into the complex relationships between housing, socio-demographic, environmental and clinical mental health at the local area level. Since the data are geolocated, they can also be used to inform local authorities on where to provide additional mental health services or other preventative measures.
Preliminary analysis of the data presented in this paper revealed that there are statistically significant differences in SAMHI and depression prevalence between LSOAs with different mode EPC band. EPC band C has the highest average prevalence (7.6%) and lower prevalence was observed in bands B (7.2%) and E (7.0%). This finding adds to the existing literature that suggests that HEE can improve mental health through reductions of exposure to cold, damp and noise, and through reduced stress related to energy bills (Liddell & Guiney 2015; IEA 2019). In the UK, more affluent groups tend to live in older, less energy efficient homes (see the correlation of 0.24 between income deprivation score and median EPC rating in Appendix 1 in the supplemental data online; and a box plot showing EPC band versus income and education deprivation score in Appendix 6 online). This might account for the low levels of poor mental health for areas with mode EPC band E. Previous work has, however, shown that improved HEE can lead to increased exposure to indoor generated contaminants if compensatory ventilation is not installed (Hamilton et al. 2015). There is emerging evidence that air pollution exposure is linked to a range of mental health issues (Bhui et al. 2023).
Income and employment deprivation were found to be most strongly correlated with a localised clinical mental health index (SAMHI). This supports findings from previous research where the most deprived areas reported significantly higher levels of people experiencing mental health problems (Mind 2021). Age and gender were found to be less strongly correlated with SAMHI and depression prevalence. There is ongoing scientific debate about age as a determinant for mental health. Physical health co-morbidities and bereavement in older age may lead to higher levels of clinical mental health conditions. Some researchers suggest that age has a ‘U’-shaped relationship with mental wellbeing, with individuals reporting being happier in their 20s, decreasing in midlife, before rising in older ages (> 50) (Galambos et al. 2020). Ages of onset for different mental health conditions are shown to vary by condition, but typically develop earlier on in life, with the median for mood disorder at 30–35 years (Solmi et al. 2021). Areas with a higher proportion of females have been found to be weakly positively correlated with SAMHI and depression prevalence. This supports previous research that showed women to suffer more from internalising disorders such as anxiety and depression (Rosenfield & Mouzon 2013).
Some counter-intuitive results were observed for the environmental variables (PM10 and access to active green space). LSOAs with higher PM10 and a further average distance to active green space had a negative correlation with poor clinical mental health outcomes. This contradicts previous research that suggests that serious mental health problems are typically more common in urban areas, where one would expect high air pollution, noise and poor access to green space (Rautio et al. 2018; Gruebner et al. 2017). As with the HEE result, these findings should not be over-interpreted since confounding variables have not been adjusted for.
In relation to the changes in depression prevalence over the two study periods, increases in depression prevalence were found to be associated with income and education deprivation score for both study periods (austerity and COVID-19). The correlation with income deprivation was slightly higher (0.13) for austerity than for COVID-19 (0.07), whist it was the same (0.13) for education deprivation for both periods. The findings support evidence from the 2020 update of the Marmot review into health inequalities, which suggests that health inequity has widened over the decade since 2010 in the UK (Marmot 2020).
Another observation from the correlation analysis was that correlations for some variables were in different directions for the two periods. Taking the example of age (% > 65), there was a negative correlation (–0.12) with change in depression prevalence during austerity, which was reversed (0.12) during COVID-19. This finding indicates that these two periods may have different mental health outcomes for population subgroups. Research suggests that rates of anxiety and depression increased during the COVID-19 pandemic in older adults, with social isolation thought to have contributed to this fact (Webb & Chen 2022).
4.1 Limitations and future work
One of the key limitations of this analysis and the dataset is that it is at the LSOA level, rather than being more spatially resolved (e.g. household level). This meant that there is a lack of granularity in the data, resulting in there being no LSOAs with a mode EPC in A or F and lower statistics in EPC bands B and E. However, many of the open-source administrative datasets are provided at LSOA rather than postcode or individual dwelling level. Confidentiality and research ethics makes obtaining these data at higher resolution more difficult. The use of LSOA-level data also has the advantage that local areas where additional healthcare resources may be required can be identified. There are also issues with using EPCs which may not always be the most reliable data source and have higher coverage in urban areas (Taylor et al. 2019). Research has shown that the EPC ratings can be inaccurate at predicting operational energy consumption, with bands ≤ C over-predicting energy-use intensity (Few et al. 2023). EPC coverage and accuracy have been discussed previously by Symonds et al. (2021).
The use of clinical rather than self-reported mental health also needs consideration and may yield bias. More affluent areas are more likely to have better healthcare provisions and may use private healthcare, which is not captured by the SAMHI or depression prevalence metrics (Delgadillo et al. 2016). A recent review of evidence has shown that Black ethnic minority groups have less access to mental health services, despite being at a greater risk of mental ill-health (Bignall et al. 2020). Urban areas have also been shown to have better access to mental health services (Gruebner et al. 2017). For depression prevalence the denominator is number of people registered with a general practitioner, which has been shown to vary by local area (Baker 2016). Finally, for some population subgroups there may be more of a stigma around mental health and therefore people in these groups may be less likely to seek a diagnosis (Gary 2006). Findings should be complemented by analysis of self-reported health data from the 2021 Census (ONS 2023).
Another limitation of this study was that it was not possible to obtain all data from the same year. This is due to the ONS indices of deprivation data being only available for specific years (e.g. 2010, 2015 and 2019) (ONS 2019). This may bias the results, in particular the correlations between socio-demographic variables and changes in depression prevalence over the two study periods, since small areas may have undergone socio-demographic changes due to migration, ageing and area gentrification/decline. However, relative changes in neighbourhood deprivation are expected to be relatively small (ONS 2019).
Future work can build on this preliminary analysis and combine additional datasets. For example, data on the clinical diagnosis of chronic obstructive pulmonary disease (COPD), coronary heart disease (CHD) and other health conditions are also available. Changes over different time periods may also be investigated, such as during the cost-of-living crisis when 2023–24 data become available. Data on ethnicity have not yet been included within this analysis, which the authors plan to include in future. Additional environmental factors such as noise and daylighting may also be considered. A more robust statistical analysis can also be conducted to understand better the relationship between energy efficiency and mental health, where interactions with confounding socio-economic factors such as income are accounted for.
4.2 Implications of research
The presence of correlated spatial differences in EPC ratings and mental health metrics suggests that these linked datasets could be a useful source for investigating the association between HEE and mental health. In future, this could provide valuable evidence for the potential for mental health co-benefits of HEE improvement policies. Quantification of co-benefits would add support to the case for HEE improvement nationally. This is highly relevant to current government policy, e.g. the UK national and Welsh devolved governments have targets to ensure that:
as many fuel poor homes as is reasonably practicable achieve a minimum energy efficiency rating of Band C, by 2030.
Further analysis of these data may help strengthen the case for the implementation of the forthcoming Net Zero Carbon Buildings within The Future Homes and Buildings Standards (NZCBuildings Partnership 2024; HM Government 2023b). This may help inform changes to approved documents and building regulations.
This paper also demonstrates widening inequalities in mental health between high- and low-income areas. Geographical inequalities in mental health are illustrated using GIS to map changes in depression prevalence at the local authority level. Over the COVID-19 study period (2019–22), the largest deteriorations in clinical mental health were in the Midlands and coastal South. This information may be used by national and local governments to allocate funds for mental health services where it is required more.
5. Conclusions
Mental health inequity is a growing problem worldwide that urgently needs addressing. This paper links clinical mental health metrics at the local area level with housing, socio-demographic and environment data for England. The linked dataset can help researchers to better understand the complex interlinkages between these factors. It also provides a useful resource for policymakers and practitioners to make decisions about where resources for mental health support should be allocated. Preliminary analysis of the data revealed a socio-economic gradient with mental health metrics which has widened during austerity (2011–19) and the COVID-19 pandemic (2019–22). Mental health was observed to be non-linear with Energy Performance Certificate (EPC) band, with higher rates of depression prevalence in bands C and D compared with B and E. Further statistical analysis is required to establish whether this is a result of confounding factors or bias in the data.
Acknowledgements
The authors acknowledge the contribution of Zaid Chalabi, who provided useful insights into the statistical analysis performed in this paper. We are very grateful for his time and expertise.
Competing interests
The authors have no competing interests to declare. The guest editors (Anna Mavrogianni and Marcella Ucci) were recused from editorial decisions on this manuscript to avoid any competing interest from arising.
Data accessibility
The data that support the findings of this study are openly available on figshare at: https://doi.org/10.6084/m9.figshare.26964265/.
Funding
This research received no specific grant from any funding agency in the public, commercial or not-for-profit sectors.
Supplemental data
Supplemental data for this article can be accessed at: https://doi.org/10.5334/bc.424.s1