
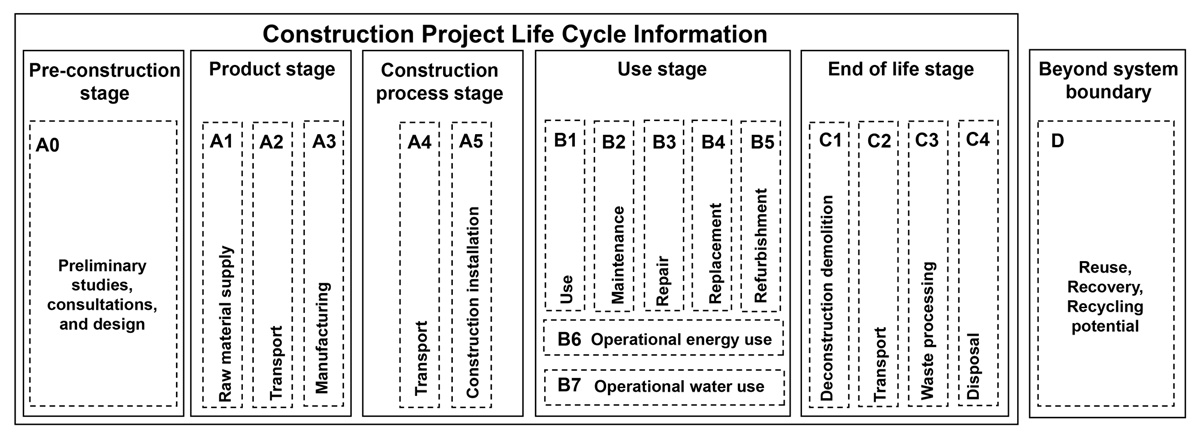
Figure 1
Building project life-cycle stages. Source: Crawford, Stephan, & Prideaux (2019), based on EN 15978:2011 and EN 15643-5:2017.
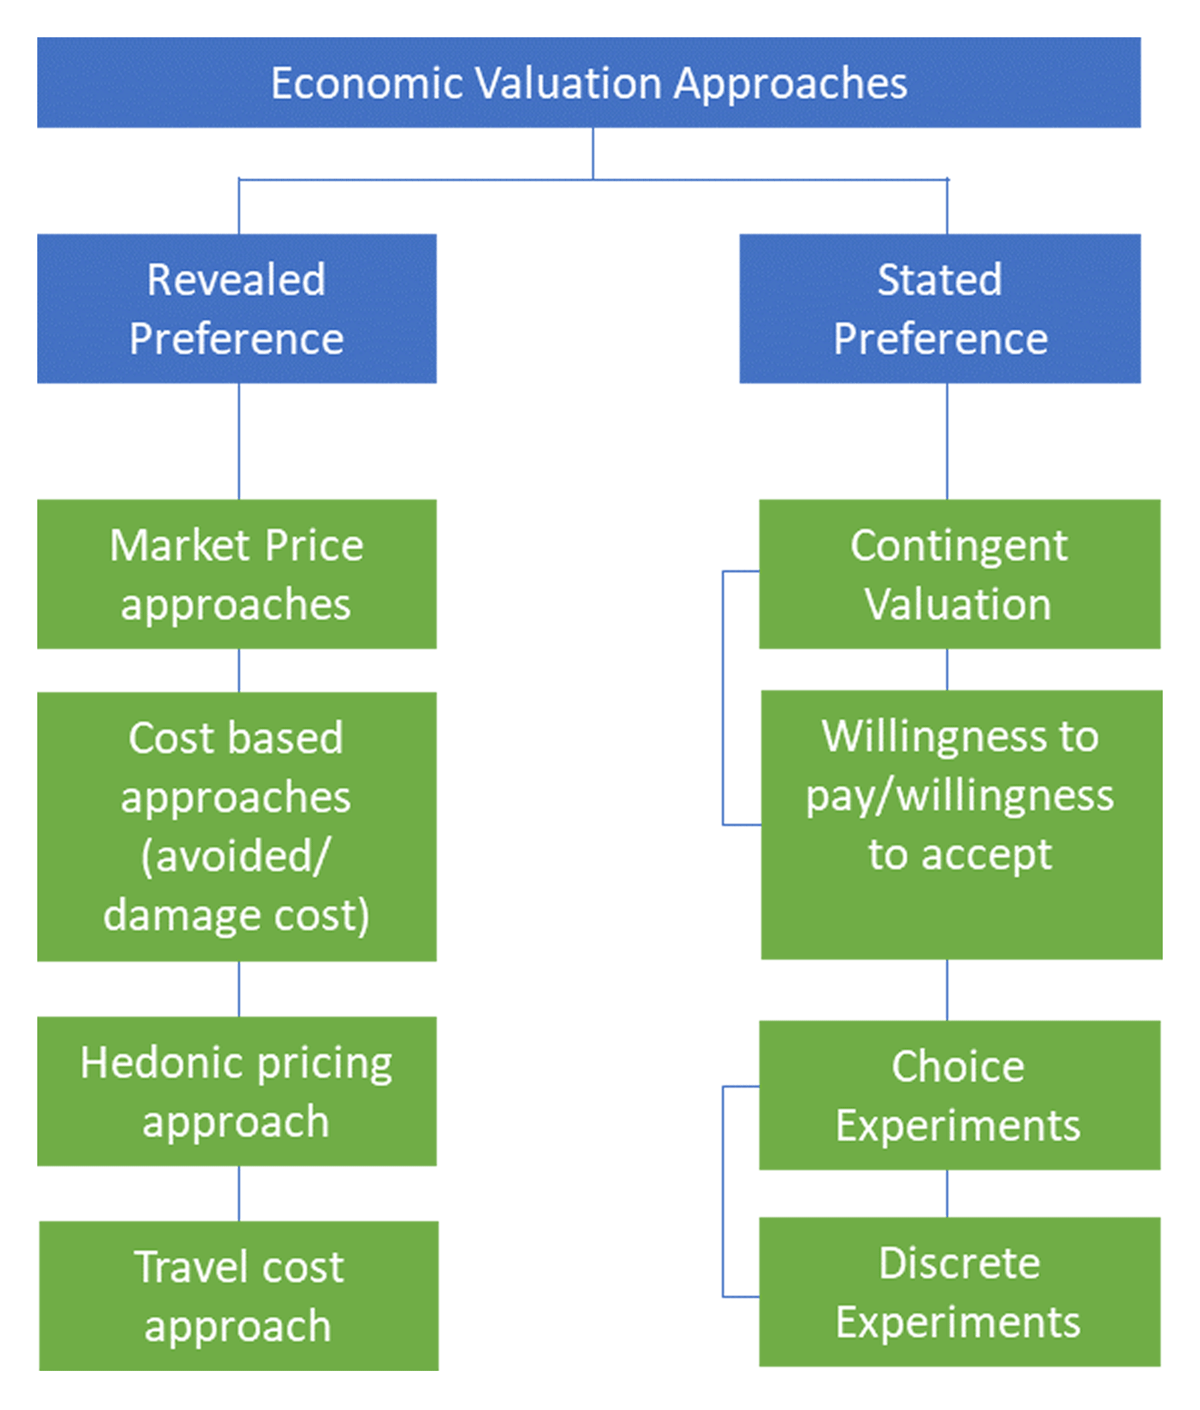
Figure 2
Economic valuation approaches.
Table 1
Advantages and disadvantages of economic valuation approaches.
| Approach | Advantage | Disadvantage |
|---|---|---|
| Market price approach | Market data available and robust. Uses standard, accepted economic techniques | Value of emissions might not represent the social cost of climate change. Limited to market goods and services |
| Cost-based approach | Good for assessing the outcomes of mitigation options to inform related policy decisions | Lack of transparency when it comes to the use of integrated assessment models. There are different assumptions and has a ‘black box’ nature |
| Hedonic pricing approach | Versatile and can be adapted to consider several possible interactions between market goods and environmental quality | Relatively complex to implement and interpret, requiring a high degree of statistical expertise |
| Travel cost approach | Based on actual behaviour, and therefore more reliable than methods based on the hypothetical behaviour of the respondents | Limited in its scope of application because it requires user participation. Cannot be used to measure non-use values |
| Contingent valuation | Can capture all use and non-use values. The use of surveys enables an estimation of hypothetical changes and their impact before they have taken place | Potential bias in response. Hypothetical market (not observed behaviour); resource intensive |
| Choice experiments | Use of surveys enables the collection of relevant socioeconomic and attitudinal data on the respondents that could be relevant for understanding the variables influencing social preferences and choices | Complex questionnaire development and data analysis. Budget and time demands are high |
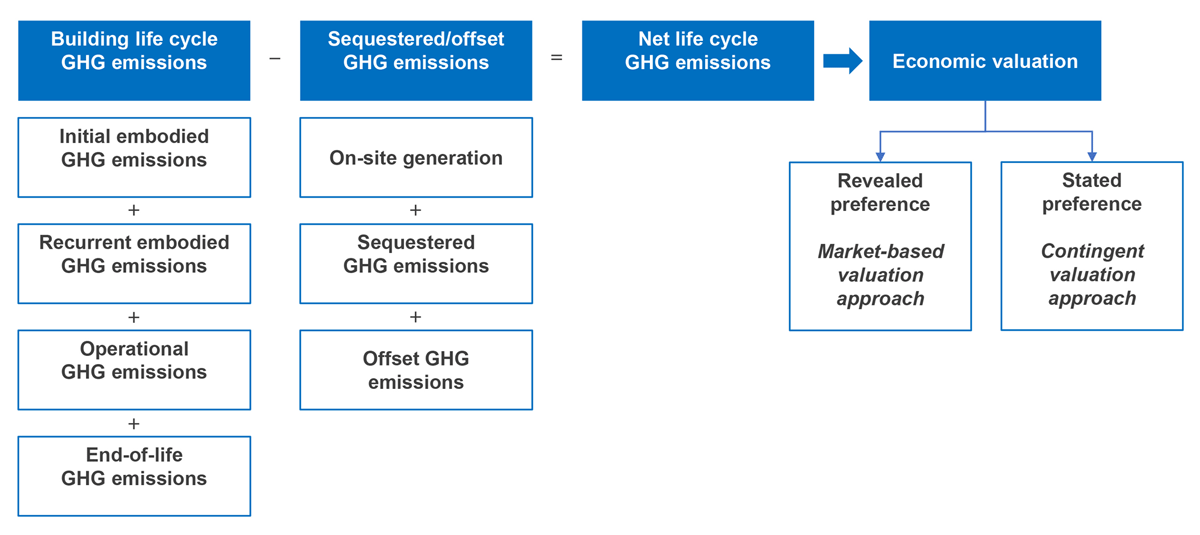
Figure 3
Key elements of the conceptual approach.
Table 2
Characteristics of the case study building.
| Building item | Detail | Building item | Detail |
|---|---|---|---|
| Gross floor area (m2) | 230 | External wall material | Brick veneer with 90 mm timber frame |
| Ceiling height (m) | 2.4 | Roof material | Concrete tile with timber truss |
| Number of bedrooms | 4 | Window material | Single glazed with aluminium frame |
| Length × width (m) | 19.7 × 14.8 | Floor material | Concrete waffle pod slab |
| Heating | 3-star gas-ducted heating unit | Insulation | Wall: R2 Glasswool batt; ceiling: R4 Glasswool batt |
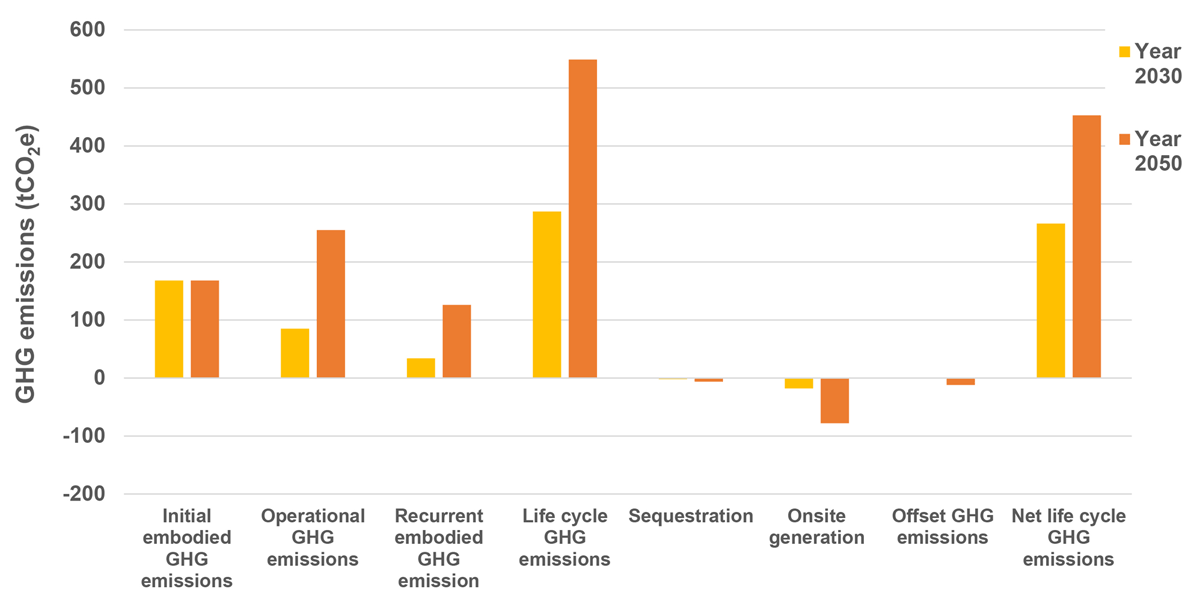
Figure 4
Total life-cycle greenhouse gas (GHG) emissions for case study building to 2030 and 2050.
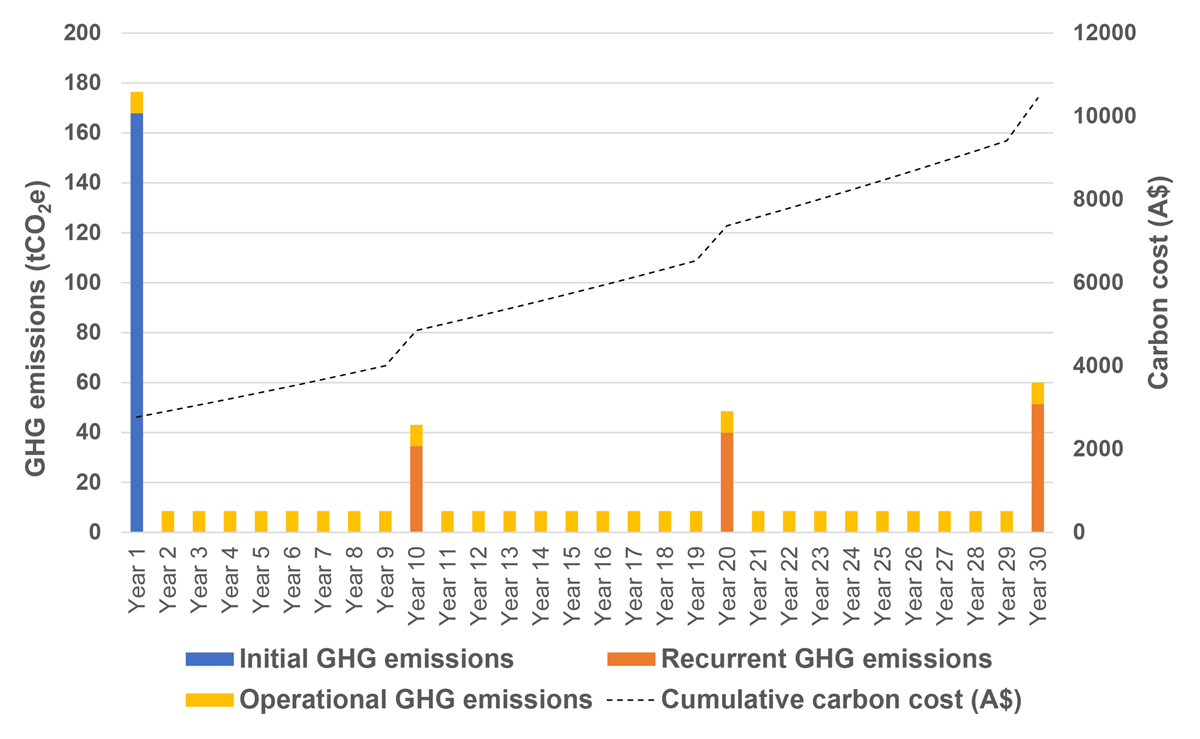
Figure 5
Cumulative carbon cost of case study dwelling.
Table 3
Economic assessment of the life-cycle greenhouse gas (GHG) emission costs for the case study building using the capitalisation approach.
| Description | Method | 2030(10 years) | 2050(30 years) |
|---|---|---|---|
| Capitalised value of GHG emission costs: GHGCV | Annual net GHG emissions multiplied by the carbon price capitalised, plus initial and recurrent embodied GHG emissions multiplied by the carbon price | A$5854 | A$6767 |
| Annualised capitalised costs: GHGCpa | Total costs over a period are then annualised to provide an annual payment amount (2% discount rate) | A$652 | A$302 |
Table 4
Economic assessment of the life-cycle greenhouse gas (GHG) emission costs for a case study building using a cash flow approach.
| Description | Cashflow treatment | 2030(10 years) | 2050(30 years) |
|---|---|---|---|
| PV of life-cycle GHG emissions: GHGCPV | PV of cashflows (GHG emissions × carbon price) | A$4652 | A$7860 |
| Annualised PV of life-cycle GHG emissions: GHGCcfpa | Annualised cost over the time period—discounted | A$518 | A$351 |
[i] Note: PV = present value.