
Table 1
CO2 emissions from the UK electricity supplied, 2015–17.
| Fuel | Emissions (tonnes CO2/GWh electricity supplied) | ||
|---|---|---|---|
| 2015 | 2016 | 2017 | |
| Coal | 909 | 931 | 918 |
| Gas | 382 | 378 | 357 |
| All fossil fuels | 625 | 497 | 460 |
| All fuels (including nuclear and renewables) | 335 | 265 | 225 |
[i] Source: BEIS (2018b).
Table 2
Estimated UK greenhouse gas (GHG) emissions attributable to heating, 2016.
| End use | UK GHG emissions from heating | |
|---|---|---|
| % of total UK emissions | tonnes CO2e/GWh heat supplied | |
| Space heating | 17 | 183 |
| Hot water | 4 | 189 |
| Cooking | 2 | 242 |
| Industrial processes | 14 | 442 |
Table 3
Locations, temperatures and electricity grid carbon intensities (CIs) (ordered by latitude).
| City | Latitude (°N) | Country | Mean annual insolation(kWh/m2horizonatal) | Mean annual temperature (°C) | National electricity grid CI (kg CO2e/kWh)a |
|---|---|---|---|---|---|
| Macapa | 0.04 | Brazil | 1700 | 26 | 0.087 (low) |
| Mumbai | 19 | India | 2100 | 27 | 1.003 (high) |
| Athens | 38 | Greece | 1600 | 19 | 0.876 (high) |
| Carcassonne | 43 | France | 1300 | 13 | 0.078 (low) |
| Seattle | 48 | United States | 1200 | 9 | 0.610 (high) |
| Oslo | 60 | Norway | 1000 | 5 | 0.003 (low) |
[i] Source: a IPCC (2005).
Table 4
Standard Building Model (SBM) building object features and characteristics.
| Input variable feature | Feature characteristic |
|---|---|
| Building object location (location groupings by latitude; climate; electricity grid carbon intensity) | Macapa (low; hot; low) |
| Mumbai (low; hot; high) | |
| Athens (intermediate; mild winter/hot summer; high) | |
| Carcassonne (intermediate; mild winter/hot summer; low) | |
| Seattle (high; mild winter/warm summer; high) | |
| Oslo (high; severe winter/warm summer; low) | |
| Wall construction material | Brick |
| Straw (assessment includes carbon sequestration) | |
| Straw (assessment excludes carbon sequestration) | |
| Assessment boundary | Operational only |
| Operational plus embodied | |
| Assessment balance period | Annual |
| Monthly | |
| Infiltration level (air changes per hour at normal pressure) | 0.042 (MVHR included in embodied assessment boundary)a |
| 0.700 (no MVHR) | |
| 0.343 (no MVHR) | |
| Occupancy density (m2/person) | No occupants |
| 35 | |
| 20 | |
| Photovoltaic (PV) specification | Low embodied metrics (149 kg CO2e/m2PV/241 kWh/m2PV) (Mann et al. 2014) |
| High embodied metrics (953 kg CO2e/m2PV/318 kWh/m2PV) (Nawaz & Tiwari 2006) | |
| Glazing U-value (W/m2K) | 1.4, 0.8, 0.68 |
| Wall U-value (W/m2K) | 0.10, 0.12, 0.15, 0.18 |
| Glazing (%) | 10%, 20%, 40% and 80% of the external walls |
| Footprint (m2) | 45–450 m2 in steps of 45 m2 |
| Width (m) | Valid building widths were calculated using aspect ratios 1.0, 0.5, 0.25 and 0.125 and: |
| Number of storeys | 1, 2, 4, 8, 16 and 32 storeys, with the same limitation on aspect ratios as above |
[i] Note: a MVHR, mechanical ventilation with heat recovery.
Table 5
Breakdown of total Standard Building Model (SBM) building object population, and resulting zero-carbon buildings (ZCBs) and zero-energy buildings (ZEBs), by location.
| Location | Total SBM building objects … | of which ZCBs | of which ZEBs |
|---|---|---|---|
| Macapa | 2,056,320 | 1,481,073 | 793,810 |
| Mumbai | 2,056,320 | 679,762 | 766,178 |
| Athens | 2,056,320 | 812,869 | 766,803 |
| Carcassonne | 2,056,320 | 1,586,597 | 775,284 |
| Seattle | 2,056,320 | 1,041,562 | 690,297 |
| Oslo | 2,056,320 | 1,608,924 | 439,267 |
| Total | 12,337,920 | 7,210,787 | 4,231,639 |
| OR = 1 | A ZCB is equally likely to occur in both groups |
| OR > 1 | A ZCB is more likely to occur in the first group |
| OR < 1 | A ZCB is more likely to occur in the second group |
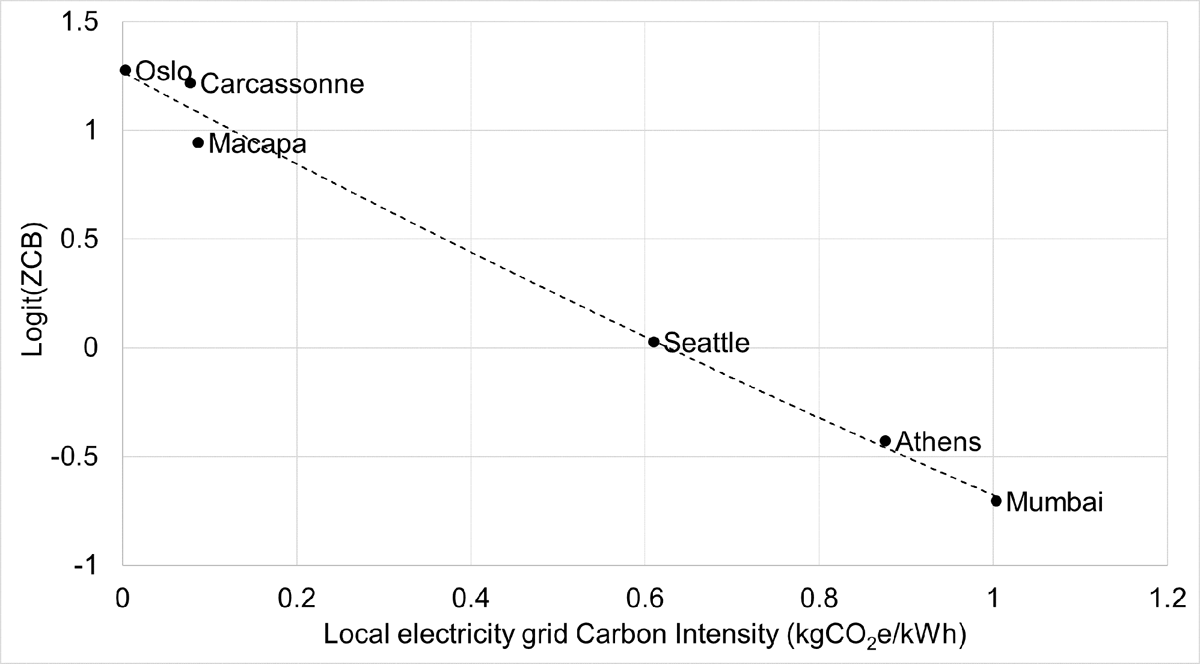
Figure 1
Relationship between logit(ZCB) and local electricity grid carbon intensity (CI).
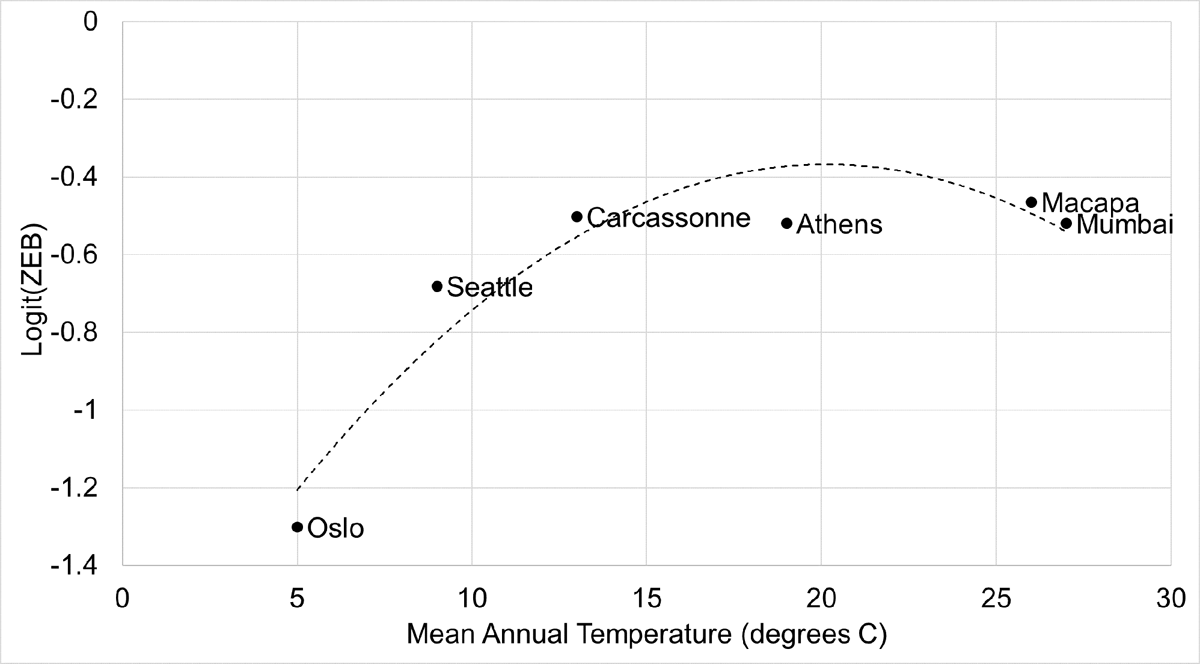
Figure 2
Relationship between logit(ZEB) and mean annual temperature.
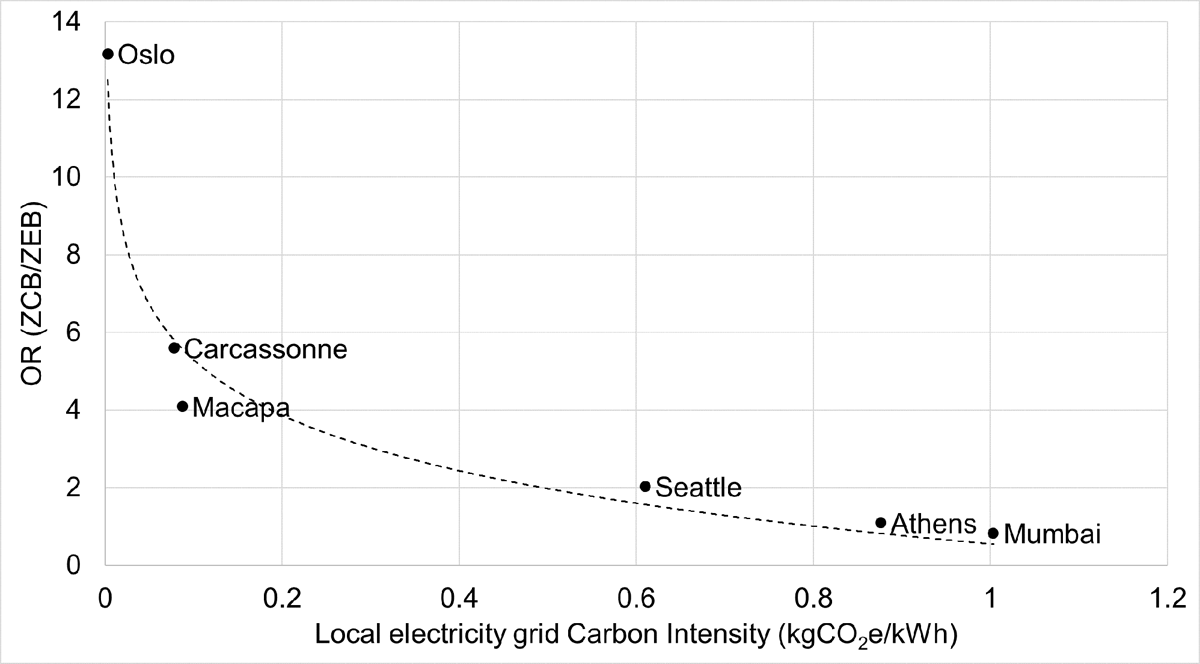
Figure 3
Relationship between OR(ZCB/ZEB) and electricity grid carbon intensity (CI).