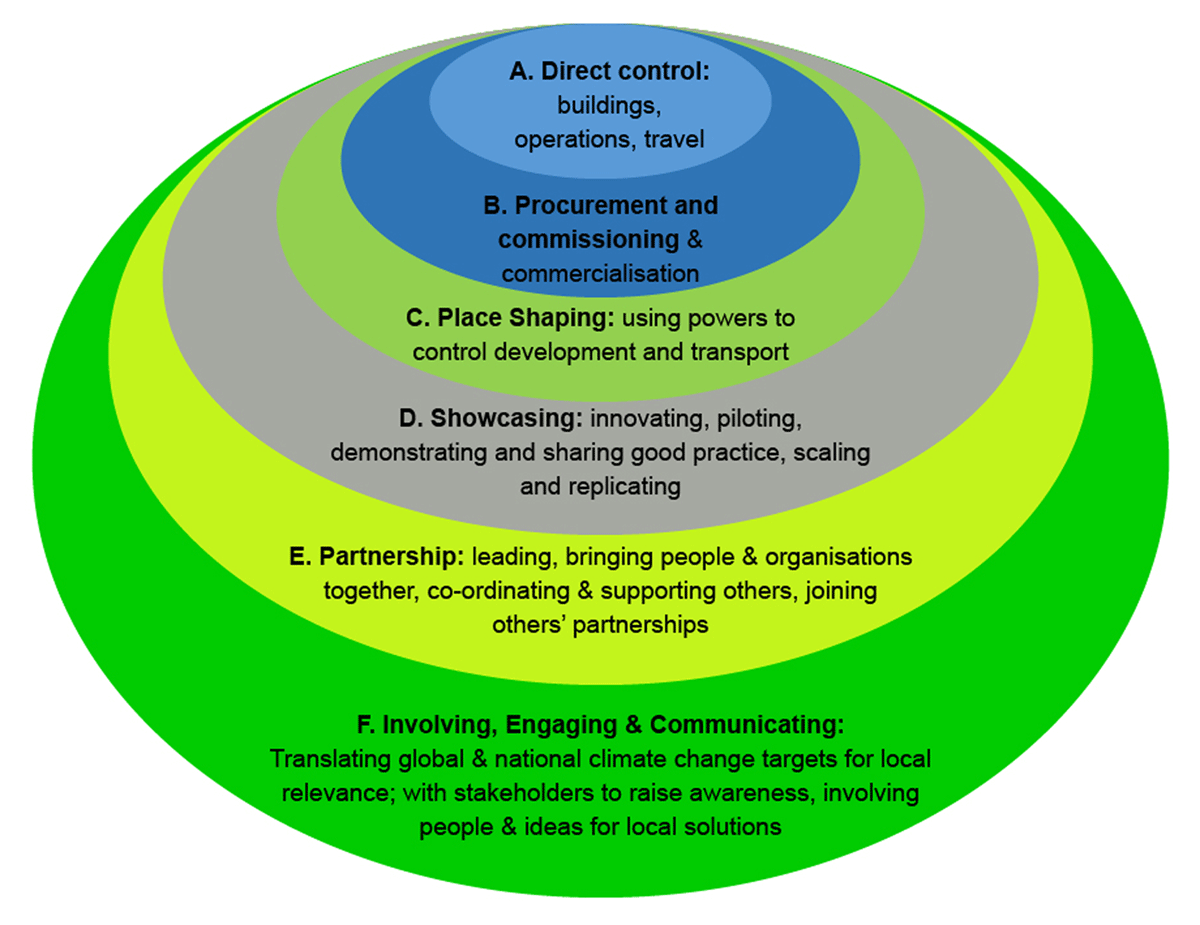
Figure 1
‘Onion’ diagram: the layers of local authority control and influence on greenhouse gas (GHG) emission reductions.
Source: CCC (2020a: 5).

‘Onion’ diagram: the layers of local authority control and influence on greenhouse gas (GHG) emission reductions.
Source: CCC (2020a: 5).
© 2022 Katherine Sugar, Tedd Moya Mose, Colin Nolden, Mark Davis, Nick Eyre, Albert Sanchez-Graells, Dan Van der Horst, published by Ubiquity Press
This work is licensed under the Creative Commons Attribution 4.0 License.