
| BoQ | Bill of quantities |
| C&D | Construction and demolition |
| CEN | European Committee for Standardisation |
| CIBSE | Chartered Institution of Building Services Engineers |
| CPWD | Central Public Works Department |
| DGU | Double-glazed unit |
| DOAS | Dedicated outdoor air system |
| ECBC | Energy Conservation Building Code |
| EIO LCA | Economic input–output life cycle assessment |
| EPD | Environmental product declaration |
| EUI | Energy-use intensity |
| GHG | Greenhouse gas |
| GWP | Global warming potential |
| HVAC | Heating, ventilation and air-conditioning (HVAC) |
| IEA | International Energy Agency |
| ISO | International Organization for Standardization |
| LCA | Life cycle assessment |
| LCI | Life cycle inventory |
| LPD | Lighting power density |
| NZEB | Net-zero energy building |
| Pu | Percentage uncertainty |
| PV | Photovoltaic |
| PVC | Polyvinyl chloride |
| SETAC | Society of Environmental Toxicology and Chemistry |
| SHGC | Solar heat gain coefficient |
| uPVC | Unplasticised polyvinyl chloride |
| VLT | Visible light transmission |
| VRV | Variable refrigerant volume |
Table 1
Building information and specifications about the net-zero energy building (NZEB) at CEPT University.
| Location | Ahmedabad, Gujarat, India | ||
| Year of construction | 2015 | ||
| Inhabitation | 2016 onwards | ||
| Emission factor (thermally powered city grid) | 1.9 kgCO2e/kWha | ||
| Climate zone | Hot dry (BIS 2016) | ||
| Area | 515 m2 | ||
| Aspect ratio | 3:1 (east–west:north–south) | ||
| Building envelope | U-value | Wall | 0.42 W/m2K |
| Roof | 0.38 W/m2K | ||
| Window | 1.7 W/m2K | ||
| Glass VLT | 39% | ||
| Glass SHGC | 0.29 | ||
| On-site renewables | Photovoltaic (PV) | Type | Polycrystalline PV array |
| Capacity | 30 kWp | ||
| Usage | 100% Electricity exported | ||
| Emission factor | 0.006 kgCO2e/kWh (Prasad et al. 2021) | ||
| Lighting | LPD | 2.7 W/m2 | |
| Heating, ventilation and air-conditioning (HVAC) | VRV | Cooling capacity | 2.8 kW × 6 |
| Cooling capacity | 5.6 kW × 2 | ||
| Radiant pump | 1.5 kW (400 V) | ||
| Chiller | Refrigerant | R-410A | |
| Cooling capacity | 14.7 kW | ||
| DOAS—outdoor unit | Refrigerant | R-410A/12 kg | |
| Cooling capacity | 9 kW | ||
| DOAS—heat recovery system | DOAS 590/1780 | ||
[i] Note: a The emission factor of 1.9 kgCO2e/kWh was calculated based on data sourced from the Ecoinvent database. It includes carbon dioxide (1.2 kgCO2/kWh), methane (0.01 gCH4/kWh) and nitrous oxide (2.37 gN2O/kWh) emissions. The three GHGs were converted into carbon equivalents using a global warming potential (GWP)100 of 1, 34 and 298, respectively. DOAS = dedicated outdoor air system; LPD = lighting power density; VLT = visible light transmission; SHGC = solar heat gain coefficient; VRV = variable refrigerant volume.
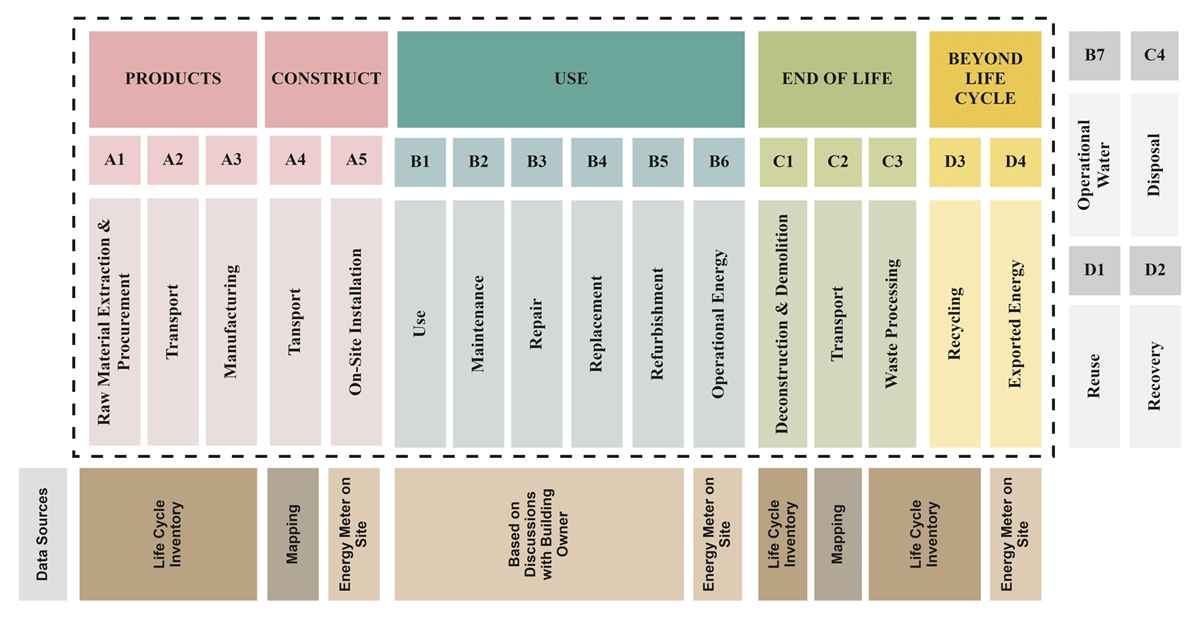
Figure 1
System boundary of the life cycle assessment (LCA) conducted for the net-zero energy building (NZEB) (inside the black dashed line) along with its different data sources.
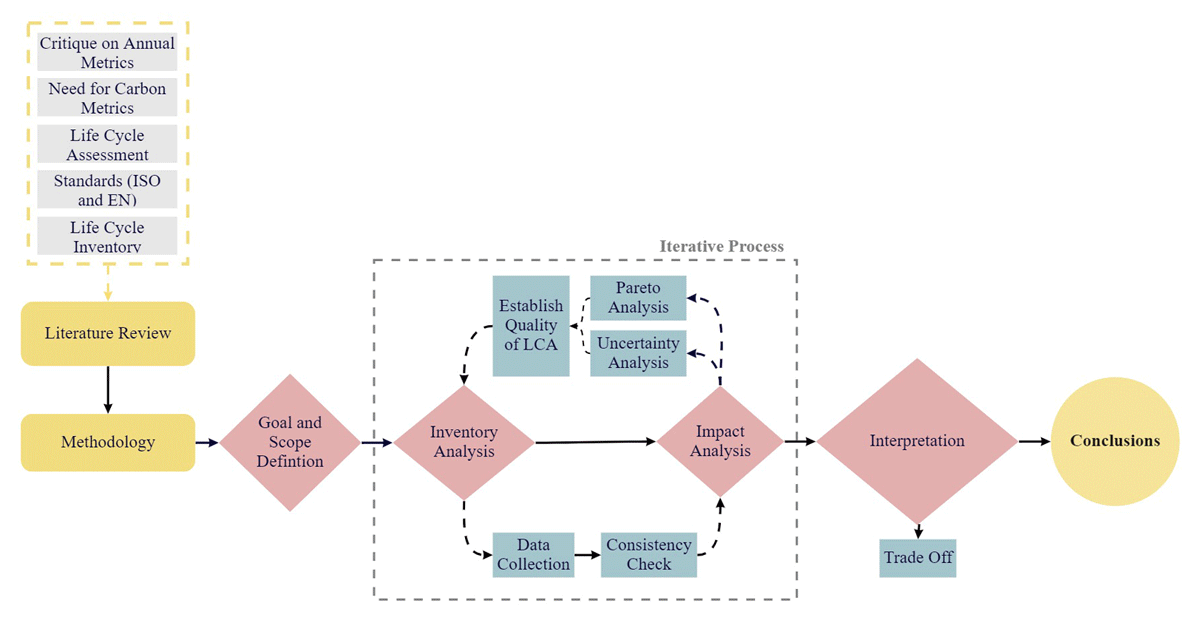
Figure 2
Overview of the research methodology with identification of the iterative processes (inside the grey dashed line) that are crucial for maintaining data quality and the reliability of the results.
Note: Modules B7, C4, D1 and D2 are out of the scope of the life cycle assessment (LCA).
Sources: Adapted from CEN (2011); Fufa et al. (2016); ISO (2006b); Klöpffer & Grahl (2014); and Lützkendorf & Frischknecht (2020).
Table 2
Factors for estimating emissions during use (B1–B5).
| B1 USE | B2 MAINTENANCE | B3 REPAIR | B4 REPLACEMENT | B5 REFURBISHMENT | |
|---|---|---|---|---|---|
| Calculation basis | Emission factor for rooftop PVs | Percentage of A1–A5 emissions | Percentage of A1–A5 emissions | Percentage of A1–A5 emissions | Percentage of A1–A5 emissions |
| Frequency | Every year | Every year | Every 5 years | Every 20 years | Every 10 years |
| Structural | 0 | 0.0% | 1% | 0 | 0 |
| Envelope | 0 | 0.1 % | 1% | 0 | 0 |
| Finishing | 0 | 0.1% | 1% | 0 | 100% for paints only |
| Electrical | 0 | 0.2% | 2% | 0 | 0 |
| Heating, ventilation and air-conditioning (HVAC) | Measurement of emissions due to the leakage of refrigerants was out of scope | 0.5% | 5% | 2036: 100% 2056: 1% | 0 |
| Photovoltaic (PV) | 0.006 kgCO2e/kWha (Prasad et al. 2021) | 0.2% | 2% | 2036: 100% 2056: 1% | 0 |
[i] Note: a Grid-connected PV arrays involve electrical wiring, inverters, meters and other components. For rooftop arrays in India, such arrays are responsible for generating 0.006 kgCO2e of emissions for every kWh of electricity generated (Prasad et al. 2021).
Sources: Chaturvedi (2021); Chaturvedi & Malyan (2021); CPWD (2019a, 2019b, 2019c); Ghosh (2020).

Figure 3
Yearly emissions from the building along with net emissions (black line) show four instances of a negative impact in the whole lifespan.
Note: Negative values on the y-axis indicate avoided emissions.
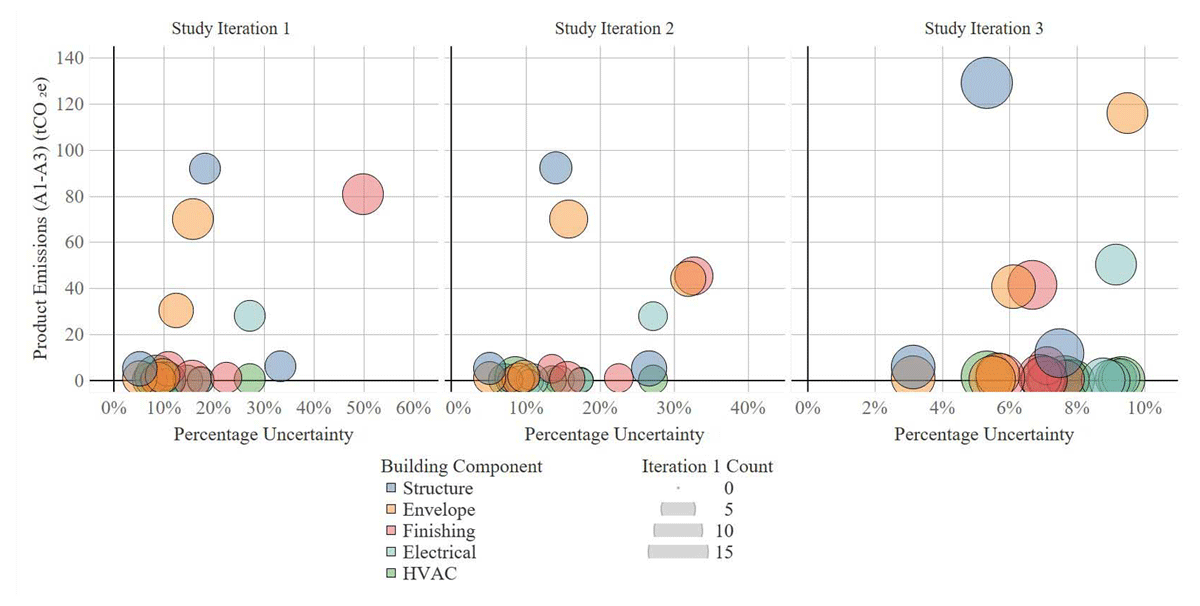
Figure 4
Uncertainty analysis was performed for each iteration of the study.
Note: Low percentage uncertainties were ensured through an increase in the number of data sources.
Sources: Cherubini et al. (2018); Huijbregts (1998); and Igos et al. (2019).
Table 3
Scoring of data sources based on data quality indicators.
| SCORE | 1 | 2 | 3 | 4 | 5 |
|---|---|---|---|---|---|
| Source of data | Life cycle database or company data or EPDs | Peer-reviewed journal paper | Government report or conference paper | All other sources | – |
| Stages of life cycle: Phase 1 | Raw material extraction to manufacturing | Raw material extraction and manufacturing | Raw material extraction or manufacturing | – | – |
| Category indicator used | kgCO2e | kgCO2a | kWh or MJb | – | – |
| Data age | Up to 3 years before or after 2015 | Up to 5 years before or after 2015 | Up to 10 years before or after 2015 | Up to 15 years before or after 2015 | Up to 20 years before or after 2015 |
| Geographical coverage | Ahmedabad or Gujarat | India | South Asia | Asia | World |
[i] Notes: a Assumed emissions for all other greenhouse gases are negligible.
b Characterization factor of 1.90 kgCO2e/kWh used to convert data for coal-based power generation in Gujarat (as per the Ecoinvent Database).
EPDs = environmental product declarations.
Source: Adapted from Weidema & Wesnæs (1996).

Figure 5
Emissions for each material during the different phases (A–D) of the building’s lifespan show that some materials and phases have significantly higher emissions than others.
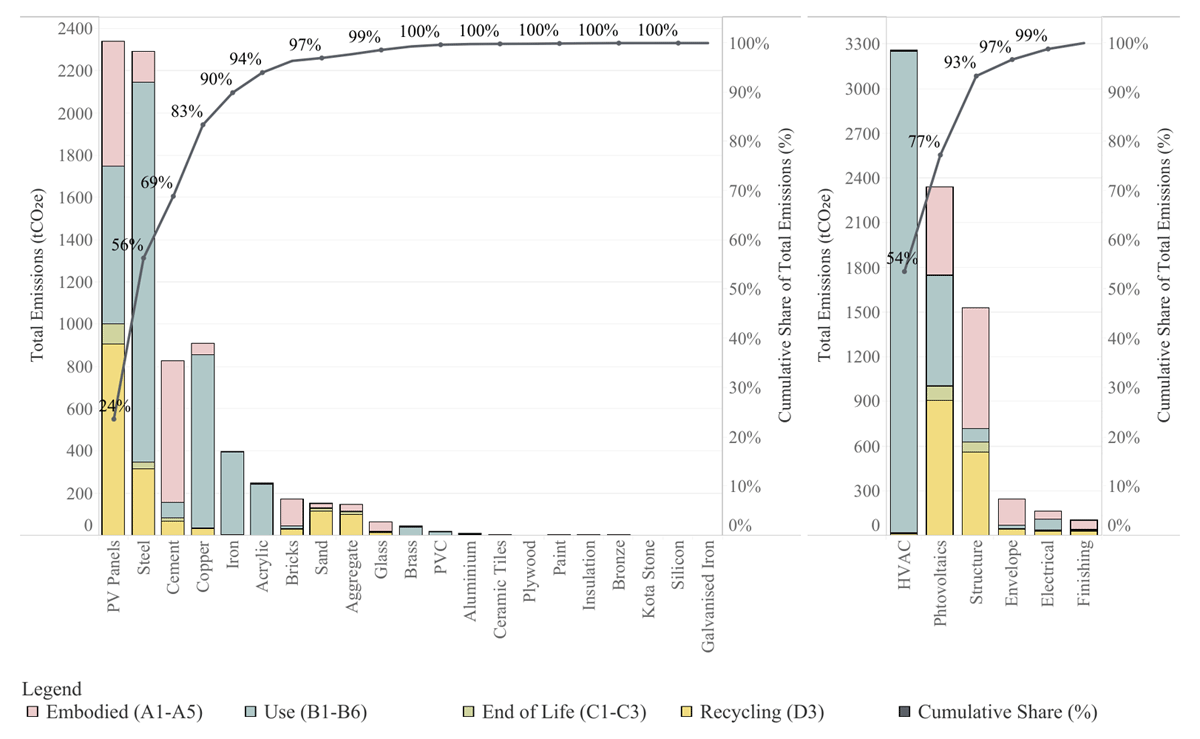
Figure 6
Pareto analysis showing emissions on the primary axis and the cumulative share of emissions on the secondary axis.
Note: Photovoltaic (PV) panels and steel contribute to 56% of the total impact. Emissions avoided (D4) have been deliberately left out of this analysis.
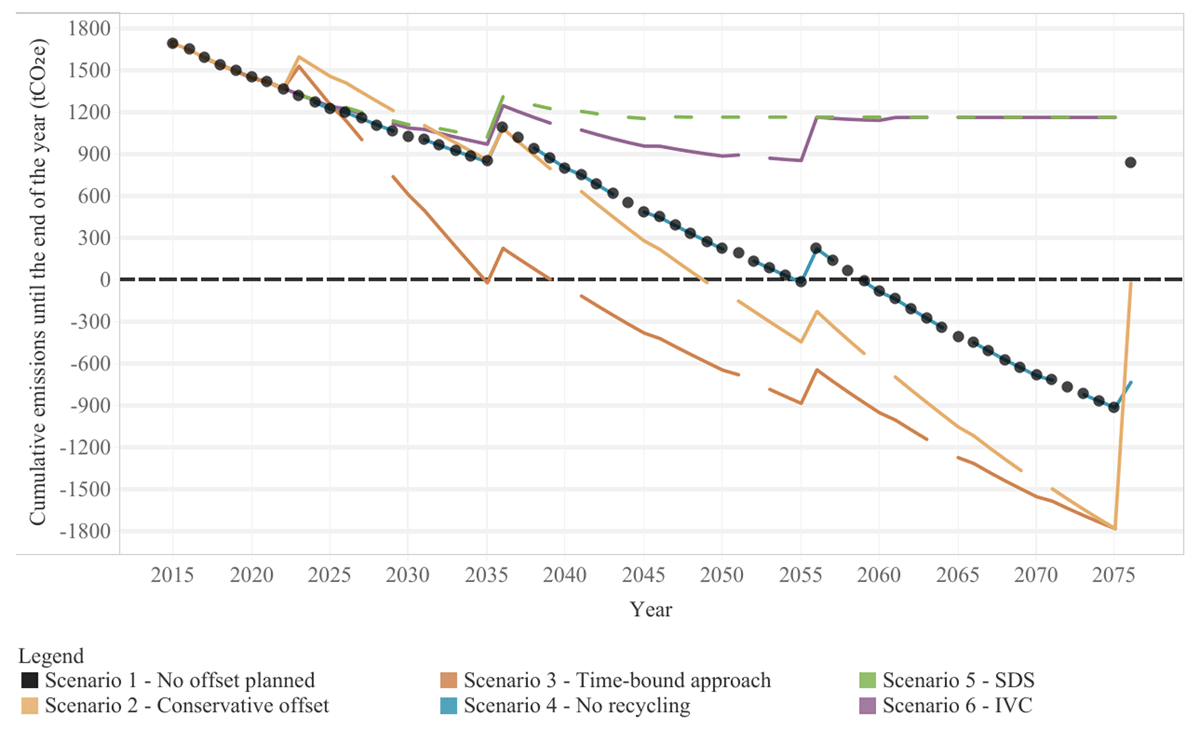
Figure 7
Cumulative emissions indicate the carbon offset required at the end of every year under different scenarios.
Note: Scenario 1 is the existing case where no offset measure is implemented and the building runs in the as-is condition. This can be used as a baseline for comparison.
Source: Adapted from Georges et al. (2014).
Table 4
Total and net emissions of the building during each phase.
| PHASES | MODULES | EMISSIONS (tCO2e) (X) | SHARE OF EMISSIONS (A1–D4) (%) | AVOIDED EMISSIONS (tCO2e) (Y) | NET EMISSIONS (tCO2e) (Z = X – Y) | NET EMISSIONS (tCO2e/m2) (M = Z/515) | NET EMISSIONS (kgCO2e/m2yr) (N = M/60*1,000) |
|---|---|---|---|---|---|---|---|
| Product and construction | A1–A5 | 1,695.6 | 22% | 0.0 | 1,695.6 | 3.3 | 54.9 |
| Use | B1–B6 | 4,174.1 | 55% | 0.0 | 4,174.1 | 8.1 | 135.1 |
| End of life | C1–C3 | 180.4 | 2% | 0.0 | 180.4 | 0.4 | 5.8 |
| Beyond life cycle | D3–D4 | 1,577.1 | 21% | 6,761.4 | –5,184.3 | –10.1 | –167.8 |
| Total (cradle to cradle) | A1–D4 | 7,627.2 | 100% | 6,761.4 | 865.8 | 1.7 | 28.0 |
| Total (cradle to grave) | A1–C3 | 6,050.1 | – | 0.0 | 6,050.1 | 11.7 | 195.8 |
| Total (cradle to grave + exported) | A1–C3 + D4 | 6,050.1 | – | 6761.4 | –711.3 | –1.4 | –23.0 |