

Figure 1
Overview of integrated modeling framework workflow: grey boxes and dashed lines indicate future work.
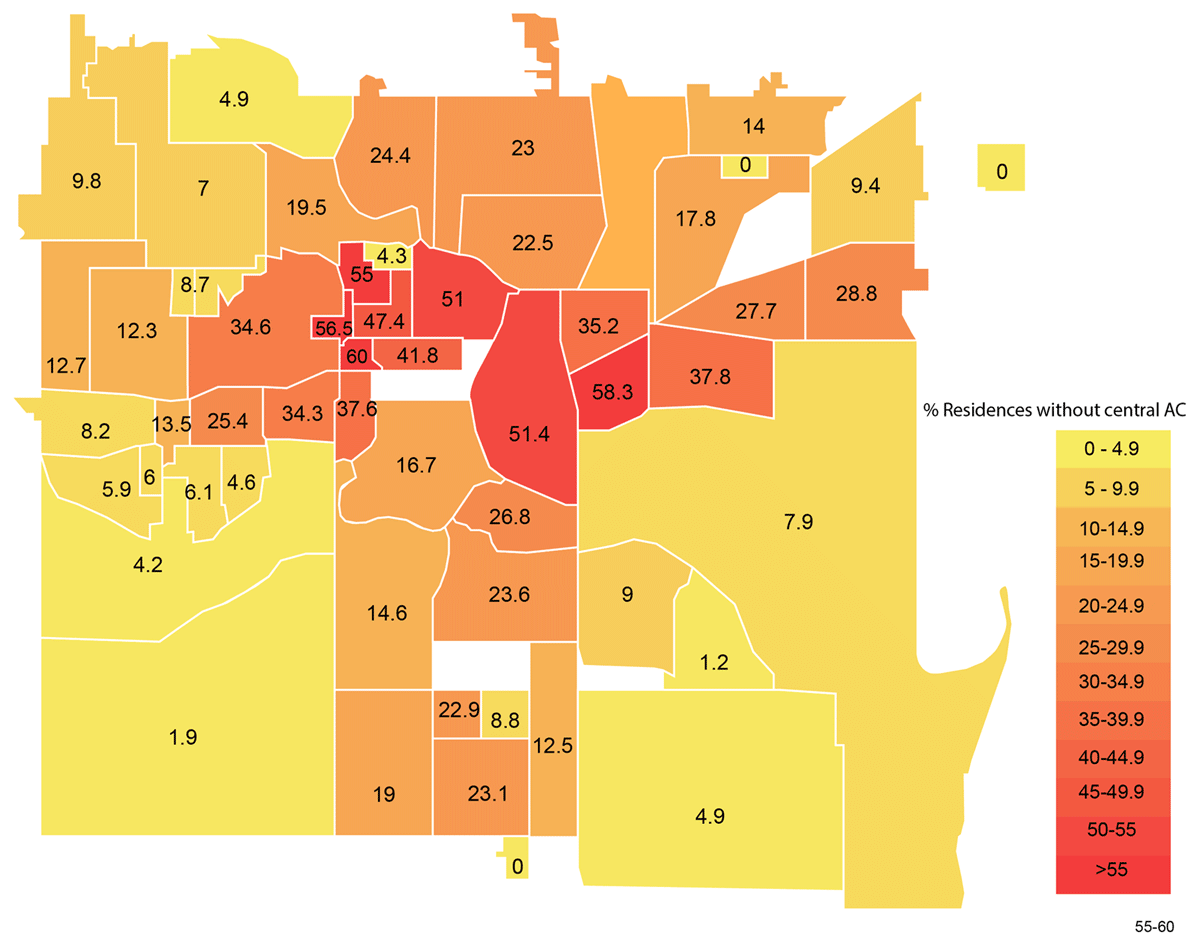
Figure 2
Percentage of homes without central air-conditioning (AC) in different neighbourhoods in Des Moines, Iowa.
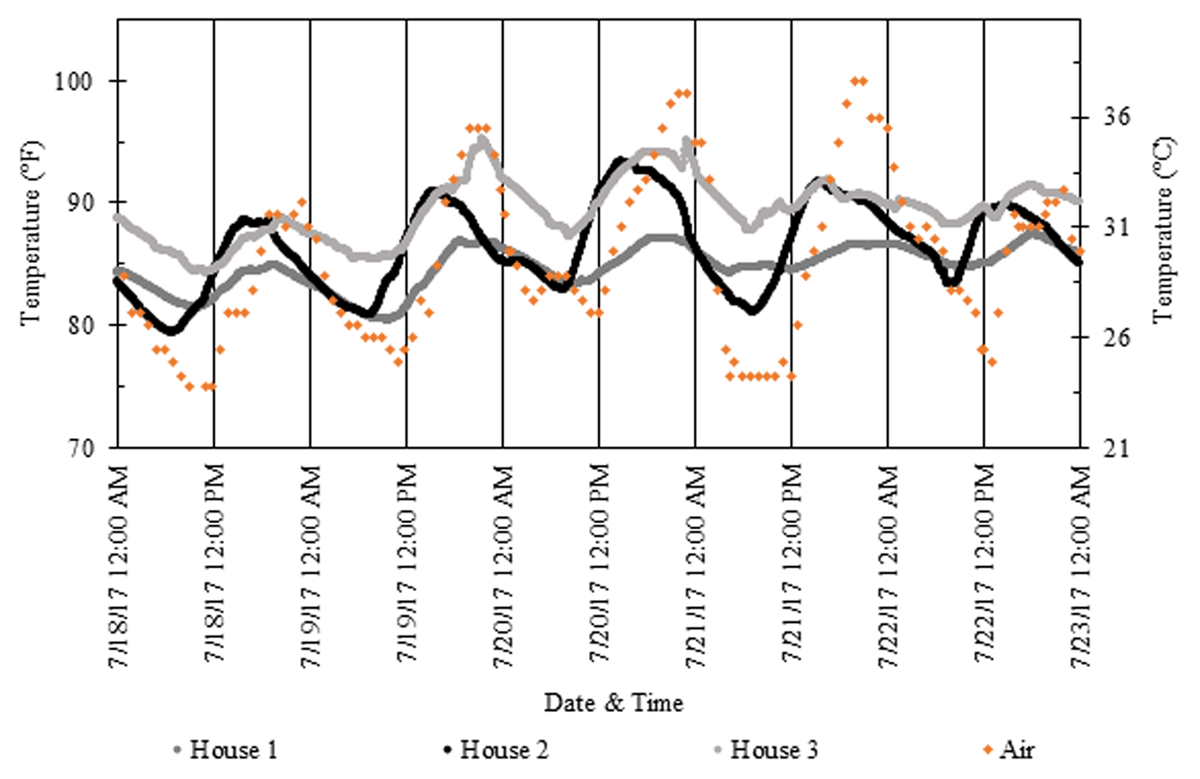
Figure 3
Indoor temperature profiles of three homes during a July 2017 extreme heat event compared with outdoor air temperature derived from airport weather station data.
Table 1
Best practices and implementation strategies for gathering data from marginalised populations.
| Best practices | Implementation |
|---|---|
| Earn trust through partnership | Formed a public partnership with community organisations already well known to the population |
| Be multilingual and inclusive | Data-collection materials, consent forms and recruitment materials offered in the languages most relevant to the community: English and Spanish |
| Communicate for understanding | Data-collection materials used images and familiar (e.g. ‘plain’) language to facilitate better understanding |
| Respect schedules and cultural norms | Structured data collection around a previously scheduled, public community event that aligned with the schedules of the residents |
| Offer something useful | Offered the chance to win gift cards to a home-improvement store within the community as well as rope caulk to allow participants to begin weatherising on their own |
[i] Source: Based in part on Stonewall et al. (2019).
Table 2
Summary of survey characteristics and responses.
| Survey title | Questions | Target population | Administration | Response |
|---|---|---|---|---|
| Weatherisation survey | 14 | Families with children | In person at community events | 64 participants |
| Energy survey | 45 | Older adults | Mail and return | 86/838 (10.3%) |
[i] Note: Response rate is not available for the weatherisation survey because the event attendance was not recorded.
Table 3
Demographics of the three participating neighbourhoods in the study area (2010 Census).
| Characteristic | Neighbourhood 1 | Neighbourhood 2 | Neighbourhood 3 |
|---|---|---|---|
| Total population, 2010 | 3187 | 2605 | 2584 |
| Race: White; Black; Asian; Other (%) | 54.1%; 13.0%; 8.3%; 24.6% | 60.2%; 14.1%; 2.0%; 23.7% | 55%; 41%; 2%; 2% |
| Hispanic; not Hispanic (%) | 42%; 58% | 32%; 68% | 26%; 74% |
| Median household income (US$) | US$24,300 | US$20,803 | US$32,706 |
| Own; rent (%) | 54.3%; 45.7% | 56.1%; 43.9% | 59.5%; 40.5% |
| Language spoken at home | 66.2% English; 31.7% Spanish | 76% English; 22.5% Spanish | 73% English; 24.2% Spanish |
Table 4
Questions in the weatherisation survey, offered in English and Spanish.
| Question | Response type |
|---|---|
| I live in this type of home | Circle one |
| How many people live in your home? | Numeric entry |
| To heat my home, I … | Select all that apply |
| To cool my home, I … | Select all that apply |
| I have done these things to my home to save money on my energy bills | Select all that apply |
| Where would you get information on lowering your energy bills? | Select all that apply |
| I would be more likely to make a change to my home if I heard about or saw neighbours making changes to their homes | P1: Yes/no P2, P3: Likert type (1–5) |
| Who would you ask for information about lowering your energy bills? | Select all that apply |
| In the last year, how many times have you talked with others about making home improvement changes to lower your energy bills? | Numeric entry |
| What factors do you consider when deciding to make home improvements, and how important are they? | Likert type (1–10) |
| I know someone in my community who has applied to an assistance program for home improvement and energy efficiency | Yes/no |
| I have applied to an assistance program to have work done on my home to lower my energy bills | Yes/no |
| If you have not applied to an assistance program, why? | Select all that apply |
| As first steps in lowering my energy bills, I will … | Select all that apply |

Figure 4
Eight representative tree canopy shapes used for modelling. Source: Adapted from Hashemi et al. (2018).
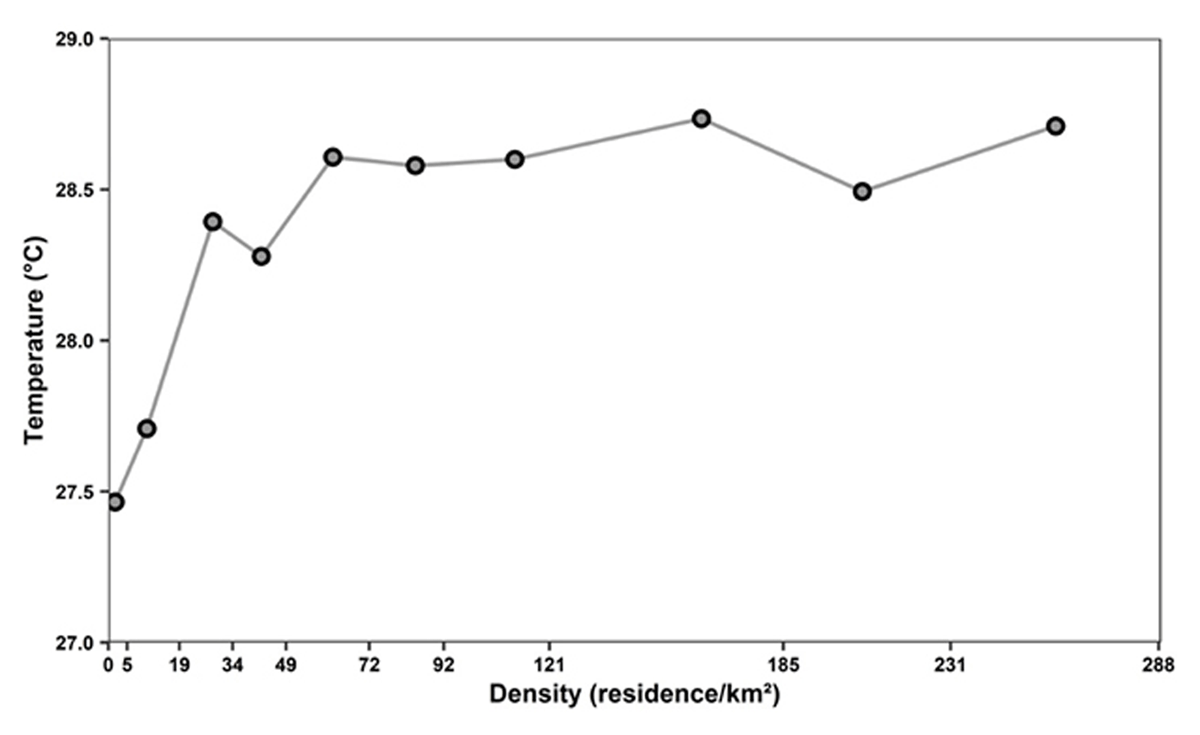
Figure 5
Relationship between density of residences without air-conditioning (AC) and mean external air temperature on 18 July 2010 (the hottest day in 2010) at the census tract level.
Table 5
Defined occupancy schedules and their characteristics.
| Week | Composition | |||||
|---|---|---|---|---|---|---|
| Weekday | Weekend | |||||
| ID | MDPR (%) | MNPR (%) | ID | MDPR (%) | MNPR (%) | |
| W-1 | a | 45% | 50% | a | 65% | 70% |
| W-2 | b | 45% | 75% | a | 65% | 70% |
| W-3 | c | 85% | 95% | b | 65% | 90% |
| W-4 | c | 85% | 95% | c | 85% | 90% |
[i] Notes: Each day schedule represents one of the group clusters from the neighborhood mail survey responses.
MDPR = mean daytime presence rate; MNPR = mean night-time presence rate.
Source: Malekpour Koupaei et al. (2019).

Figure 6
Refined 24-hour schedules and hourly presence rates for (a) weekdays and (b) weekends among Capitol East residents based on their survey responses. Source: Malekpour Koupaei et al. (2019).
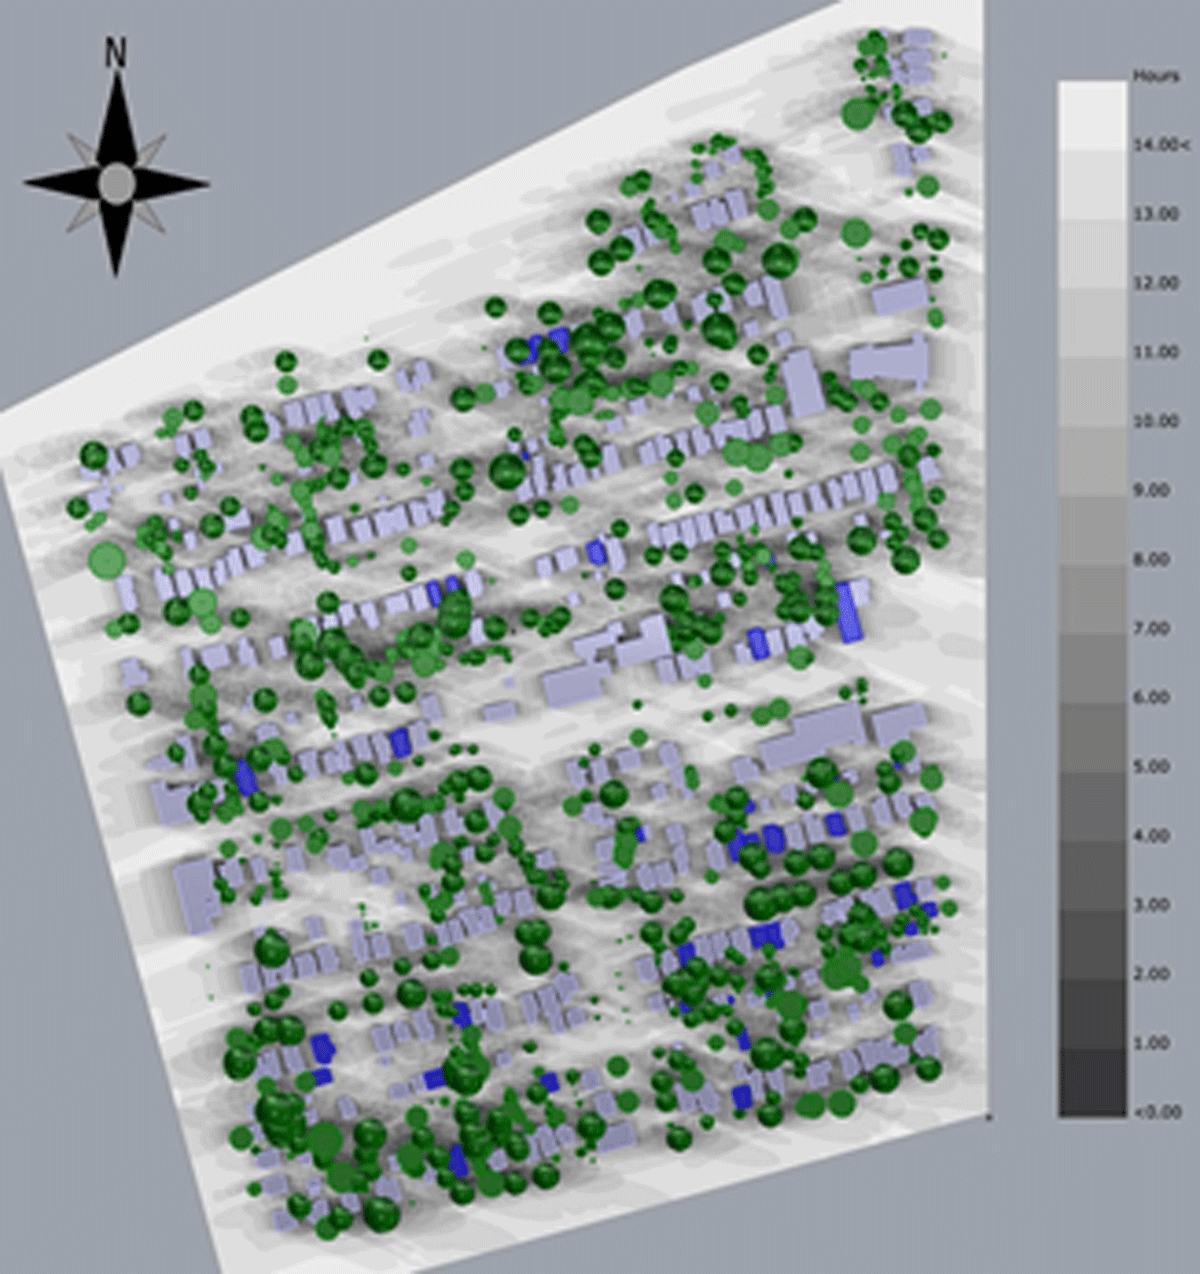
Figure 7
Shadow range analysis (May–September). Hours of direct sunlight received by buildings increases from dark to light colours; buildings indicated in blue are those with a >5% reduction in cooling demand for the scenario with trees. Source: Hashemi et al. (2018).
Table 6
Defined parameters and total number of all 50 possible input combinations.
| Variable parameter | Building model | Climate data | |
|---|---|---|---|
| Trees | Occupancy schedule | Weather data sets | |
| Number of possible values | 2 | 5 | 5 |
| Description | Included Not Included | ASHRAE 90.1 Occupancy Schedule W-1 W-2 W-3 W-4 | TMY3 Actual 2017 FTMY—High FTMY—Medium FTMY—Low |

Figure 8
Energy-use intensity (EUI) in the baseline scenario for low-resource neighbourhoods in Des Moines, Iowa.

Figure 9
Energy burden costs in the baseline scenario for low-resource neighbourhoods in Des Moines, Iowa.
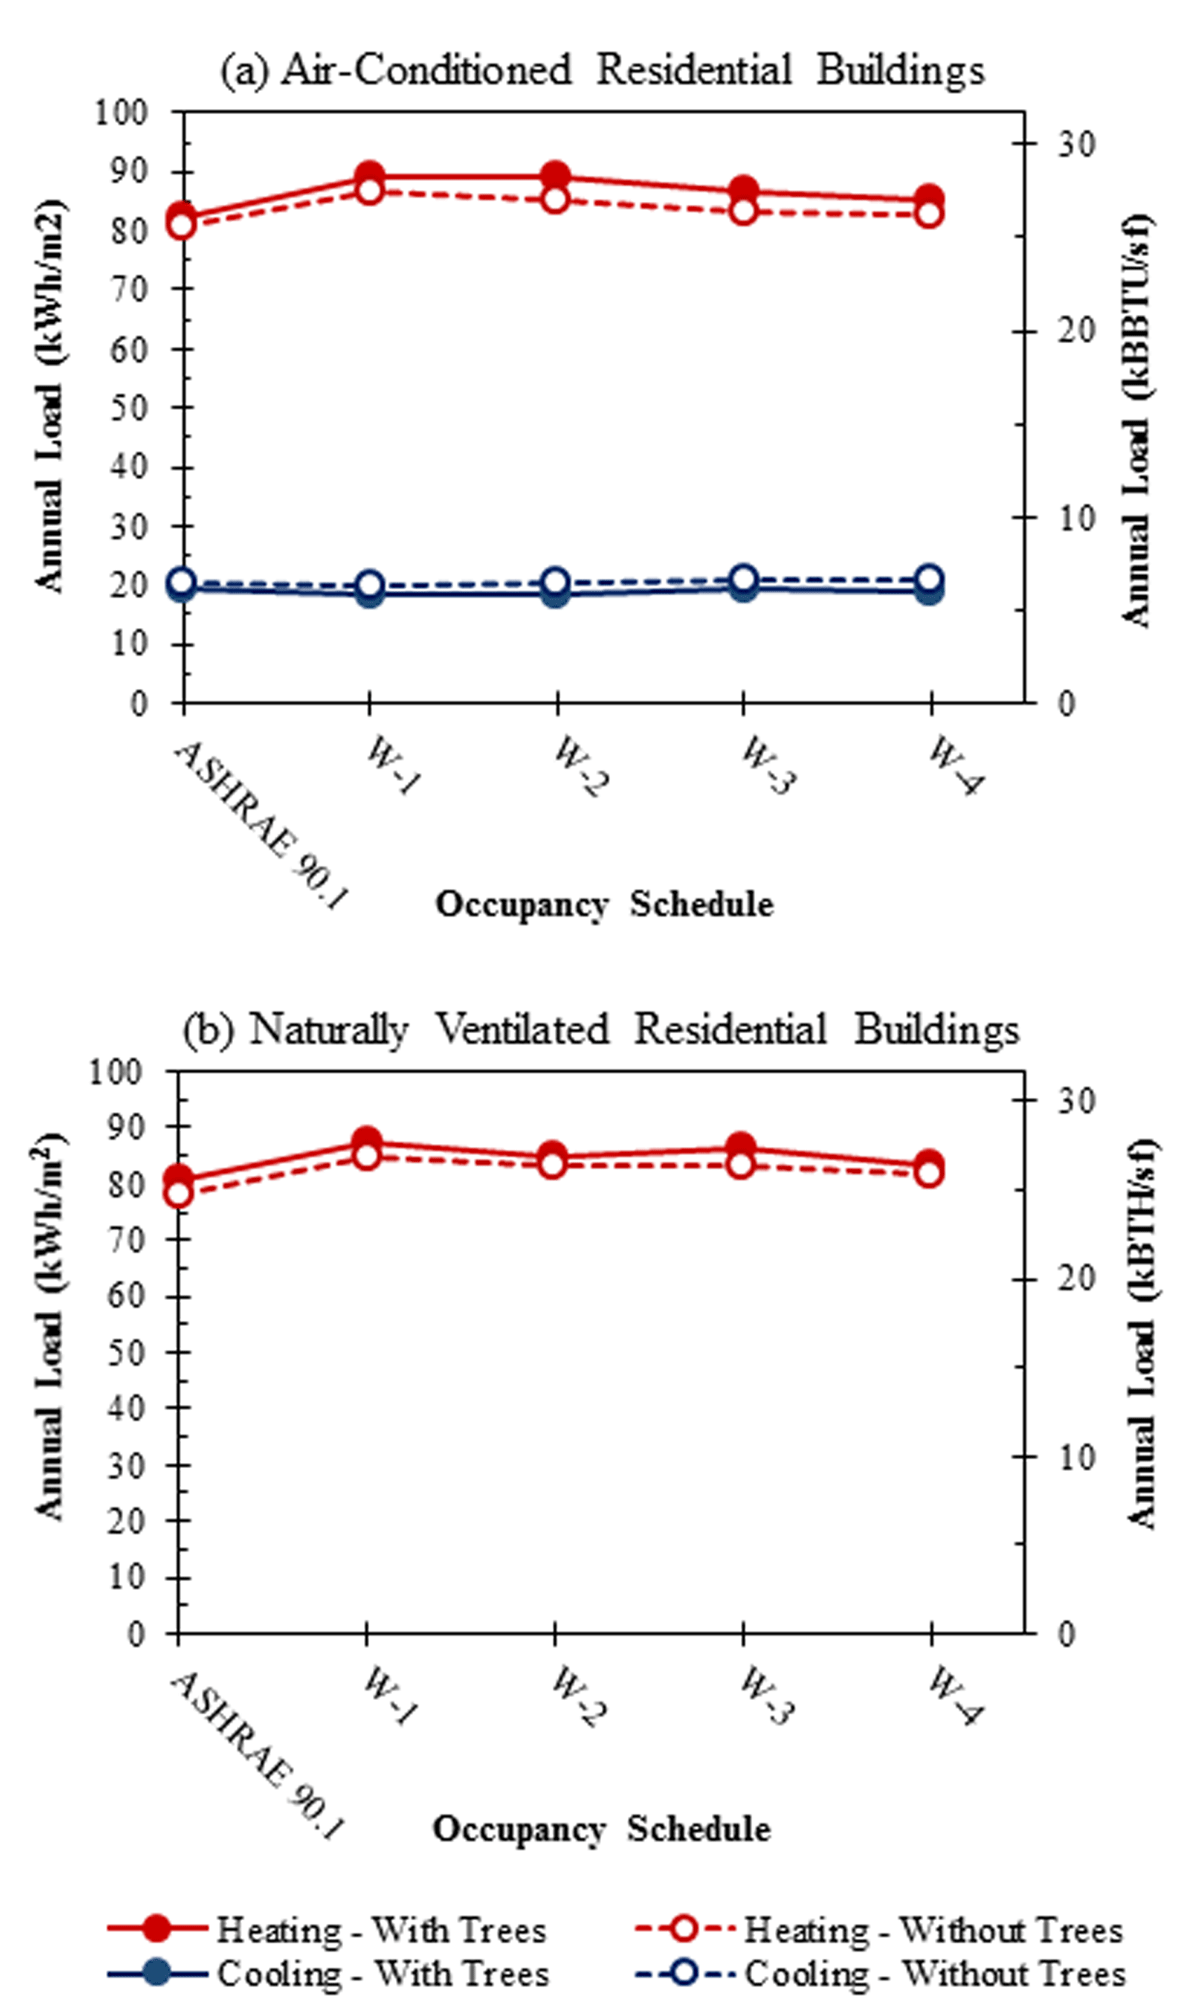
Figure 10
Comparison of different occupancy schedules on annual energy consumption. Note: W-1–W-4 refer to occupancy schedules (see Table 5).
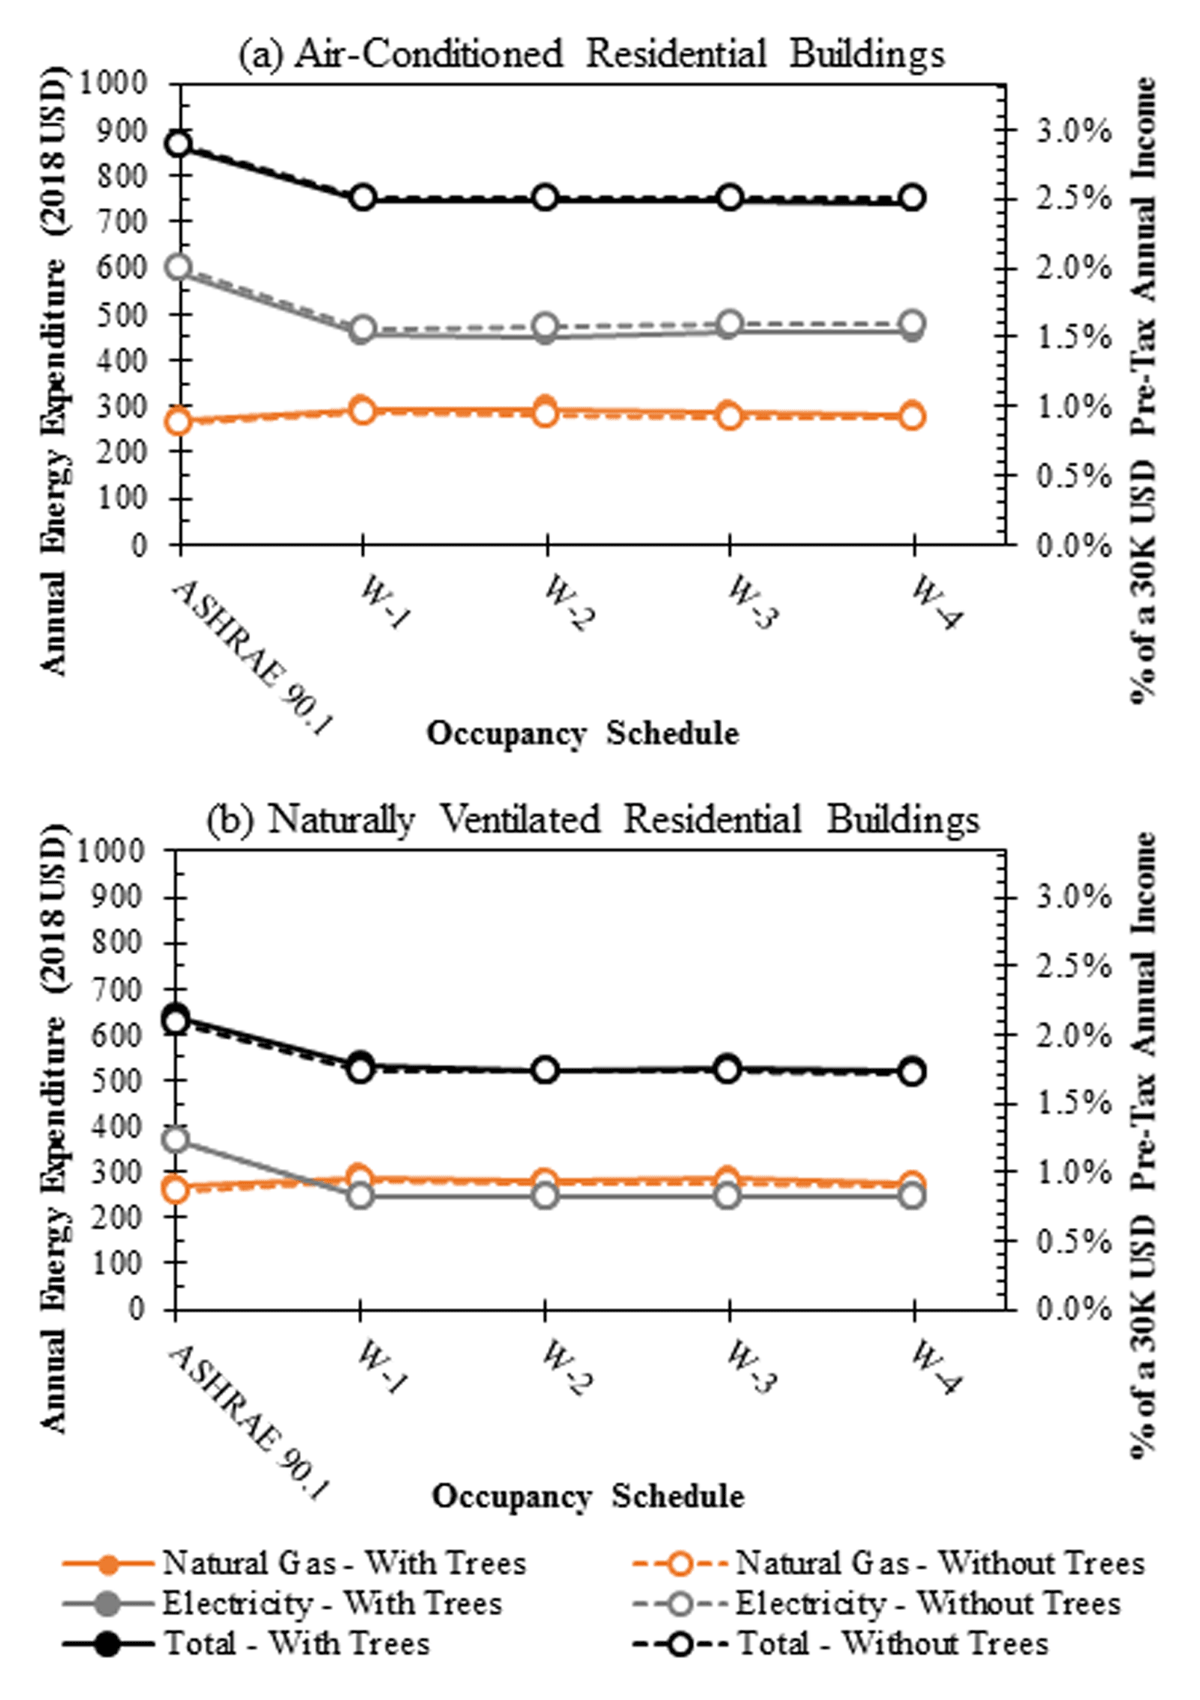
Figure 11
Comparison of effects of occupancy schedules on annual energy expenditure with and without trees.

Figure 12
Comparison of current and future projected climate scenarios on annual energy consumption. Note: TMY = typical meteorological year; and FTMY = future typical meteorological year.
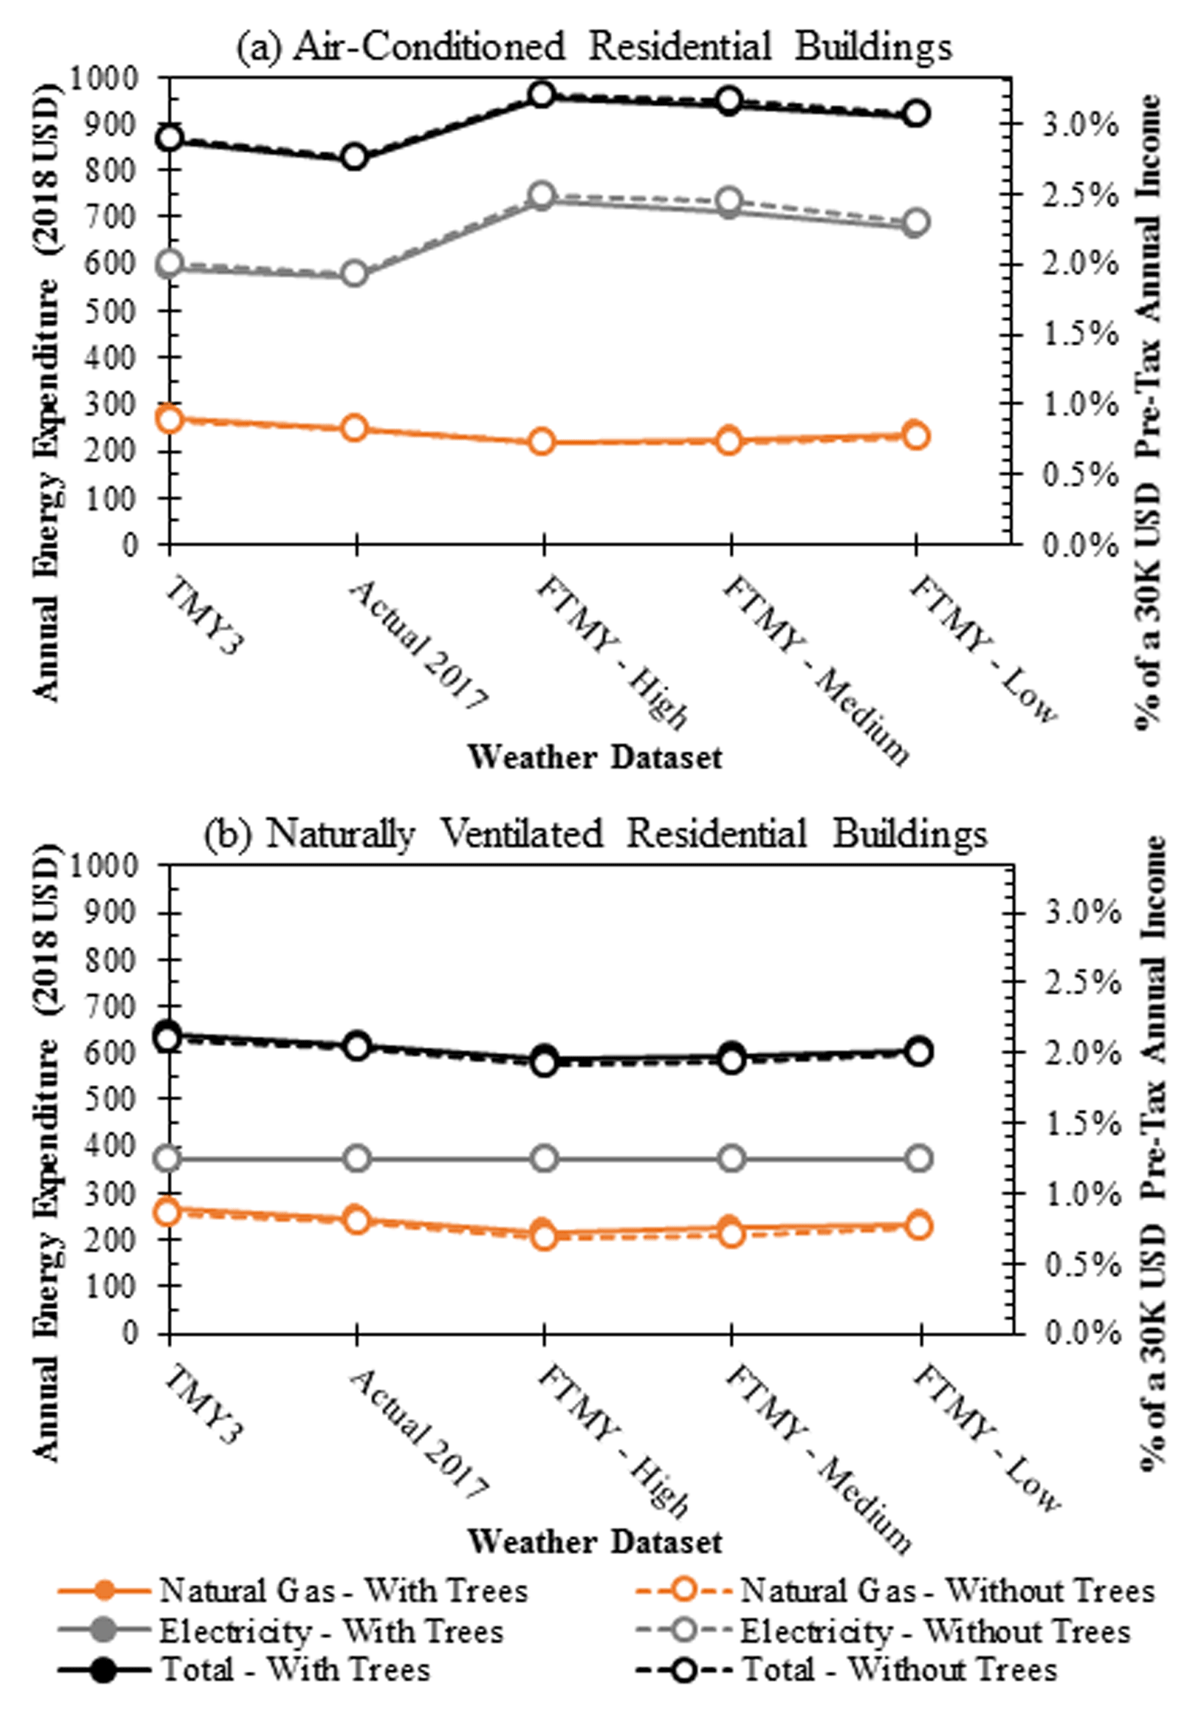
Figure 13
Comparison of different weather scenarios on annual energy expenditure.