
Table 1
Variables included in the study.
| VARIABLE | DESCRIPTION | SOURCE |
|---|---|---|
| COVID-19 case rate (CR) | Average number of daily new COVID-19 cases per 10,000 population | |
| Daily CR in P1a | Phase 1 (January 20–March 22, 2020), initial outbreak | ZCTA Level Coronavirus Data (NYC Health Department 2020) |
| Daily CR in P2 | Phase 2 (March 23–April 5, 2020), first two-week lag of the NYC lockdown | |
| Daily CR in P3 | Phase 3 (April 6–June 7, 2020), NYC lockdown | |
| Daily CR in P4 | Phase 4 (June 8–July 19, 2020), NYC started reopening | |
| Daily CR in P5 | Phase 5 (July 20–August 26, 2020), NYC reopening concluded | |
| Sociodemographic | ||
| Age | Average age of the population (years) | Aggregated from CBG Level ACS 5-Year Estimates (US Census Bureau 2018) |
| Income | Average annual income of the population (US$/year) | |
| Household size | Average number of people per household | |
| Rent | Average contract rent (US$/month) | |
| % No-health insurance | % of the population without health insurance | |
| Density and crowding | ||
| Residential building density | Total residential building floor area/total ZCTA land area | Aggregated from Lot-Level PLUTO-20v4 (NYC Department of City Planning 2020) |
| Office building density | Total office building floor area/total ZCTA land area | |
| Retail building density | Total retail building floor area/total ZCTA land area | |
| No. units per building | Average number of housing units in the same building | Aggregated from CBG Level ACS 5-Year Estimates (US Census Bureau 2018) |
| No. occupants per room | Average number of occupants per room in occupied housing units | |
| Mobility | ||
| % Work commute by PT | % of the population who commute to work by public transit (PT) | Aggregated from CBG Level ACS 5-Year Estimates (US Census Bureau 2018) |
| % Work commute by walk | % of the population who commute to work by walking | |
| % Work commute by bike | % of the population who commute to work by bike | |
| % Work commute by car | % of the population who commute to work by car | |
| Work commute time by PT | Average minutes of work commute by public transit | |
| Turnstile usage count | Average persons per hour passing through a turnstile in the Metropolitan Transportation Authority (MTA) systems | Aggregated from Station Level Turnstile Data (MTA 2020) |
| % of reduced turnstile usage | % of reduced turnstile compared with P1 | |
| No. jobs within 45 min by PT | Number of jobs within a 45 min transit commute, distance decay (walk network travel time, general transit feed specification (GTFS) schedules) weighted | Aggregated from CBG Level Smart Location Database—v2 (USEPA Smart Growth Program 2014) |
| % Pop work from home | % of the population (mobile devices) who do not show full-time (spending more than 6 h at a location other than home between 8 a.m. and 6 p.m.) or part-time (spending 3–6 h at one location other than at home between 8 a.m. and 6 p.m.) work behavior | Aggregated from CBG Level Social Distancing Metrics (SafeGraph 2020) |
| Activity | ||
| Accessible SPMK area per cap | Accessible supermarket (SPMK) area, unit area per capita | Urbano.io (Dogan et al. 2020) trip-sending simulation with: Parks Shapefiles—Open Space (NYC Open Data 2018); SPMK and SHPL Locations—Google Places API (Google Maps Platform 2018); population data—ACS 5-Year Estimates (US Census Bureau 2018) |
| Accessible SHPL area per cap | Accessible shopping mall (SHPL) area, unit area per capita | |
| Accessible PK area per cap | Accessible park (PK) area per m2 per capita |
[i] Notes: a The COVID-19 outbreak started during early to mid-February 2020. The first confirmed COVID-19 case was reported on February 29, 2020. Surveillance data are available after March 27, 2020.
ACS = American Community Survey; CBG = Census Block Group; ZCTA = zip code tabulation area.
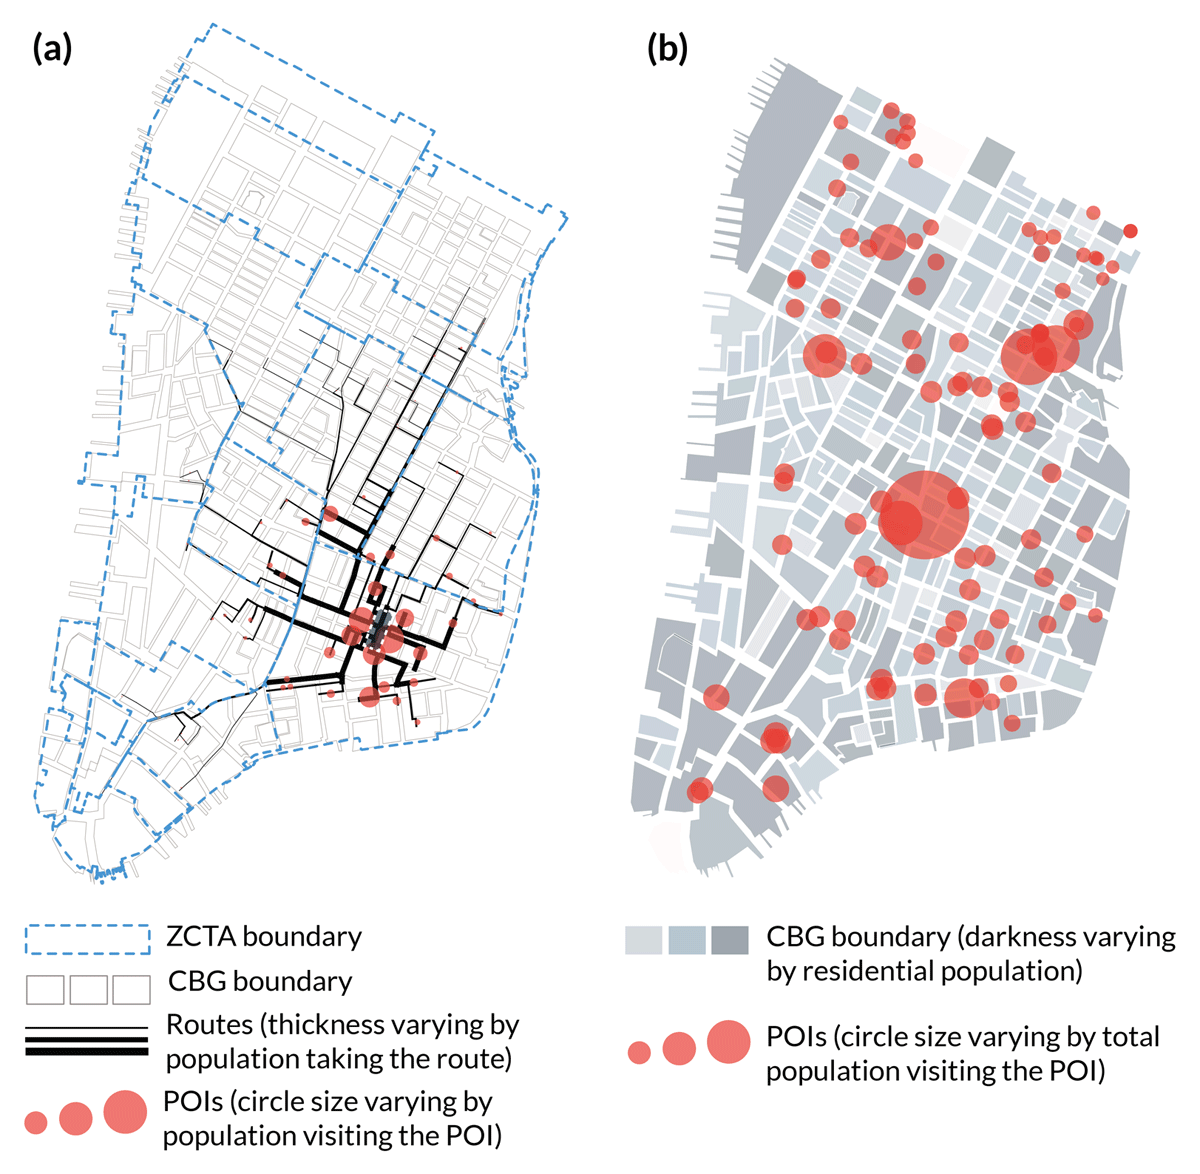
Figure 1
Simulation-based data-generation process of the accessible points of interests (POIs) area per capita.
Table 2
Descriptive statistics of all variables at baseline and the zip code tabulation area (ZCTA) levels.
| CHARACTERISTICS | N | MEAN | STANDARD DEVIATION |
|---|---|---|---|
| COVID-19 case rate per 10,000 population, March–August 2020 | 177 | 10.37 | 10.38 |
| Sociodemographic | |||
| Age (years) | 177 | 38.52 | 3.38 |
| Income (US$/year) | 177 | 86,452.18 | 27,685.68 |
| Household size | 177 | 2.49 | 0.44 |
| Rent (US$/month) | 177 | 1,489.82 | 477.85 |
| % No-health insurance | 177 | 7.56 | 3.64 |
| Density and crowding | |||
| Residential building density | 177 | 0.47 | 0.44 |
| Office building density | 177 | 0.14 | 0.34 |
| Retail building density | 177 | 0.04 | 0.05 |
| No. units per building | 177 | 26.82 | 17.53 |
| No. occupants per room | 177 | 0.56 | 0.08 |
| Mobility | |||
| % Work commute by PT | 177 | 25.83 | 8.68 |
| % Work commute by walk | 177 | 5.38 | 6.04 |
| % Work commute by bike | 177 | 0.59 | 0.74 |
| % Work commute by automobile | 177 | 13.65 | 9.30 |
| Work commute time by PT (min) | 177 | 50.05 | 7.55 |
| Turnstile usage counts in P1 | 122 | 1,330.34 | 1,077.64 |
| % Reduced turnstile in P2 | 122 | 65.20 | 56.96 |
| No. jobs within 45 min by PT | 177 | 99,703.12 | 101,284.80 |
| % Pop work from home in P2 | 177 | 92.68 | 10.13 |
| Activity | |||
| Accessible SPMK area per cap | 168 | 0.006 | 0.007 |
| Accessible SHPL area per cap | 166 | 0.004 | 0.005 |
| Accessible PK area per cap | 166 | 0.316 | 0.417 |
[i] Note: For abbreviations, see Table 1.
Table 3
Descriptive statistics of New York City (NYC) residents’ mobility at zip code tabulation area (ZCTA) level during COVID-19 pandemic periods.
| MEAN ± STANDARD DEVIATION DURING THE COVID-19 PANDEMIC PERIOD | P-VALUEa | ||||
|---|---|---|---|---|---|
| P2 (MARCH 27–APRIL 5) | P3 (APRIL 6–JUNE 7) | P4 (JUNE 8–JULY 19) | P5 (JULY 20–AUGUST 26) | ||
| COVID-19 case rate per 10,000 population, N = 177 | 9.36 ± 3.35 | 24.80 ± 10.78 | 3.96 ± 1.59 | 3.34 ± 1.10 | <0.001 |
| Turnstile usage count, N = 122b | 489.53 ± 1,115.84 | 190.91 ± 130.17 | 364.04 ± 328.15 | 410.00 ± 306.19 | <0.001 |
| % Reduced turnstile, N = 122 | 65.20 ± 56.96 | 82.80 ± 7.90 | 69.44 ± 11.52 | 65.24 ± 11.78 | <0.001 |
| % Pop work from home, N = 177 | 92.68 ± 1.32 | 93.20 ± 1.37 | 91.52 ± 1.37 | 90.77 ± 1.45 | <0.001 |
[i] Notes: a Analysis of variance for mean comparisons.
b Average turnstile usage count in P1 was 1,330.34 ± 1,077.64.
Table 4
Multiple linear regression (MLR) models within each focused group.
| EXPLANATORY VARIABLES | OUTCOME VARIABLES | |||||||||||
|---|---|---|---|---|---|---|---|---|---|---|---|---|
| DAILY CR IN P2 | DAILY CR IN P3 | DAILY CR IN P4 | DAILY CR IN P5 | |||||||||
| COEFFICIENT | BETA | P-VALUE | COEFFICIENT | BETA | P-VALUE | COEFFICIENT | BETA | P-VALUE | COEFFICIENT | BETA | P-VALUE | |
| Sociodemographic | ||||||||||||
| Age | 0.09 | 0.09 | 0.25 | –0.30 | –0.09 | 0.17 | –0.11 | –0.24 | 0.01 | –0.12 | –0.36 | <0.01 |
| Income (US$/year) | <0.01 | 0.26 | 0.22 | <–0.01 | –0.00 | 0.99 | <–0.01 | –0.52 | 0.02 | <–0.01 | –0.50 | 0.03 |
| Household size | 2.85 | 0.38 | 0.00 | 7.26 | 0.30 | <0.01 | 0.09 | 0.03 | 0.80 | –0.24 | –0.10 | 0.31 |
| Rent (US$/month) | <–0.01 | –0.23 | 0.22 | –0.01 | –0.46 | 0.01 | <0.01 | 0.16 | 0.41 | <0.01 | 0.03 | 0.88 |
| % No-health insurance | 14.68 | 0.16 | 0.16 | –23.55 | –0.08 | 0.41 | –7.75 | –0.18 | 0.13 | –6.05 | –0.20 | 0.06 |
| Intercept | –2.64 | 0.54 | 35.79 | <0.01 | 10.38 | <0.01 | 10.51 | <0.01 | ||||
| Adjusted R2 | 0.194; p < 0.001 | 0.424; p< 0.001 | 0.160; p < 0.001 | 0.27; p < 0.001 | ||||||||
| Density and crowding | ||||||||||||
| Residential building density | –1.67 | –0.22 | 0.04 | –9.09 | –0.37 | <0.01 | –1.41 | –0.39 | <0.01 | –0.51 | –0.20 | 0.06 |
| Office building density | –1.04 | –0.11 | 0.34 | –9.73 | –0.31 | <0.01 | –0.07 | –0.02 | 0.90 | –0.02 | –0.01 | 0.96 |
| Retail building density | 3.92 | 0.06 | 0.62 | –11.86 | –0.06 | 0.60 | –0.81 | –0.03 | 0.83 | –0.11 | –0.05 | 0.68 |
| No. units per building | –0.05 | –0.28 | 0.01 | <–0.01 | 0.00 | 0.96 | 0.02 | 0.25 | 0.02 | 0.13 | 0.21 | 0.05 |
| No. occupants per room | 5.50 | 0.12 | 0.08 | 15.29 | 0.11 | 0.09 | 4.30 | 0.20 | 0.01 | 4.27 | 0.29 | <0.01 |
| Intercept | 8.48 | <0.01 | 22.45 | <0.01 | 1.66 | 0.05 | 0.91 | 0.13 | ||||
| Adjusted R2 | 0.192; p < 0.001 | 0.355; p < 0.001 | 0.138; p < 0.001 | 0.121; p < 0.001 | ||||||||
| Mobility | ||||||||||||
| % Work commute by PT | –4.26 | –0.11 | 0.40 | –10.60 | –0.07 | 0.43 | –2.35 | –0.10 | 0.42 | –0.11 | –0.00 | 0.96 |
| % Work commute by walk | –5.01 | –0.11 | 0.53 | –45.89 | –0.28 | 0.03 | 5.17 | 0.20 | 0.27 | 3.37 | 0.20 | 0.30 |
| % Work commute by bike | 33.95 | 0.09 | 0.46 | –51.66 | –0.04 | 0.67 | 39.86 | 0.18 | 0.13 | –26.25 | –0.18 | 0.14 |
| % Work commute by car | 10.46 | 0.24 | 0.18 | –30.60 | –0.19 | 0.15 | –12.99 | –0.52 | <0.01 | –8.41 | –0.51 | 0.01 |
| Work commute time by PT | 0.09 | 0.21 | 0.50 | 1.13 | 0.73 | <0.01 | 0.23 | 0.96 | <0.01 | 0.05 | 0.31 | 0.37 |
| Turnstile usage counts | <–0.01 | –0.07 | 0.58 | 0.01 | 0.09 | 0.16 | <0.01 | 0.00 | 0.97 | <0.01 | 0.03 | 0.74 |
| % Reduced turnstile | –0.44 | –0.09 | 0.51 | –51.27 | –0.38 | <0.01 | –4.96 | –0.34 | <0.01 | –1.55 | –0.16 | 0.12 |
| No. jobs within 45 min by PT | <0.01 | 0.06 | 0.83 | <0.01 | 0.32 | 0.12 | <0.01 | 0.17 | 0.56 | <–0.01 | –0.29 | 0.36 |
| % Pop work from home | 17.89 | 0.08 | 0.39 | –31.09 | –0.04 | 0.54 | 7.24 | 0.06 | 0.51 | 10.39 | 0.14 | 0.16 |
| Intercept | –11.71 | 0.53 | 44.89 | 0.33 | –9.16 | 0.35 | –6.09 | 0.36 | ||||
| Adjusted R2 | 0.212; p < 0.001 | 0.62; p < 0.001 | 0.214; p < 0.001 | 0.143; p= 0.002 | ||||||||
| Activity | ||||||||||||
| SPMK area per cap | 28.71 | 0.05 | 0.59 | 257.71 | 0.13 | 0.10 | 34.77 | 0.12 | 0.17 | 4.54 | 0.02 | 0.80 |
| SHPL area per cap | –142.47 | –0.23 | 0.01 | –942.85 | –0.48 | <0.01 | –93.38 | –0.32 | <0.01 | –51.03 | –0.26 | <0.01 |
| PK area per cap | 1.66 | 0.19 | 0.01 | 7.92 | 0.29 | <0.01 | –0.05 | –0.01 | 0.88 | –0.16 | –0.06 | 0.46 |
| Intercept | 9.34 | <0.01 | 25.51 | <0.01 | 4.15 | <0.01 | 3.59 | <0.01 | ||||
| Adjusted R2 | 0.063; p = 0.0047 | 0.245; p < 0.001 | 0.062; p = 0.005 | 0.046; p= 0.016 | ||||||||
[i] Note: For abbreviations, see Table 1.
Table 5
Summary of multiple regression analysis for variables predicting the COVID-19 daily new case rate.
| VARIABLES | MODEL 1 (P2) | MODEL 2 (P3) | MODEL 3 (P4) | MODEL 4 (P5) | ||||||||
|---|---|---|---|---|---|---|---|---|---|---|---|---|
| COEFFICIENT | SE | B | COEFFICIENT | SE | B | COEFFICIENT | SE | B | COEFFICIENT | SE | B | |
| Income (US$/year) | <0.01** | <0.01 | 0.30 | |||||||||
| % No-health insurance | 29.1** | 8.8 | 0.32 | |||||||||
| Residential building density | –1.9** | 0.6 | –0.26 | |||||||||
| % Work commute by PT | –9.4** | 3.2 | –0.24 | |||||||||
| SHPL area per cap | –132.4** | 48.6 | –0.21 | |||||||||
| Intercept | 7.7** | 1.6 | ||||||||||
| Residential building density | –4.7** | 1.8 | –0.20 | |||||||||
| No. units per building | 0.1* | 0.1 | 0.16 | |||||||||
| Work commute time by PT | 0.8** | 0.1 | 0.50 | |||||||||
| % Reduced turnstile | –59.3** | 8.7 | –0.43 | |||||||||
| PK area per cap | –5.9** | 2.2 | –0.17 | |||||||||
| Intercept | 34.9** | 12.8 | ||||||||||
| Income (US$/year) | <–0.01** | <0.01 | –0.31 | |||||||||
| Residential building density | –1.3** | 0.4 | –0.37 | |||||||||
| Office building density | 1.0 | 0.6 | 0.21 | |||||||||
| No. units per building | 0.03* | 0.01 | 0.25 | |||||||||
| % Work commute by PT | –6.2** | 2.1 | –0.27 | |||||||||
| % Work commute by bike | 64.7** | 20.2 | 0.32 | |||||||||
| % Reduced turnstile | –4.4** | 1.2 | –0.31 | |||||||||
| SHPL area per cap | –81.9* | 33.2 | –0.30 | |||||||||
| Intercept | 10.0** | 1.0 | ||||||||||
| Age | –0.1** | 0.03 | –0.28 | |||||||||
| Income (US$/year) | <–0.00* | <0.01 | –0.25 | |||||||||
| Household size | 0.5 | 0.3 | 0.19 | |||||||||
| Residential building density | –0.5* | 0.2 | –0.21 | |||||||||
| No. units per building | 0.4** | <0.01 | 0.49 | |||||||||
| % Reduced turnstile | –0.5 | 0.8 | –0.05 | |||||||||
| Intercept | 8.9** | 1.8 | ||||||||||
| Adjusted R2 | 0.214 | 0.646 | 0.438 | 0.361 | ||||||||
| F-statistics | 9.97** | 43.68** | 12.21** | 12.39** | ||||||||
[i] Notes: For abbreviations, see Table 1.
* p < 0.05; ** p < 0.01.
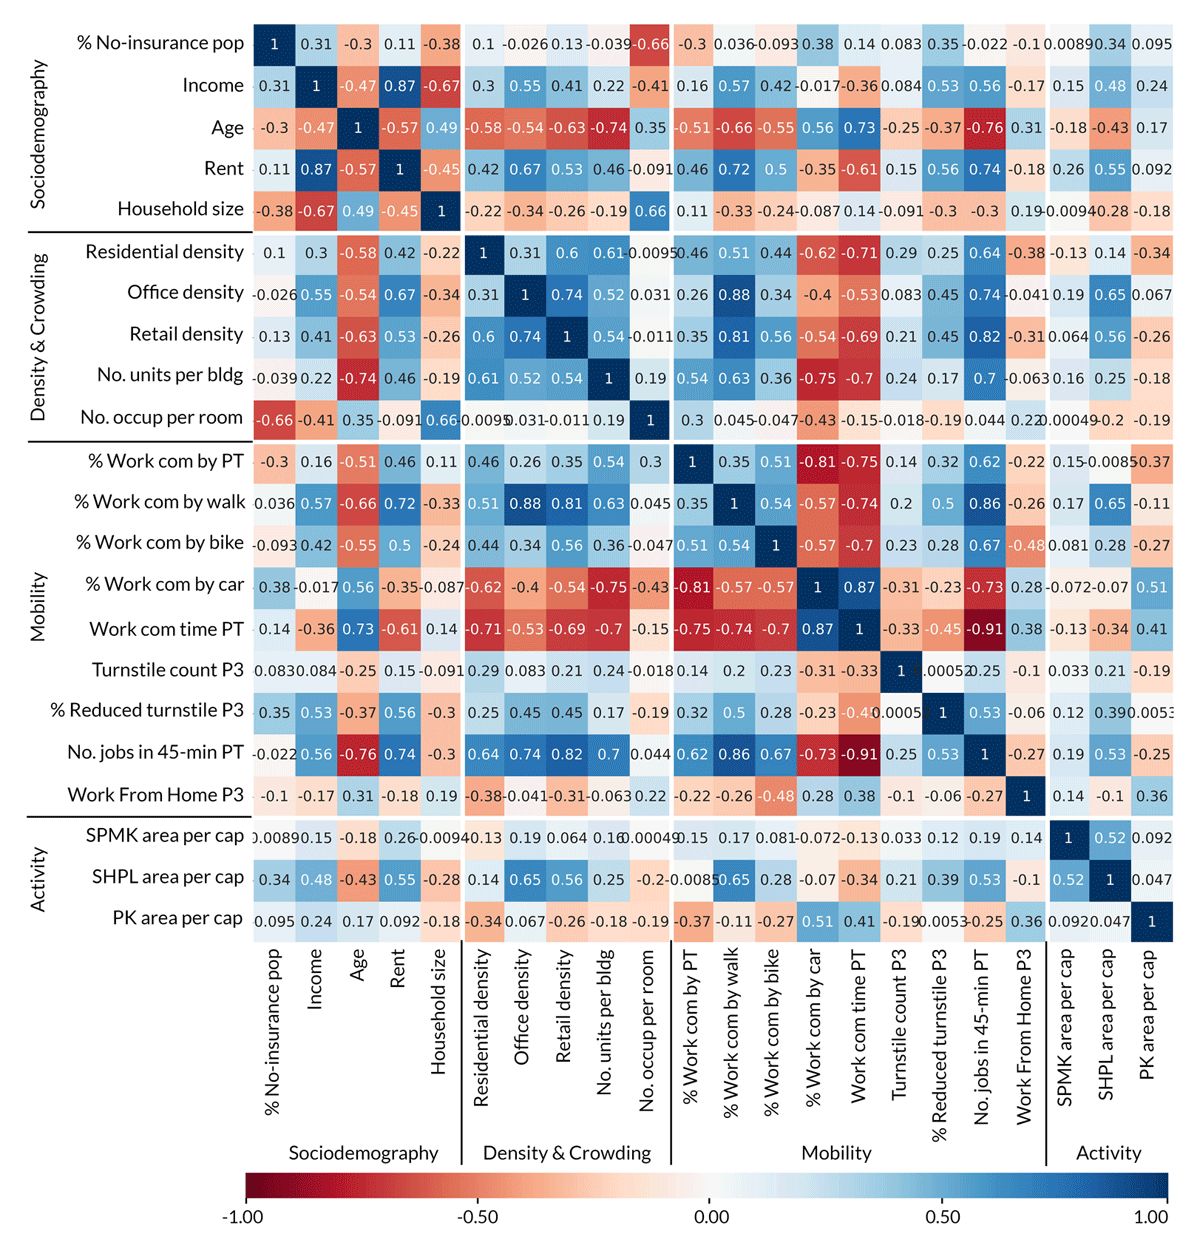
Figure 2
Matrix of the correlation coefficients from Pearson correlation analysis, with variables ordered in explanatory groups and high correlations highlighted with more saturated blue (positive) or red (negative) colors.
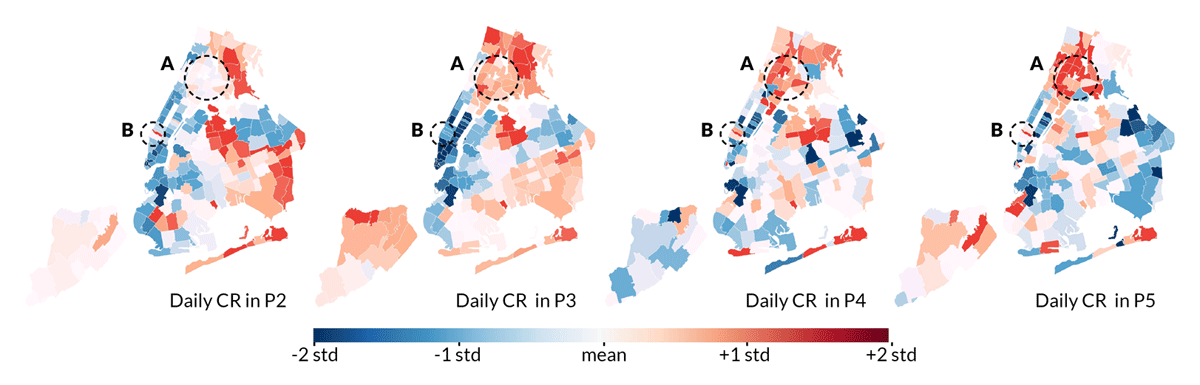
Figure 3
Spatial plots of the daily new COVID-19 case rate (DCR) distribution in standardized z-scores.
Note: A = The Bronx and B = Hell’s Kitchen (the Midtown west side of Manhattan).
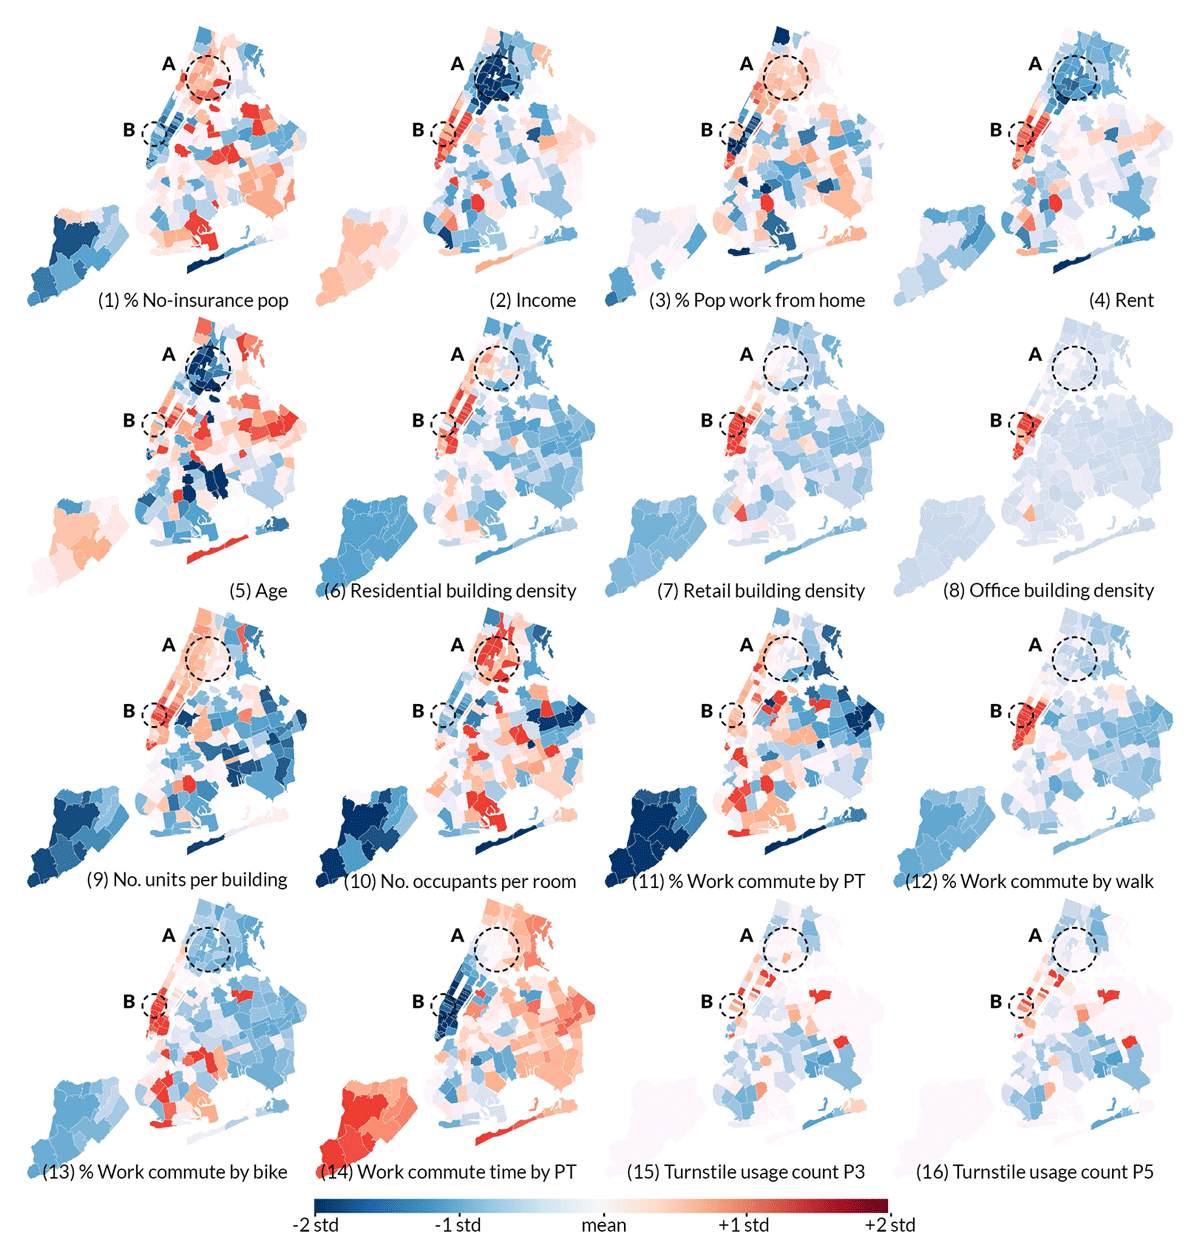
Figure 4
Spatial plots of the distribution of the explanatory attributes in standardized z-scores.
Note: A = The Bronx and B = Hell’s Kitchen (the Midtown west side of Manhattan).