
Table 1
Outdoor air pollution exposure disparities in London.
| REFERENCE | SOCIOECONOMIC INFORMATION | OUTHOOR EXPOSURE MEASURE | POLLUTANT | ASSOCIATION | SIGNIFICANCE |
|---|---|---|---|---|---|
| Pye et al. (2001) | UK Index of Deprivation | Outdoor concentration maps calculated using monitored data and dispersion coefficients from the UK emissions inventory | PM10 NO2 | Air pollutant concentrations in Greater London increased with increasing levels of deprivation. This correlation was stronger for outdoor NO2 than PM10 | PM10: p = 0.01 NO2: p = 0.01d |
| Goodman et al. (2011) | NDIa HIncb % in Employment EAc From census data | Annual average NOx levels were modelled with several models before using land use regression to predict concentrations on a 20 × 20 m grid | NOx | A 1 SD (standard deviation) increase was associated with a 1.6%, 1.1% and 1.5% increase in NDI score, income and employment, respectively, and a 2.2% decrease in educational attainment in NOx concentration | All p < 0.05 |
| Fecht et al. (2015) | Recipients of income support—The English Index of Deprivation | Spatial model overlaying with high-resolution air pollution maps with annual mean concentrations of PM10 and NO2 | PM10 NO2 | NO2 concentrations were 7.8 μg/m3 higher in the most deprived neighbourhoods than in the most affluent neighbourhoods | p < 0.05 |
| Tonne et al. (2018) | HInc—from the study questionnaire | Spatial exposure model that uses residential location, trips, mode of transport and time spent in non-residential locations between trips as inputs | PM2.5 NO2 | Highest income group (> £75,000) had a lower residential NO2 level by 1.3 μg/m3 compared with the lowest (< £10,000). The equivalent difference in PM2.5 was 0.12 μg/m3 | PM2.5: p < 0.05 NO2: p < 0.05 |
| Samoli et al. (2019) | Unemployment rate HInc Crimes per 100,000 inhabitants | Land-use regression model incorporating chemical transport modelling, land use and transport networks | NO2 | Unemployment rate had a positive correlation coefficient = 0.381 with outdoor NO2 concentrations. Crimes per 100,000 inhabitants had a positive correlation coefficient = 0.850 with outdoor NO2 concentrations | Unemployment: p < 0.05 Crimes: p < 0.05 |
[i] Notes: a Neighbourhood deprivation index.
b Household income.
c Educational attainment.
d Values shown in bold are significant at p ≥ 0.05.
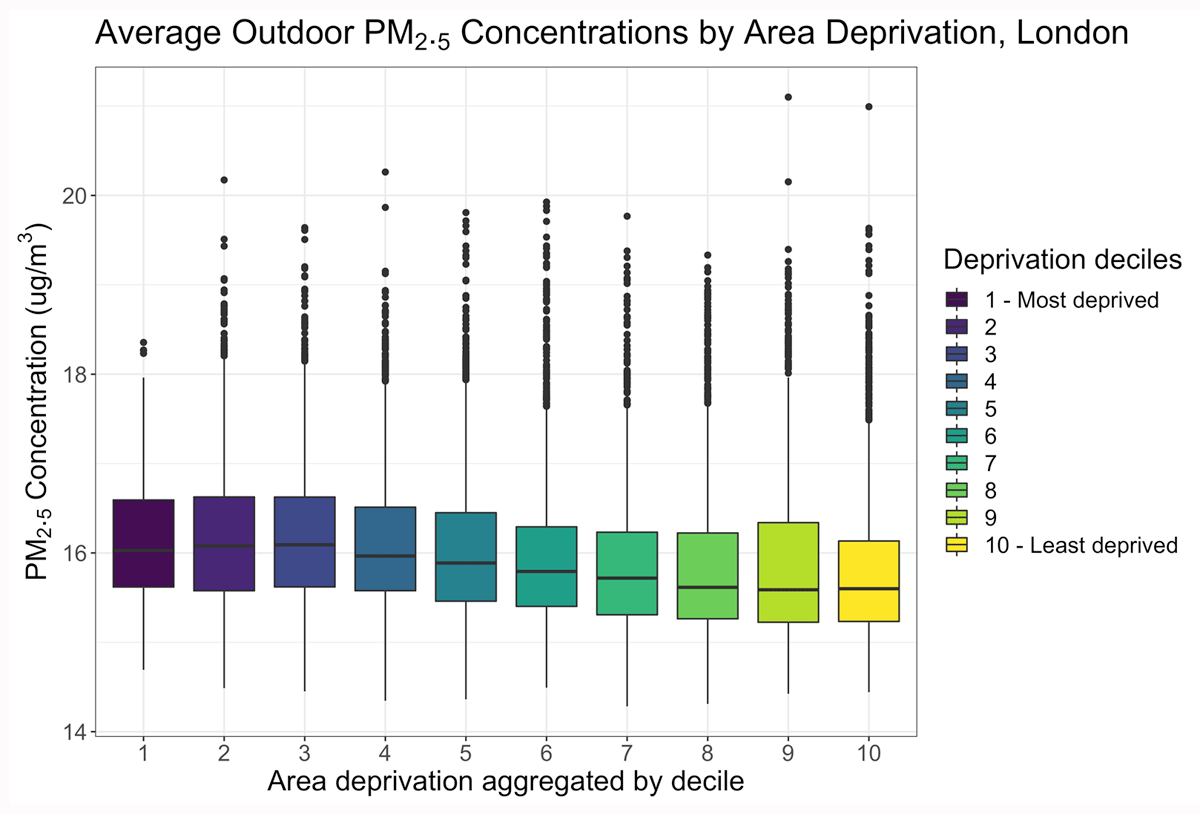
Figure 1
Annual average modelled outdoor PM2.5 concentration aggregated by area-deprivation decile for London Lower Super Output Areas (LSOAs).
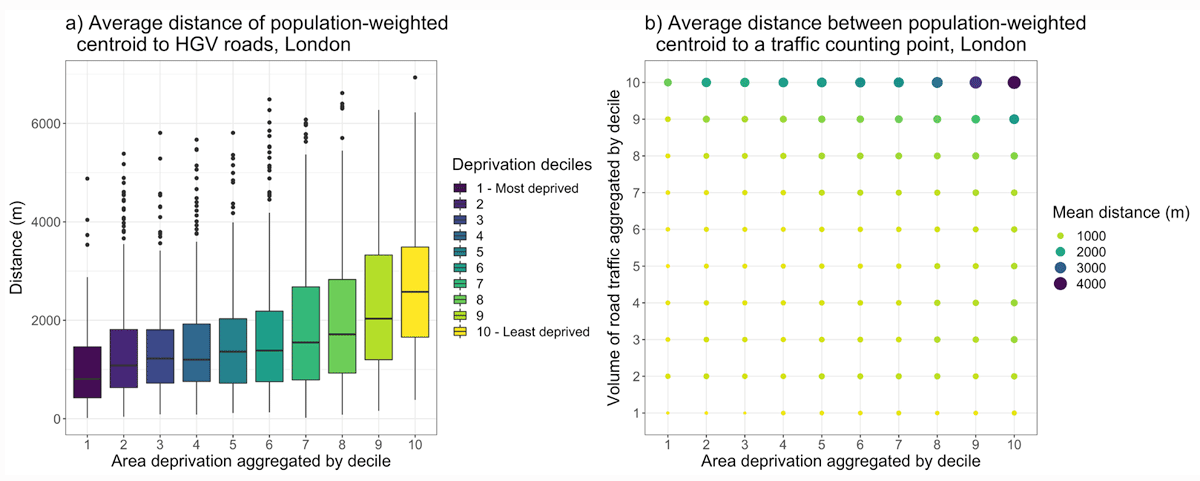
Figure 2
Average distance between Lower Super Output Area (LSOA) population-weighted centroid, aggregated by LSOA deprivation decile: (a) traffic counting points in the top quartile for heavy goods vehicle (HGV) traffic; and (b) traffic counting points aggregated by deciles for all road traffic.
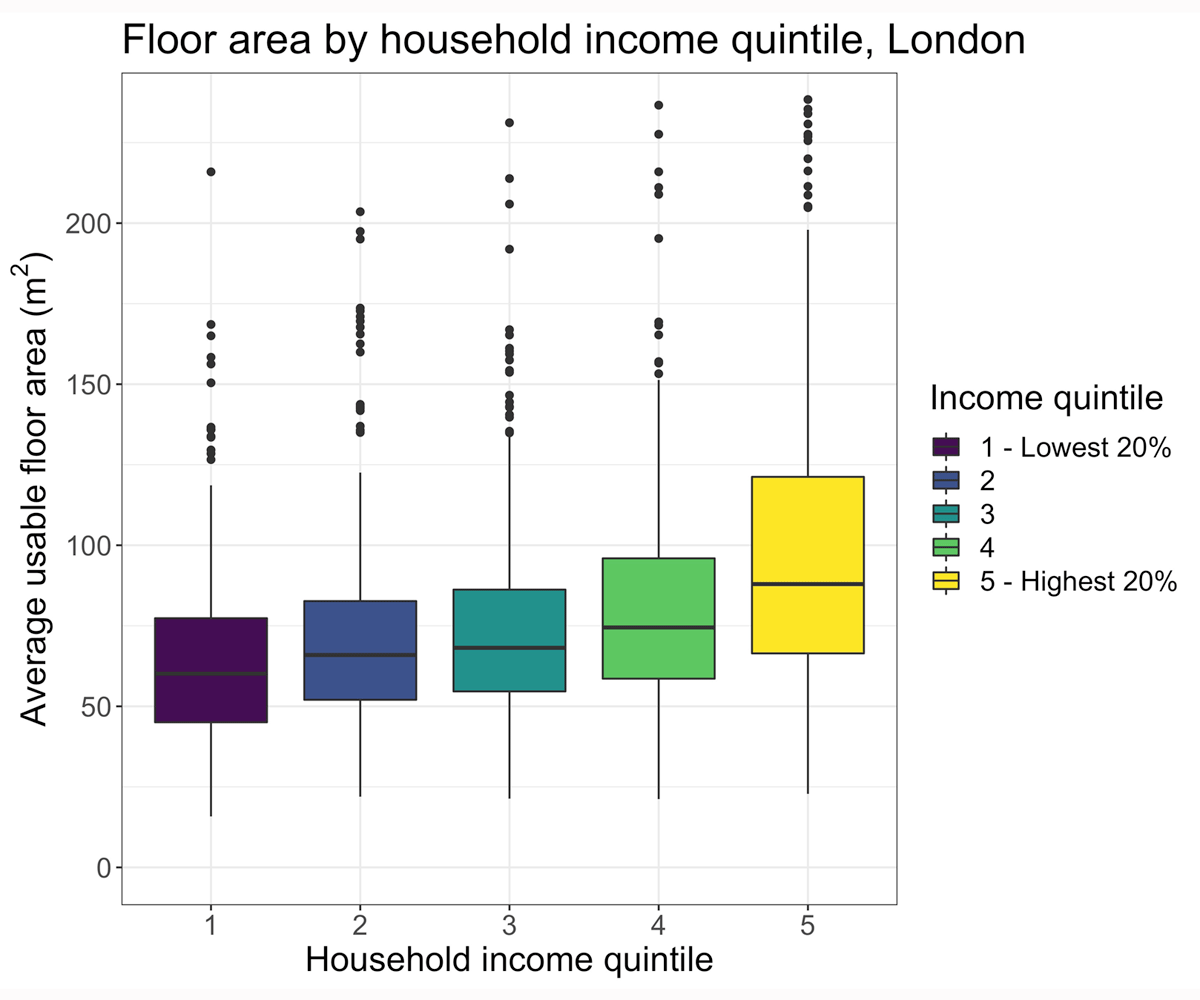
Figure 3
Average usable floor area by socioeconomic status (SES) group, London.
Source: DCLG (2011).
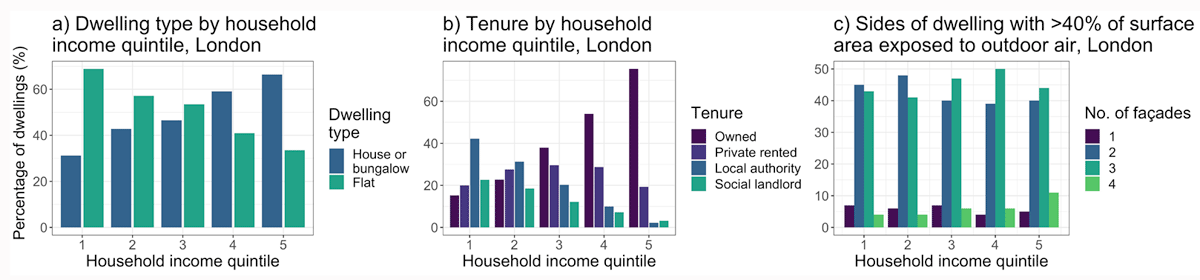
Figure 4
(a) Dwelling type; (b) tenure; and (c) number of exposed facades by socioeconomic status (SES) group, London.
Source: DCLG (2011).

Figure 5
(a) Lower Super Output Area (LSOA) average of the estimated infiltration rates in dwellings by LSOA Indices of Multiple Deprivation (IMD); and (b) LSOA-average concentration of indoor PM2.5 from outdoor sources by LSOA IMD.
Note: Annual average infiltration rates (a) are derived from the Energy Performance Certificate (EPC) database (DCLG 2017b), and infiltration factors used to determine indoor concentrations (b) were estimated using an existing metamodel by the authors (Taylor et al. 2019), developed using EPC data (DCLG 2017b).
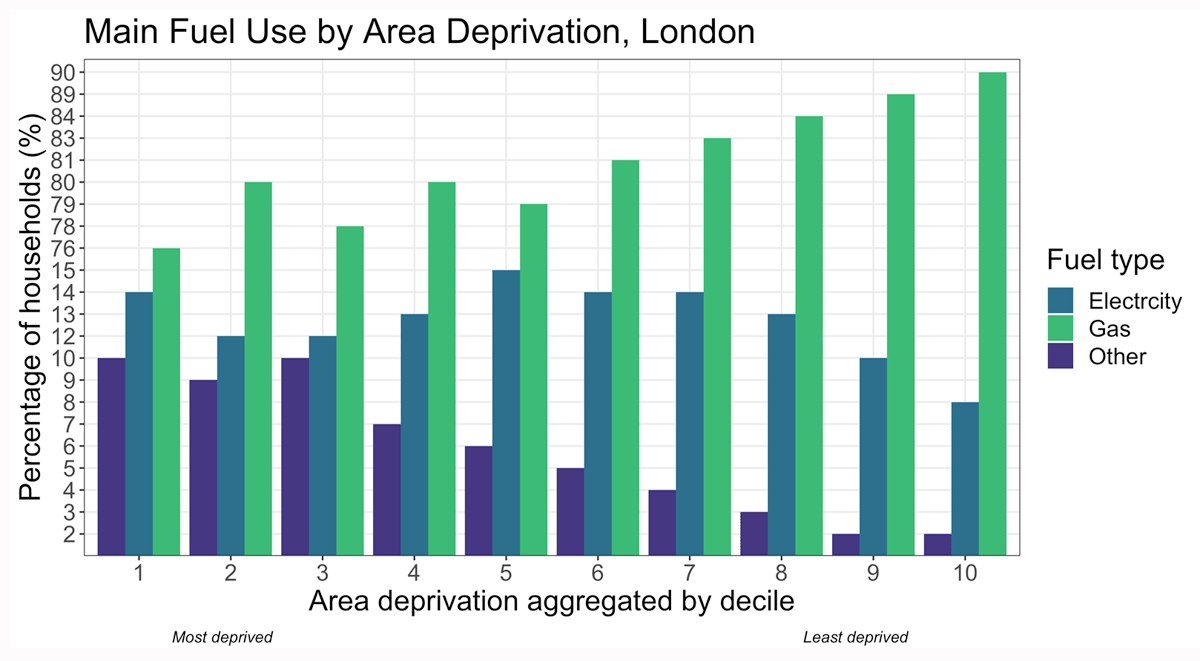
Figure 6
Proportion of households, per Indices of Multiple Deprivation (IMD) decile, using electricity, gas or other fuel types across London.
Source: Data are from the Energy Performance Certificates (EPC) (DCLG 2017b).
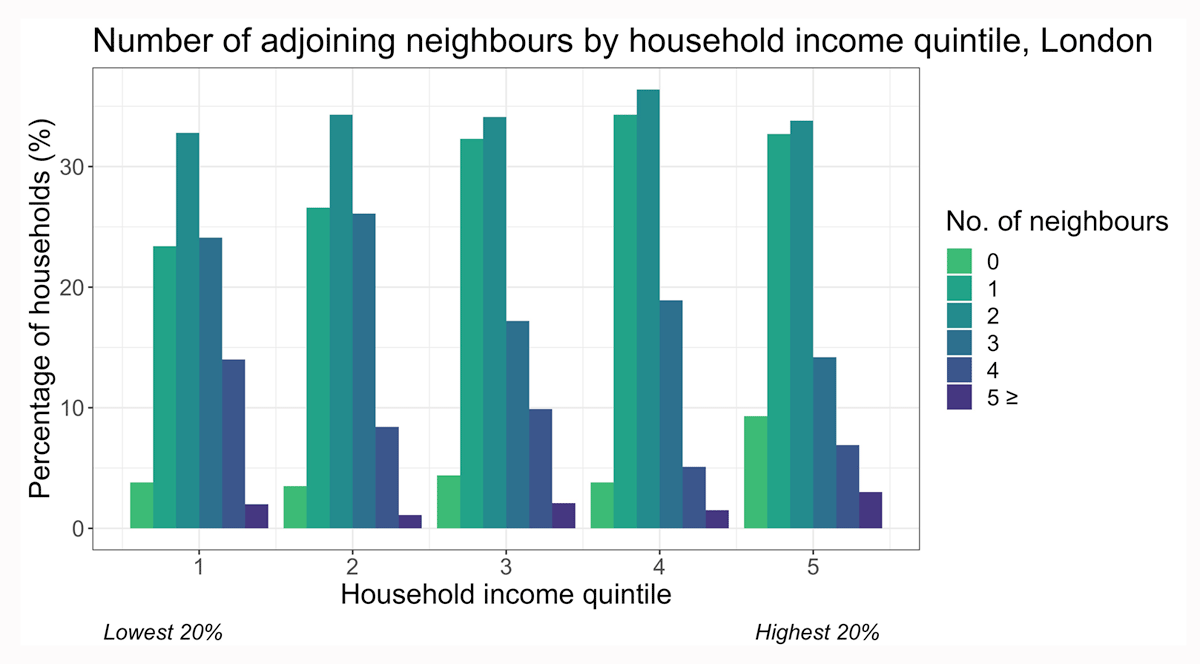
Figure 7
Percentage of households by income quintile that have adjoining neighbours. Mid-floor flats are assumed to have adjoining neighbours above and below.
Source: Data are from the English Housing Survey (EHS) (DCLG 2011).
Table 2
Indoor PM2.5 concentrations throughout the week in the kitchen of a modelled detached and high-rise building with various indoor source scenarios.
| INDOOR SOURCE | DWELLING ARCHETYPE | ||||||
|---|---|---|---|---|---|---|---|
| DETACHED(μg/m3) | HIGH-RISE FLAT(μg/m3) | ||||||
| MINIMUM | DAILY MEAN | MAXIMUM | MINIMUM | DAILY MEAN | MAXIMUM | ||
| No indoor sources | 0.16 | 3.51 | 12.1 | 0.10 | 2.10 | 12.4 | |
| Baseline cooking duration | 0.26 | 28.3 | 453.0 | 0.10 | 36.1 | 676.0 | |
| Baseline cooking duration without and extractor fana | 0.36 | 32.8 | 570.0 | 0.10 | 64.7 | 1,380.0 | |
| Baseline cooking plus smoking | 0.52 | 41.8 | 477.0 | 0.13 | 53.5 | 804.0 | |
| +20 minutes of cooking | 0.26 | 52.3 | 511.0 | 0.10 | 71.5 | 694.0 | |
[i] Note: a Indoor concentrations were modelled with and without a working kitchen extractor fan. Minimums and maximums represent the lowest and highest concentrations in 10-minute intervals over the 365-day period.

Figure 8
Time activity patterns on weekdays and weekends for different socioeconomic groups within the UK. Plots show the proportion of each population being in one of 9micro-environments, over 10-minute intervals.
Table 3
Summary statistics for the percentage of time spent at home by participant socioeconomic status (SES) and type of day for the UK survey population.
| IN RECEIPT OF GOVERNMENT SUPPORT | DAY | N | MEAN (%) | SD (%) | MEDIAN (%) |
|---|---|---|---|---|---|
| Yes | Weekday | 573 | 78.8 | 19.1 | 84.0 |
| Yes | Weekend | 566 | 82.9 | 20.4 | 89.6 |
| No | Weekday | 2,928 | 68.7 | 21.3 | 68.1 |
| No | Weekend | 2,997 | 78.3 | 20.1 | 83.3 |
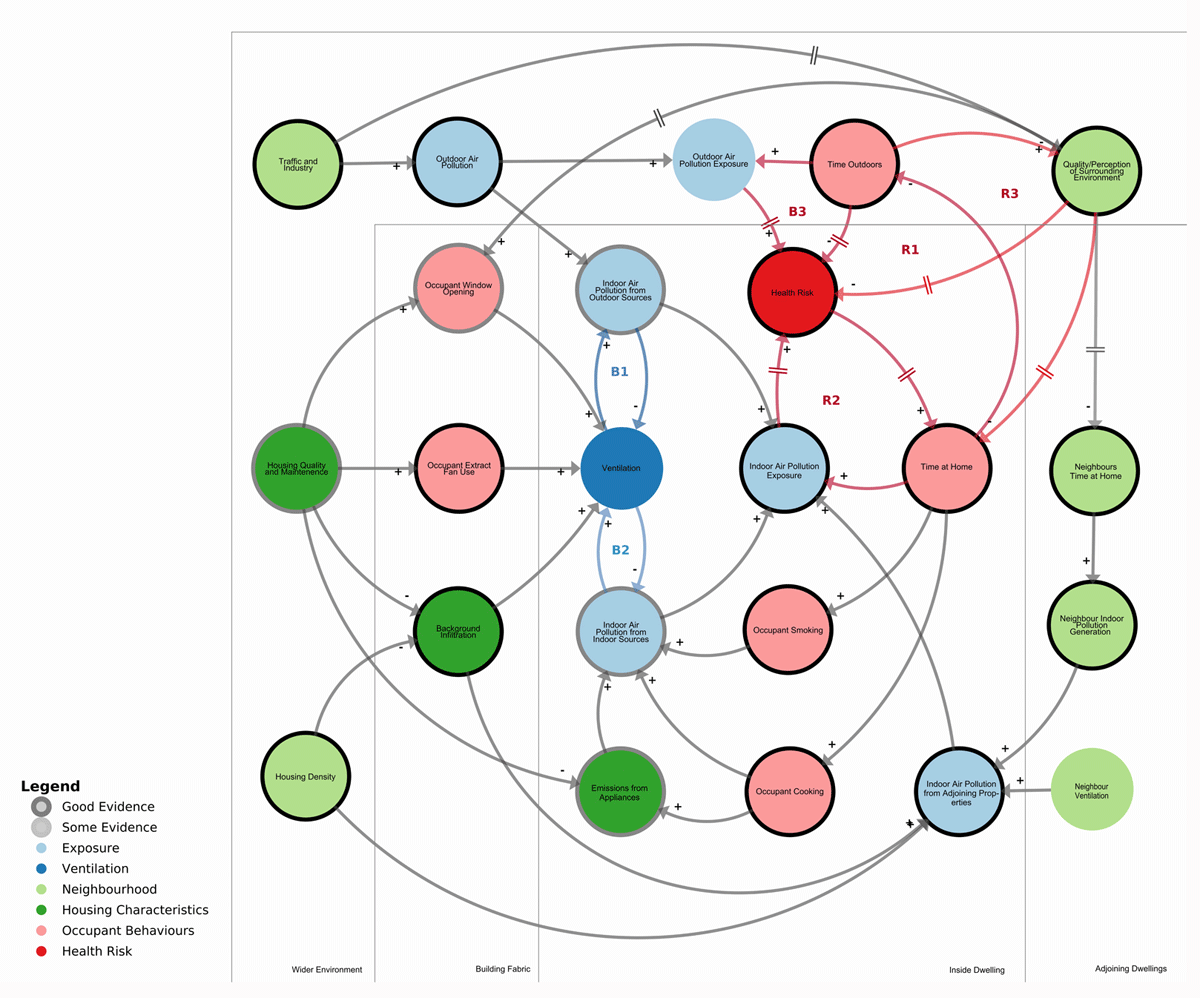
Figure 9
Systems diagram of the factors influencing indoor air quality (IAQ) in dwellings.
Note: The boundary of each element indicates a qualitative description of the degree of evidence for socioeconomic disparities described in the paper. For the different components, see the Appendix in the supplemental data online. For an interactive version of the systems diagram, see https://kumu.io/jonathontaylor/indoor-air-pollution#systemic-inequalities.

Figure 10
System approach for indoor air pollution disparities between socioeconomic groups in the UK.