
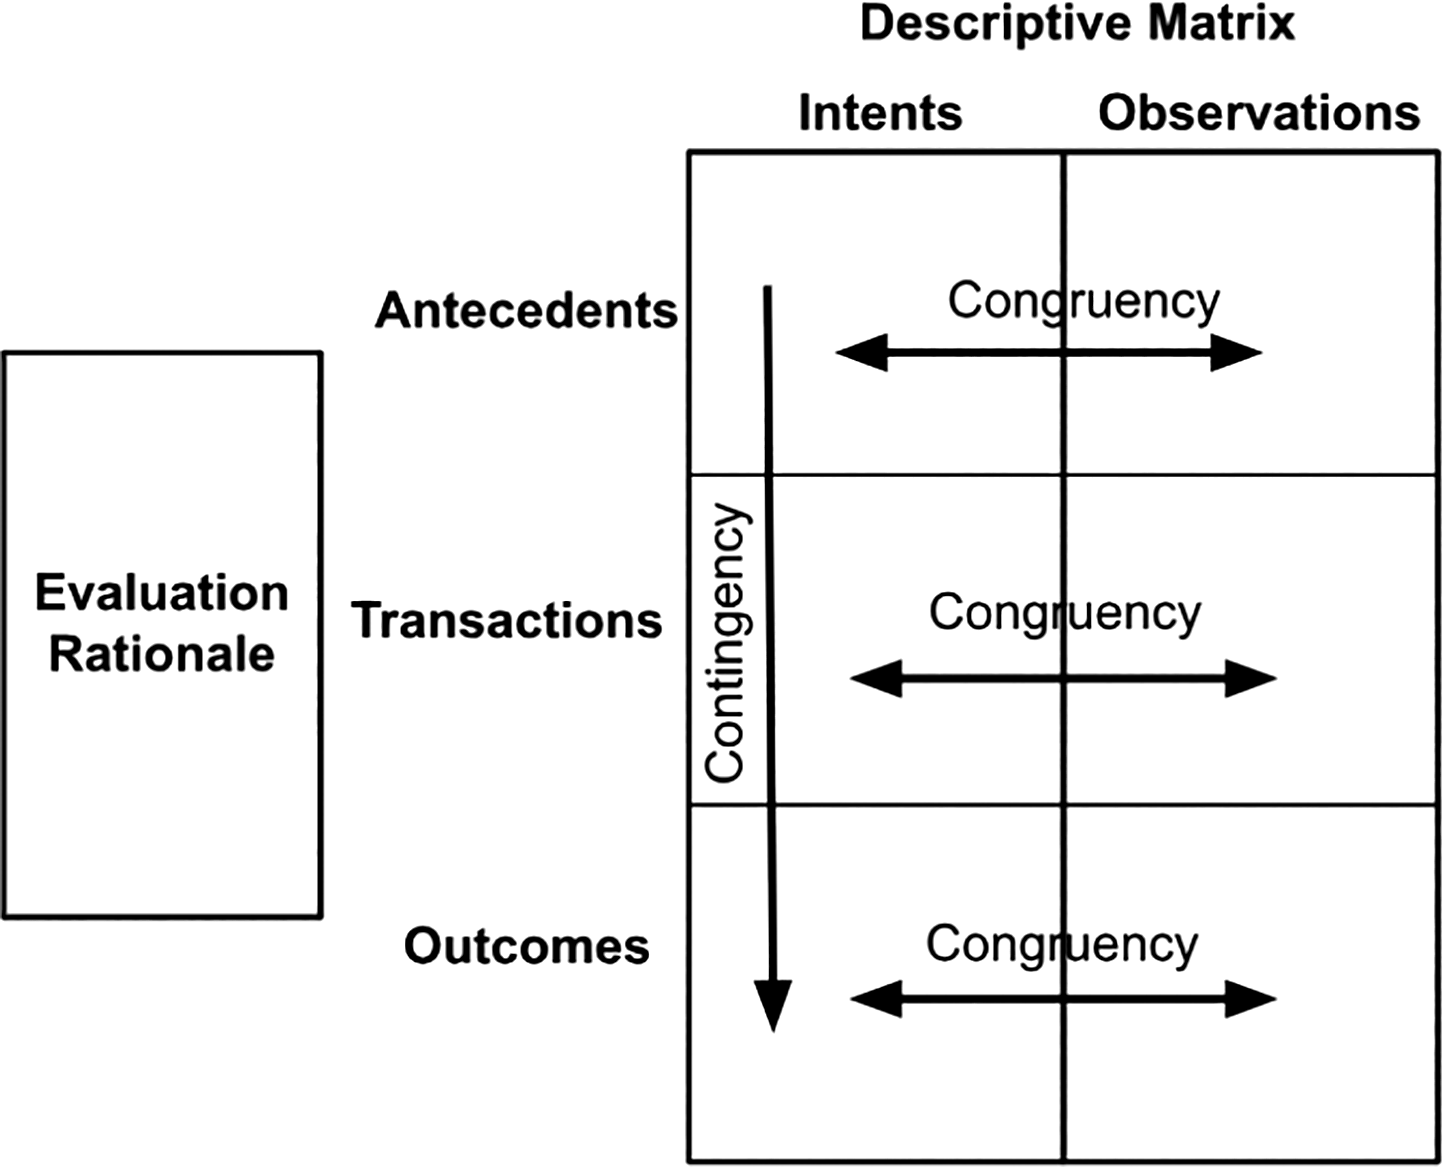
Figure 1
Stake’s Countenance Model for Evaluation—Descriptive (Formative) Evaluations.
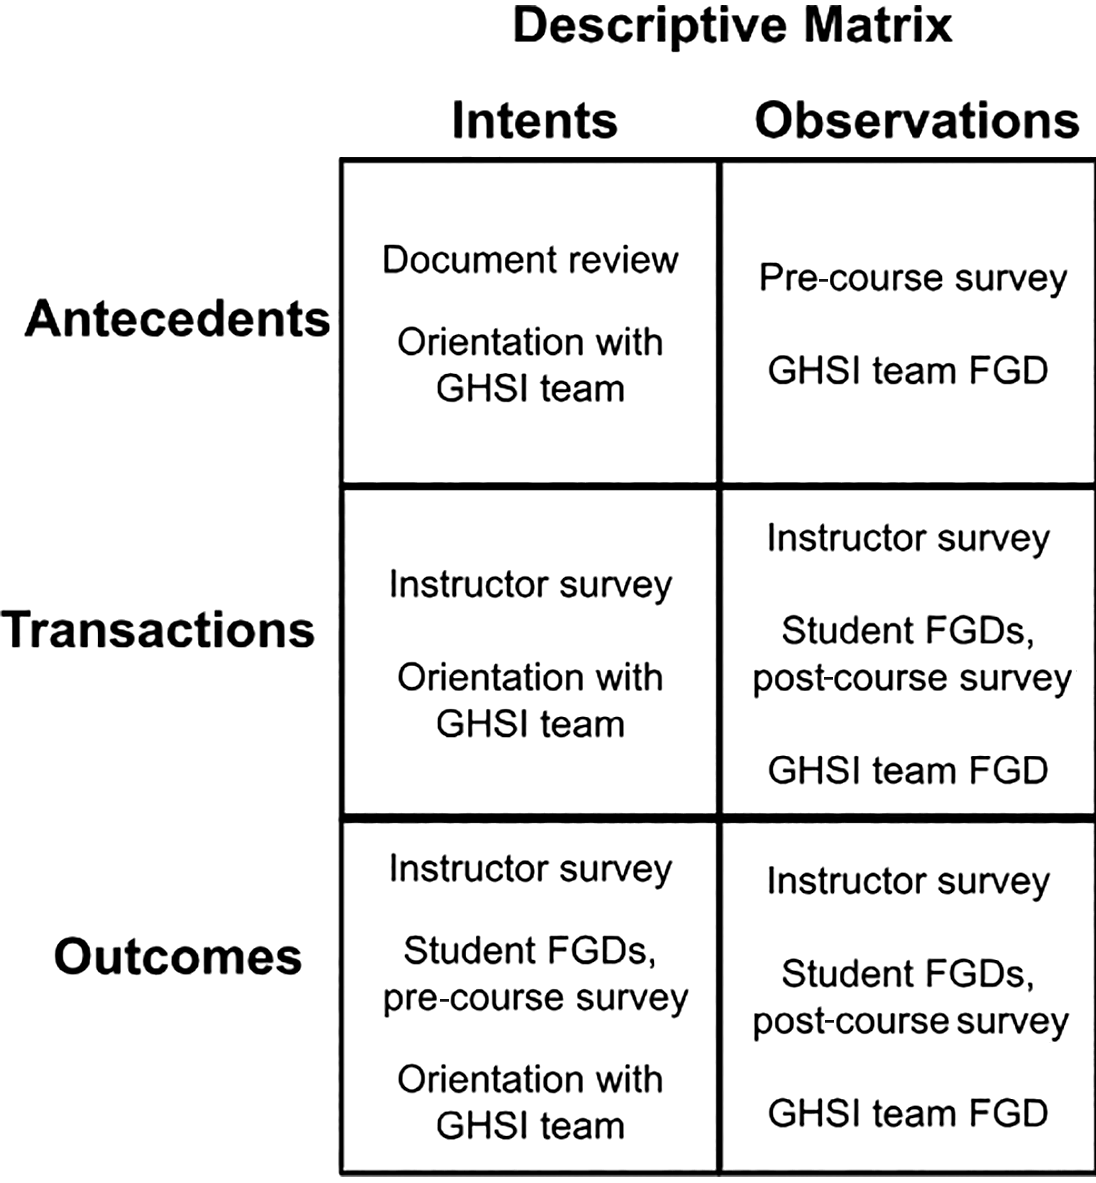
Figure 2
Data source for each component of the Stake matrix.
Table 1
Survey participants.
| DEMOGRAPHIC CATEGORY | PRE‑COURSE SURVEY (N = 137) N (%) | POST‑COURSE SURVEY (N = 78) N (%) |
|---|---|---|
| Gender | ||
| Women | 89 (59.7%) | 48 (55.2%) |
| Men | 25 (16.8%) | 18 (20.7%) |
| Cisgender | 26 (17.4%) | 17 (19.5%) |
| Genderqueer | 4 (2.7%) | 1 (1.1%) |
| Nonbinary | 3 (2.0%) | 3 (3.4%) |
| Transgender | 1 (0.7%) | – |
| Not listed | 1 (0.7%) | – |
| Ethnicity | ||
| Native American | 2 (1.4%) | 3 (3.7%) |
| Asian | 31 (21.4%) | 16 (19.8%) |
| Black | 40 (27.6%) | 28 (34.6%) |
| Hispanic/Latino | 10 (6.9%) | 7 (8.6%) |
| Indigenous | 1 (0.7%) | – |
| Middle Eastern | 6 (4.1%) | 3 (3.7%) |
| Pacific Islander | 1 (0.7%) | – |
| South Asian | 15 (10.3%) | 4 (4.9%) |
| White | 27 (18.6%) | 20 (24.7%) |
| Not listed | 12 (8.2%)1 | 3 (3.7%)2 |
| 1 = African, Caribbean, Central American, Turkish, Brazilian, Prefer not to disclose 2 = African, Caribbean | ||
| Age band | ||
| 18–29 | 37 (27.1%) | 20 (25.6%) |
| 30–39 | 61 (44.5%) | 32 (41.0%) |
| 40‑49 | 33 (24.1%) | 20 (25.6%) |
| 50‑59 | 2 (1.5%) | 1 (1.3%) |
| No answer | 4 (2.9%) | 5 (6.4%) |
| Employer | ||
| Academia | 16 (11.7%) | 13 (16.7%) |
| Business | 4 (2.9%) | 2 (2.6%) |
| Civil society/non‑governmental organization | 50 (36.5%) | 28 (35.9%) |
| Consultant/ independent | 18 (13.1%) | 12 (15.3%) |
| Funder | 3 (2.2%) | 1 (1.3%) |
| Government | 15 (10.9%) | 5 (6.4%) |
| Student | 9 (6.7%) | 4 (5.1%) |
| Unemployed | 1 (0.1%) | 1 (1.3%) |
| Other | 173 (12.4%) | 74 (9.0%) |
| No answer | 4 (2.9%) | 5 (6.4%) |
| 3 = Community advocate, Hospital/clinical setting, International organization, multiple employers, UN 4 = Donor‑funded project, Hospital/clinical setting, International organization, UN | ||
Table 2
Focus group discussion participants.
| DEMOGRAPHIC CATEGORY | PARTICIPANTS – N (%) |
|---|---|
| Gender | |
| Women | 4 (80%) |
| Men | 1 (20%) |
| Employer | |
| Civil society/non‑governmental organization | 3 (60%) |
| Student | 1 (20%) |
| Government | 1 (20%) |
| Geographic Location | |
| Outside the US | 4 (80%) |
| USA | 1 (20%) |
Table 3
Knowledge and skills students sought from the course.
| THEME | WHAT KNOWLEDGE AND/OR SKILLS DO YOU HOPE TO GAIN AS A RESULT OF TAKING THIS COURSE? ILLUSTRATIVE QUOTES |
|---|---|
| Application (33%) | “How to do step by step, practically, a gender assessment in a health program” |
| Knowledge (35%) | “Learn about key gender frameworks and how to apply them to global women’s health” |
| Research (12%) | “How to apply sex and gender in the various stages of research” |
| Measurement (8%) | “Learn more about the ways we can measure sexual orientation, gender identity, and gender expression” |
| Design (5%) | “Developing health programs that account for gender equity” |
| Policy (5%) | “Gender‑based violence prevention and response and policy influencing and advocacy” |
| Networking (2%) | “I hope to interact with different professionals, make professional links and keep in conversation, learning from each other” |
Table 4
Students’ intended applications of the course content.
| THEME | HOW DO YOU INTEND TO USE THE COURSE KNOWLEDGE IN YOUR CAREER? ILLUSTRATIVE QUOTATIONS |
|---|---|
| Non‑specific job application (24%) | “Bring a gender lens into my work” |
| Specific aspects of existing job (22%) | “I am currently working for a consortium working on disability inclusion—advocacy is a critical part of our program…. Women and girls with disabilities often face greater and more complex challenges in accessing health services and full enjoyment of their rights. I feel that a better understanding of gender‑transformative advocacy frameworks would be beneficial for how we design and deliver our program” |
| Planned upcoming activity (20%) | “To inform the development of a quality assessment on GBV services in LMICs” |
| Research (17%) | “I intend to use this course to develop my academic and research career in gender research for current and future work” |
| Growth and mentorship (10%) | “To promote the advancement of women, including myself, in public health” |
| Preparation for new role (8%) | “I hope to get a job in preventing disparities within women’s health, working in maternal care in a hospital setting” |
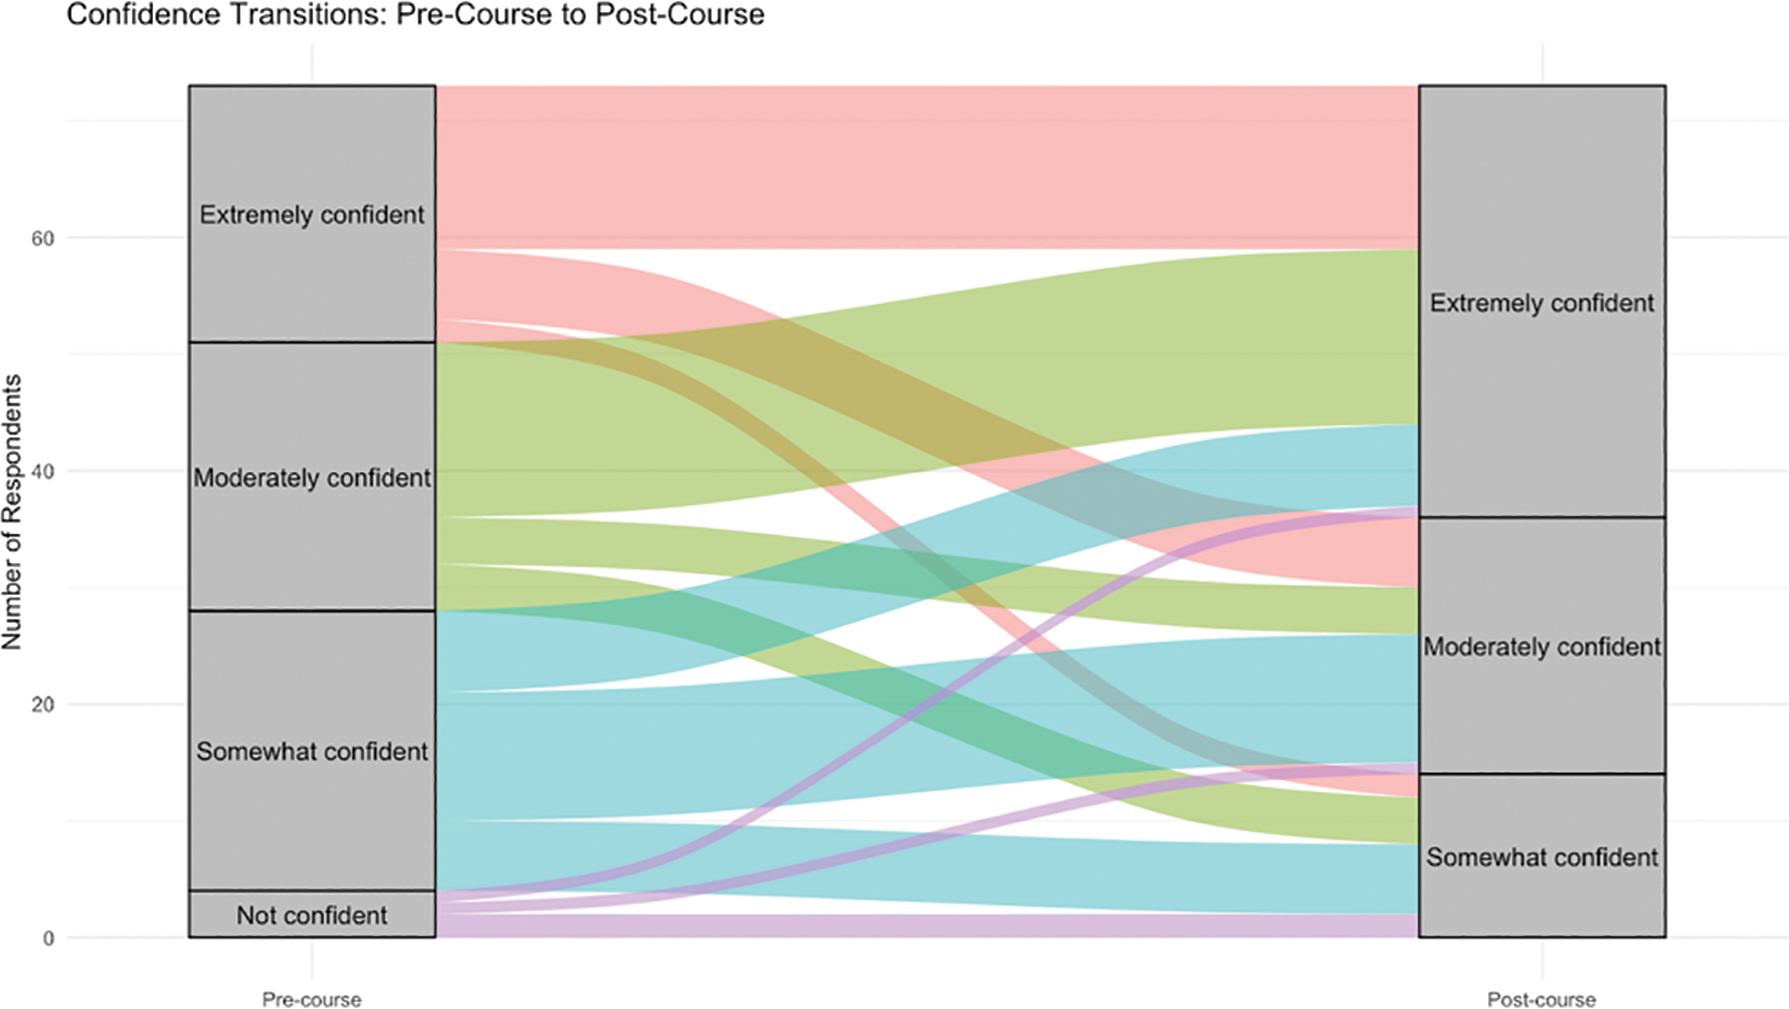
Figure 3
Trends in confidence between pre‑ and post‑course assessments.
Table 5
Trends in student confidence by demographic characteristics—proportion of students indicating the given confidence level in applying course material at pre‑ and post‑course timepoints.
| PRE‑COURSE | POST‑COURSE | |||||||
|---|---|---|---|---|---|---|---|---|
| EXTREMELY CONFIDENT | MODERATELY CONFIDENT | SOMEWHAT CONFIDENT | NOT CONFIDENT | EXTREMELY | MODERATELY | SOMEWHAT | NOT CONFIDENT | |
| Primary Race/Ethnicity | ||||||||
| A racial/ethnic identity not listed here (n = 2) | 0.50 | 0.50 | 0.0 | 0.0 | 0.50 | 0.00 | 0.50 | 0 |
| Asian (n = 14) | 0.36 | 0.07 | 0.43 | 0.14 | 0.43 | 0.43 | 0.14 | 0 |
| Black (n = 26) | 0.38 | 0.31 | 0.27 | 0.04 | 0.65 | 0.19 | 0.15 | 0 |
| Hispanic/Latino/x (n = 4) | 0.00 | 0.75 | 0.25 | 0.00 | 0.25 | 0.25 | 0.50 | 0 |
| Middle Eastern (n = 2) | 0.5 | 0.00 | 0.5 | 0.00 | 0.00 | 1.00 | 0.00 | 0 |
| South Asian (n = 3) | 0.00 | 1.00 | 0.00 | 0.00 | 0.33 | 0.67 | 0.00 | 0 |
| White (n = 13) | 0.23 | 0.15 | 0.54 | 0.08 | 0.38 | 0.38 | 0.23 | 0 |
| Primary Gender Identity | ||||||||
| Cisgender (n = 6) | 0.33 | 0.50 | 0.17 | 0.00 | 0.33 | 0.50 | 0.17 | 0 |
| Genderqueer (n = 1) | 1.00 | 0.00 | 0.00 | 0.00 | 1.00 | 0.00 | 0.00 | 0 |
| Man (n = 17) | 0.38 | 0.38 | 0.25 | 0.00 | 0.69 | 0.31 | 0.00 | 0 |
| Nonbinary (n = 2) | 0.00 | 0.50 | 0.50 | 0.00 | 0.00 | 1.00 | 0.00 | 0 |
| Woman (n = 39) | 0.28 | 0.21 | 0.41 | 0.10 | 0.44 | 0.28 | 0.28 | 0 |
Table 6
Congruence between intentions and observed effects.