
Table 1
Descriptive characteristics of 848 participants stratifying for high or low knowledge of AMR.
| OVERALL (N = 848) | HIGH KAP2 (N = 512) | LOW KAP3 (N = 336) | P-VALUE | |
|---|---|---|---|---|
| Which gender do you identify with? | ||||
| Female | 607 (71.6%) | 393 (76.8%) | 214 (63.7%) | <0.001 |
| Male | 229 (27.0%) | 114 (22.3%) | 115 (34.2%) | |
| Nonbinary | 4 (0.5%) | 3 (0.6%) | 1 (0.3%) | |
| Other | 2 (0.2%) | 0 (0%) | 2 (0.6%) | |
| Missing | 6 (0.7%) | 2 (0.4%) | 4 (1.2%) | |
| Age | ||||
| Median [Q1, Q3] | 22.0 [21.0, 25.0] | 22.0 [21.0, 26.0] | 22.0 [21.0, 24.0] | 0.0014 |
| Missing | 14 (1.7%) | 6 (1.2%) | 8 (2.4%) | |
| Current position | ||||
| Working | 316 (37.3%) | 217 (42.4%) | 99 (29.5%) | <0.001 |
| Studying | 525 (61.9%) | 294 (57.4%) | 231 (68.8%) | |
| Missing | 7 (0.8%) | 1 (0.2%) | 6 (1.8%) | |
| Area | ||||
| Central Italy | 58 (6.8%) | 47 (9.2%) | 11 (3.3%) | 0.00424 |
| Northern Italy | 71 (8.4%) | 44 (8.6%) | 27 (8.0%) | |
| Southern Italy | 698 (82.3%) | 412 (80.5%) | 286 (85.1%) | |
| Missing | 21 (2.5%) | 9 (1.8%) | 12 (3.6%) | |
| Profession | ||||
| Nurse | 307/316 (97.2%) | 213/316 (67.4%) | 94/316 (29.7%) | - |
| Healthcare profession | 8 (0.9%) | 3 (0.6%) | 5 (1.5%) | |
| Bachelor’s degree | ||||
| Other | 2 (0.2%) | 1 (0.2%) | 1 (0.3%) | 0.984 |
| Nursing | 516 (60.8%) | 289 (56.4%) | 227 (67.6%) | |
| Obstetrics (midwife) | 7 (0.8%) | 4 (0.8%) | 3 (0.9%) | |
| Missing | 323 (38.1%) | 218 (42.6%) | 105 (31.3%) | |
| Setting | ||||
| Other services | 209 (24.6%) | 125 (24.4%) | 84 (25.0%) | 0.808 |
| Ambulatory/DH | 6 (0.7%) | 5 (1.0%) | 1 (0.3%) | |
| Intensive care | 35 (4.1%) | 24 (4.7%) | 11 (3.3%) | |
| Obstetrics | 23 (2.7%) | 16 (3.1%) | 7 (2.1%) | |
| Emergency room | 54 (6.4%) | 31 (6.1%) | 23 (6.8%) | |
| Rehabilitation | 12 (1.4%) | 7 (1.4%) | 5 (1.5%) | |
| Surgical setting | 171 (20.2%) | 101 (19.7%) | 70 (20.8%) | |
| Clinical setting | 240 (28.3%) | 150 (29.3%) | 90 (26.8%) | |
| Missing | 98 (11.6%) | 53 (10.4%) | 45 (13.4%) | |
| Academic year | ||||
| First year | 45 (5.3%) | 9 (1.8%) | 36 (10.7%) | <0.001 |
| Second year | 282 (33.3%) | 180 (35.2%) | 102 (30.4%) | |
| Third year | 192 (22.6%) | 101 (19.7%) | 91 (27.1%) | |
| Missing | 329 (38.8%) | 222 (43.4%) | 107 (31.8%) | |
| Years of service | ||||
| Median [Q1, Q3] | 5.00 [2.50, 12.0] | 5.00 [2.00, 12.0] | 6.50 [3.00, 11.5] | 0.27 |
| Missing | 533 (62.9%) | 296 (57.8%) | 237 (70.5%) | |
| Did you receive any education on AMR from your hospital/university? Answer: “Yes” | 156 (18.4%) | 101 (19.7%) | 55 (16.4%) | 0.253 |
| How were you trained on the subject of AMR? | ||||
| Self taught | 315 (37.1%) | 216 (42.2%) | 99 (29.5%) | <0.001 |
| Master courses | 24 (2.8%) | 20 (3.9%) | 4 (1.2%) | 0.0339 |
| University | 519 (61.2%) | 319 (62.3%) | 200 (59.5%) | 0.459 |
| Events funded by pharmaceutical companies? | 8 (0.9%) | 1 (0.2%) | 7 (2.1%) | 0.0156 |
| Hospital meetings | 320 (37.7%) | 195 (38.1%) | 125 (37.2%) | 0.852 |
| Hospital/University meetings with external lecturers | 36 (4.2%) | 25 (4.9%) | 11 (3.3%) | 0.336 |
[i] 1 Bold The p-value represents a statistically significant variable.
[ii] 2 High knowledge, attitude, and practice (KAP) scores related to antimicrobial resistance (AMR).
[iii] 3 Low knowledge, attitude, and practice (KAP) scores related to antimicrobial resistance (AMR).
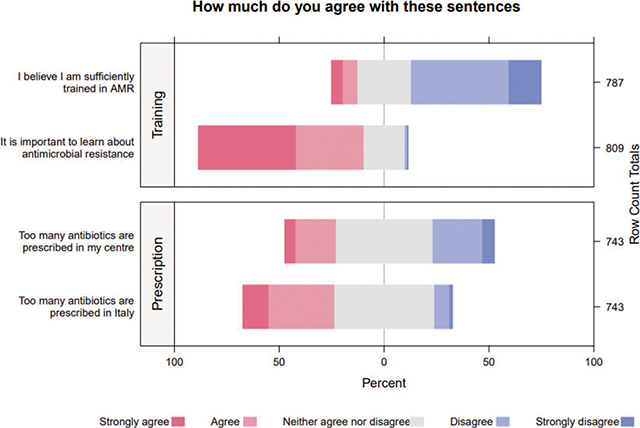
Figure 1
Likert Scale of Training on AMR and Personal Beliefs about the Prescription of Antibiotics.
Table 2
Crude multiple logistic regression for factors associated with high KAP.
| FACTOR | AOR | LOW: 95%CI | HIGH: 95%CI | P-VALUE |
|---|---|---|---|---|
| (reference: Males) | 0.906 | 0.507 | 1.636 | 0.740 |
| Females | 1.699 | 1.232 | 2.344 | 0.001 |
| Being a student | 0.717 | 0.500 | 1.022 | 0.068 |
| Living in Central Italy | 2.507 | 1.098 | 6.029 | 0.033 |
| Living in Southern Italy | 0.479 | 0.220 | 0.962 | 0.048 |
| Being self-taught | 1.538 | 1.126 | 2.110 | 0.007 |
| Having attained a Master class on AMR | 2.954 | 1.020 | 11.169 | 0.068 |
| Working or studying in a setting where AMR training is provided by pharmaceutical companies. | 0.082 | 0.004 | 0.531 | 0.027 |
[i] aOR: adjusted odds ratio; CI: confidence interval; bold p-value represents a statistical significative variable.
Table 3
Composition of the outcome score.
| ITEM | WORKERS (N = 316) | STUDENTS (N = 525) | OVERALL (N = 841) | P-VALUE |
|---|---|---|---|---|
| Knowledge | ||||
| The optimal intravenous infusion time for Piperacillin/Tazobactam is 3 hours/continuous infusion | 152 (48.1%) | 212 (40.4%) | 364 (43.3%) | 0.034 |
| Wearing gloves replaces handwashing | 302 (95.6%) | 510 (97.1%) | 812 (96.6%) | 0.31 |
| The use of hand sanitizer is equivalent to washing hands with soap and water | 204 (64.6%) | 369 (70.3%) | 573 (68.1%) | 0.098 |
| The COVID-19 pandemic has reduced the spread of AMR in our country | 248 (78.5%) | 369 (70.3%) | 617 (73.4%) | 0.011 |
| It is good practice for all hospitalized patients to be under antibiotic coverage | 296 (93.7%) | 419 (79.8%) | 715 (85.0%) | <0.001 |
| In a patient in septic shock, antibiotic administration is one of the actions to be taken during the ‘golden hour’ | 235 (74.4%) | 345 (65.7%) | 580 (69.0%) | 0.010 |
| Which of these procedures is NOT part of the 5 fundamental moments of Hand Hygiene: wash your own hands: | 208 (65.8%) | 279 (53.1%) | 487 (57.9%) | <0.001 |
| Antibiotic resistance is an expressed property | 223 (70.6%) | 385 (73.3%) | 608 (72.3%) | 0.431 |
| KNOWLEDGE SCORE - Mean (SD) | 6.9 (± 1.5) | 6.5 (± 1.4) | 6.7 (± 1.4) | <0.001 |
| Attitudes | ||||
| How willing are you to support a specific Antibiotic Resistance exam during your academic path? | 268 (84.8%) | 384 (73.1%) | 652 (77.5%) | <0.001 |
| How willing are you to attend AMR prevention courses? | 292 (92.4%) | 451 (85.9%) | 743 (88.3%) | 0.006 |
| How willing are you to create a monitoring network for correct antibiotic administration and report any resistance cases? | 291 (92.1%) | 437 (83.2%) | 728 (86.6%) | <0.001 |
| How willing are you to follow indications and procedures that reduce antibiotic resistance? | 300 (94.9%) | 474 (90.3%) | 774 (92.0%) | 0.022 |
| ATTITUDE SCORE - Mean (SD) | 4.6 (± 0.79) | 4.3 (± 1.1) | 4.4 (± 1.0) | <0.001 |
| Practices | ||||
| I wash my hands before putting on gloves | 183 (57.9%) | 276 (52.6%) | 459 (54.6%) | 0.151 |
| I wash my hands after removing gloves | 221 (69.9%) | 326 (62.1%) | 547 (65.0%) | 0.025 |
| I adhere to the antibiotic administration timeframes | 133 (42.1%) | 254 (48.4%) | 387 (46.0%) | 0.088 |
| I use disposable gowns in contact isolations | 175 (55.4%) | 243 (46.3%) | 418 (49.7%) | 0.013 |
| I notice that contact isolations are not adequately indicated | 55 (17.4%) | 112 (21.3%) | 167 (19.9%) | 0.196 |
| I agree that the provided materials (gloves, hand sanitizer, disposable gowns, ROT, etc.) are not readily available | 46 (14.6%) | 95 (18.1%) | 141 (16.8%) | 0.217 |
| I ensure that the urine bag in patients with urinary catheters is lifted off the ground | 174 (55.1%) | 191 (36.4%) | 365 (43.4%) | <0.001 |
| I dedicate time to educate patients, caregivers, colleagues, support staff about infection risks, mitigation, and AMR management | 46 (14.6%) | 86 (16.4%) | 132 (15.7%) | 0.544 |
| Practices score - Mean (SD) | 4.3 (± 2.1) | 4.0 (± 2.4) | 4.1 (± 2.3) | 0.0591 |
| KAP score Mean (SD) | 14 (± 3.0) | 13 (± 3.2) | 13 (± 3.2) | <0.001 |
[i] The table shows the total number and percentage of correct answers. Bold p value represents a statistical significative variable.