
Table 1
Caregivers’ response to “What factors will determine which iron-rich foods you will add to your child’s diet?” pre- and post-education seminar.
| RESPONSE OPTION | PRESEMINAR | POSTSEMINAR |
|---|---|---|
| Availability | 14 | 12 |
| Price | 13 | 10 |
| Already a part of diet/cooked at home | 8 | 10 |
| Easy to cook/add to the diet | 1 | 3 |
| Easy for the child to eat | 5 | 6 |
Table 2
Diet diversity and hemoglobin levels (mg/dl).*
| DIET DIVERSITY | TOTAL NUMBER (N) | HGB LEVEL | SD |
|---|---|---|---|
| Moderate | 39 | 9.89 | 1.44 |
| Poor | 2 | 9.25 | 2.05 |
[i] Hgb denotes hemoglobin, * denotes means, n denotes number, SD denotes standard deviation.
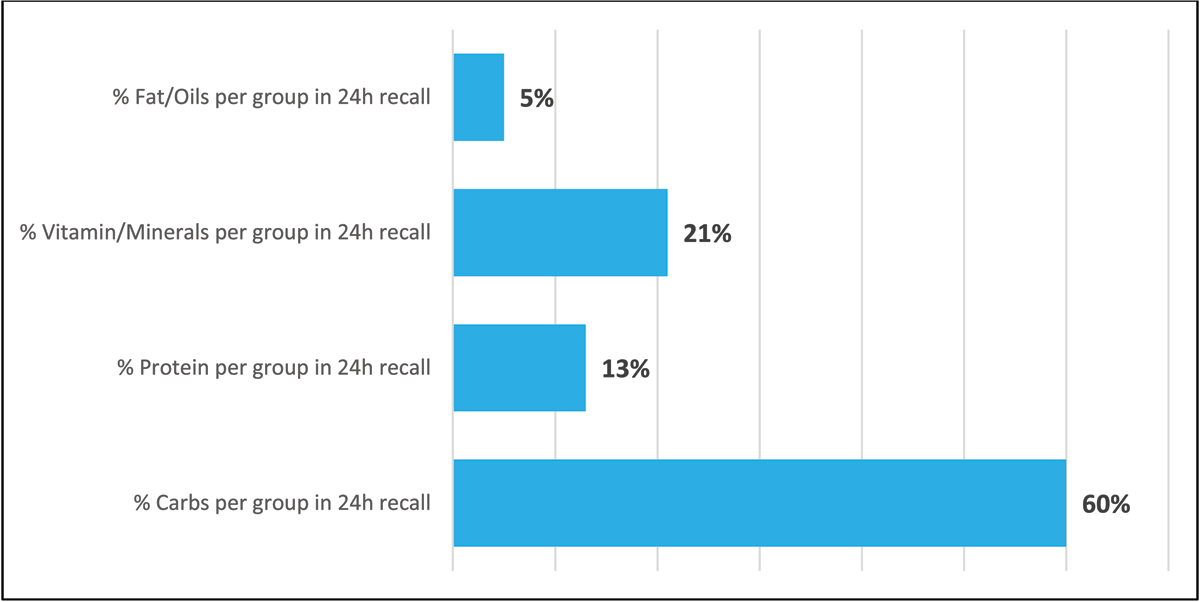
Figure 1
Mean distribution of food group items in family’s diet in last 24 hours.
Table 3
Caregiver-reported greatest barrier to eating a healthier diet compared to post-education seminar caregiver-reported factors that influence how caregivers will add iron-rich foods to their family’s diet.*
| CAREGIVER-REPORTED GREATEST BARRIER TO EATING A HEALTHIER DIET | CAREGIVER-REPORTED FACTORS FOR ADDING IRON-RICH FOODS | AVAILABILITY | PRICE | ALREADY A PART OF DIET/COOKED AT HOME | EASY TO COOK/ADD TO THE DIET | EASY FOR THE CHILD TO EAT | TOTAL |
|---|---|---|---|---|---|---|---|
| Don’t want to make a change | 4 | 2 | 8 | 2 | 1 | 17 | |
| Healthier options too expensive | 5 | 8 | 2 | 0 | 1 | 16 | |
| Not enough information on healthy diets/don’t know what to buy | 1 | 0 | 0 | 1 | 4 | 6 | |
| No access to fresh produce | 2 | 0 | 0 | 0 | 0 | 2 | |
| Total | 12 | 10 | 10 | 3 | 6 | 41 | |
[i] * Denotes the number of caregivers who selected the indicated barrier/factor.
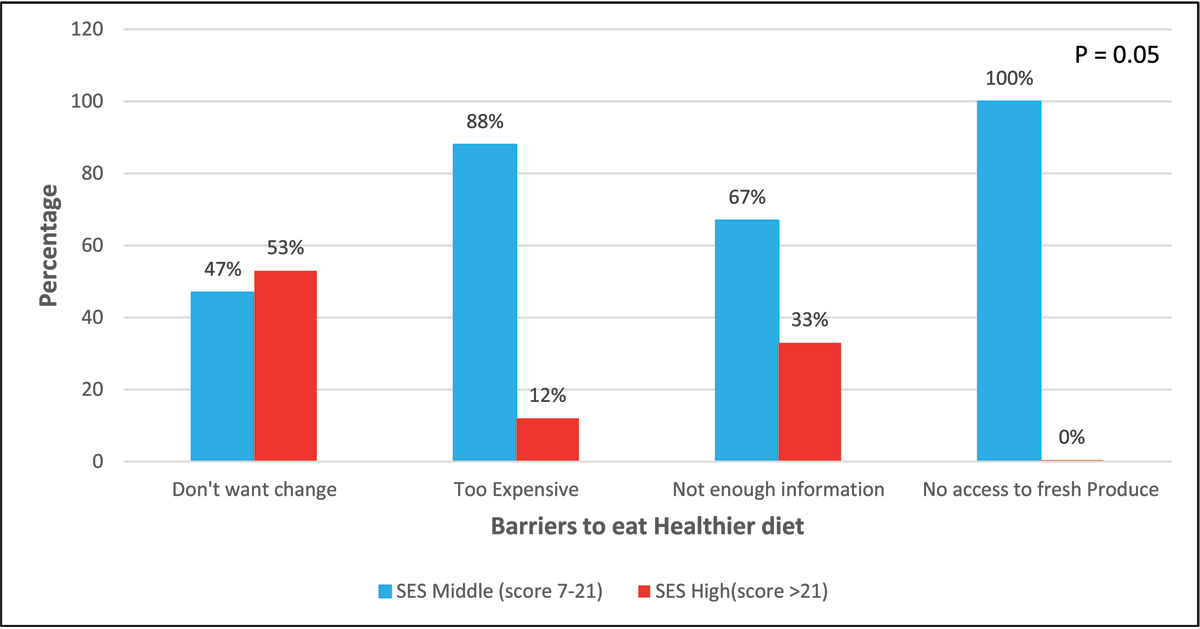
Figure 2
Association between SES and barriers to eating a healthier diet.
Table 4
Caregivers’ response to “What causes anemia?” pre- and post-education seminar.
| RESPONSE OPTION | PRESEMINAR | POSTSEMINAR |
|---|---|---|
| Poor diet | 15 | 19 |
| Lack of iron in blood | 9 | 11 |
| Worms | 0 | 4 |
| None of the above | 9 | 0 |
| All of the above | 1 | 7 |
| Don’t know* | 7 | 0 |
[i] * Caregivers wrote-in “don’t know” on the pretest survey for this response and could not give an educated guess when prompted.
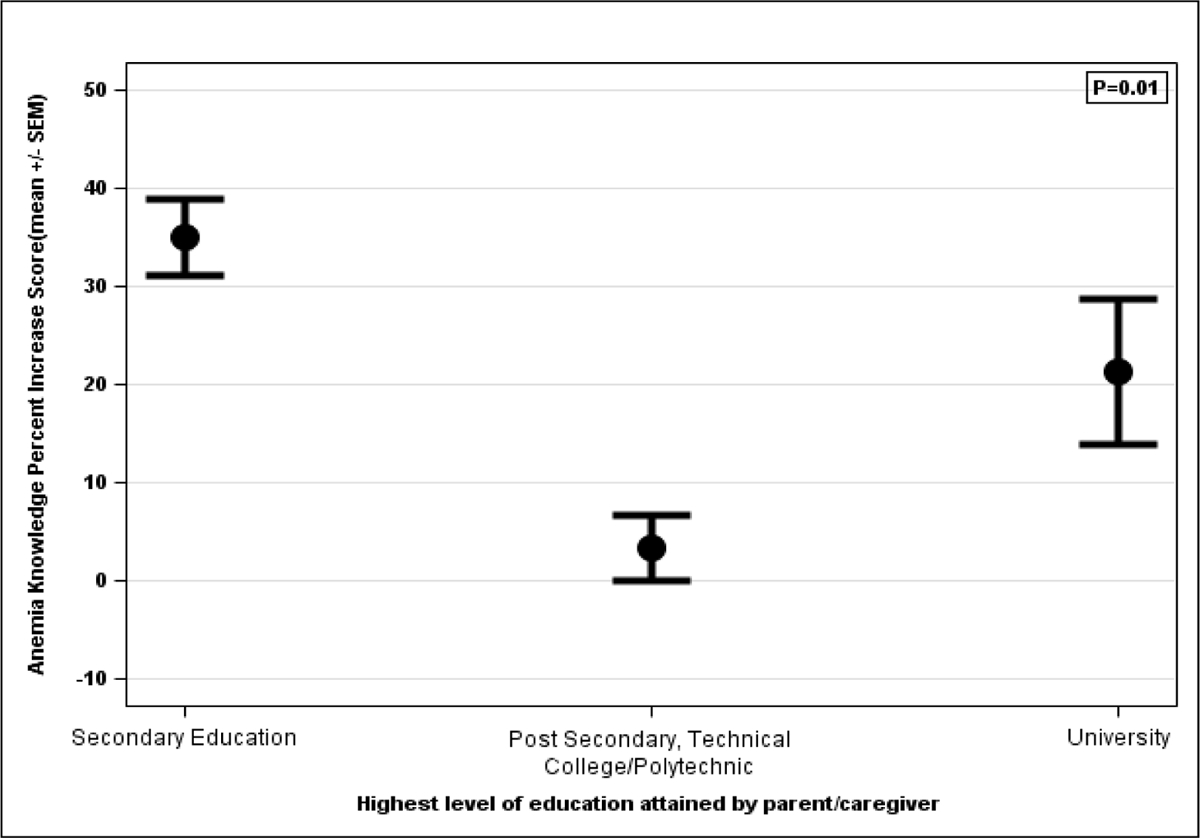
Figure 3
Comparison of percent increase in score based on education.
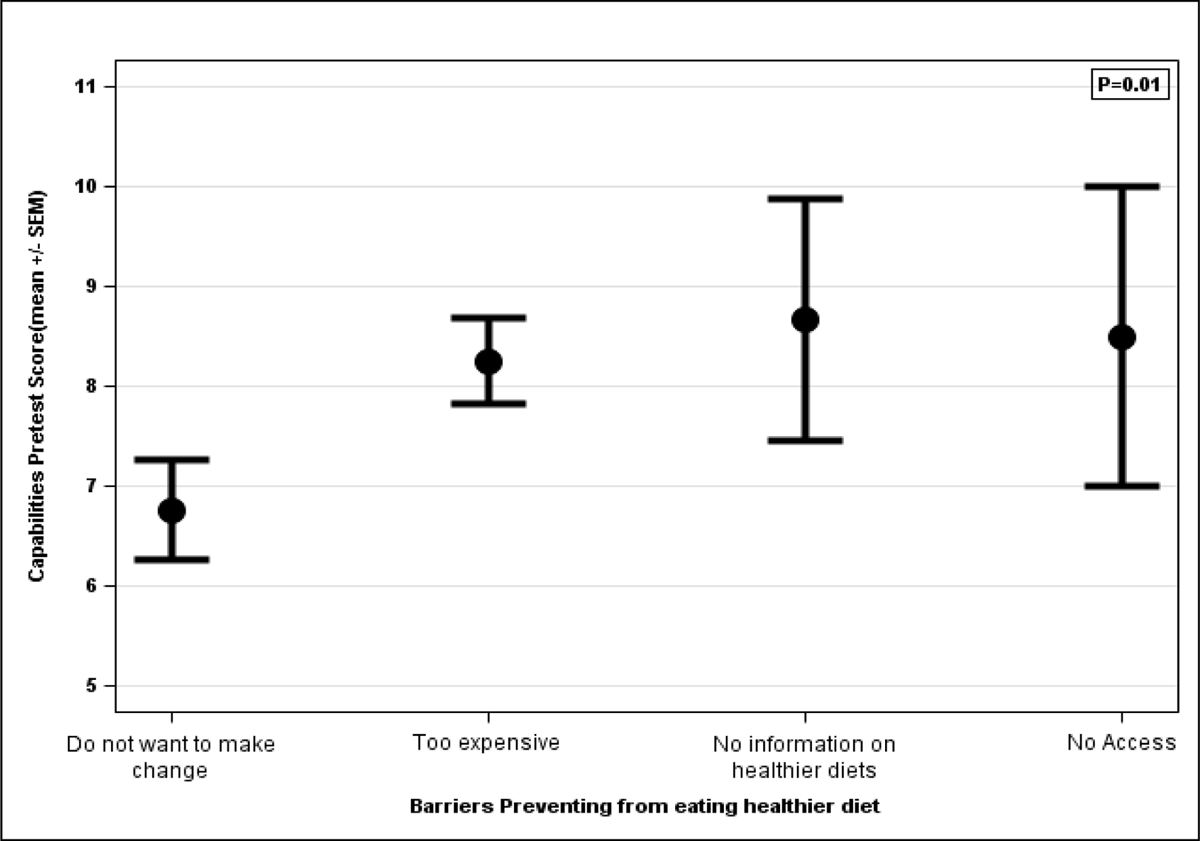
Figure 4
Association between pre-education capabilities scores and barriers to eating healthier diets.
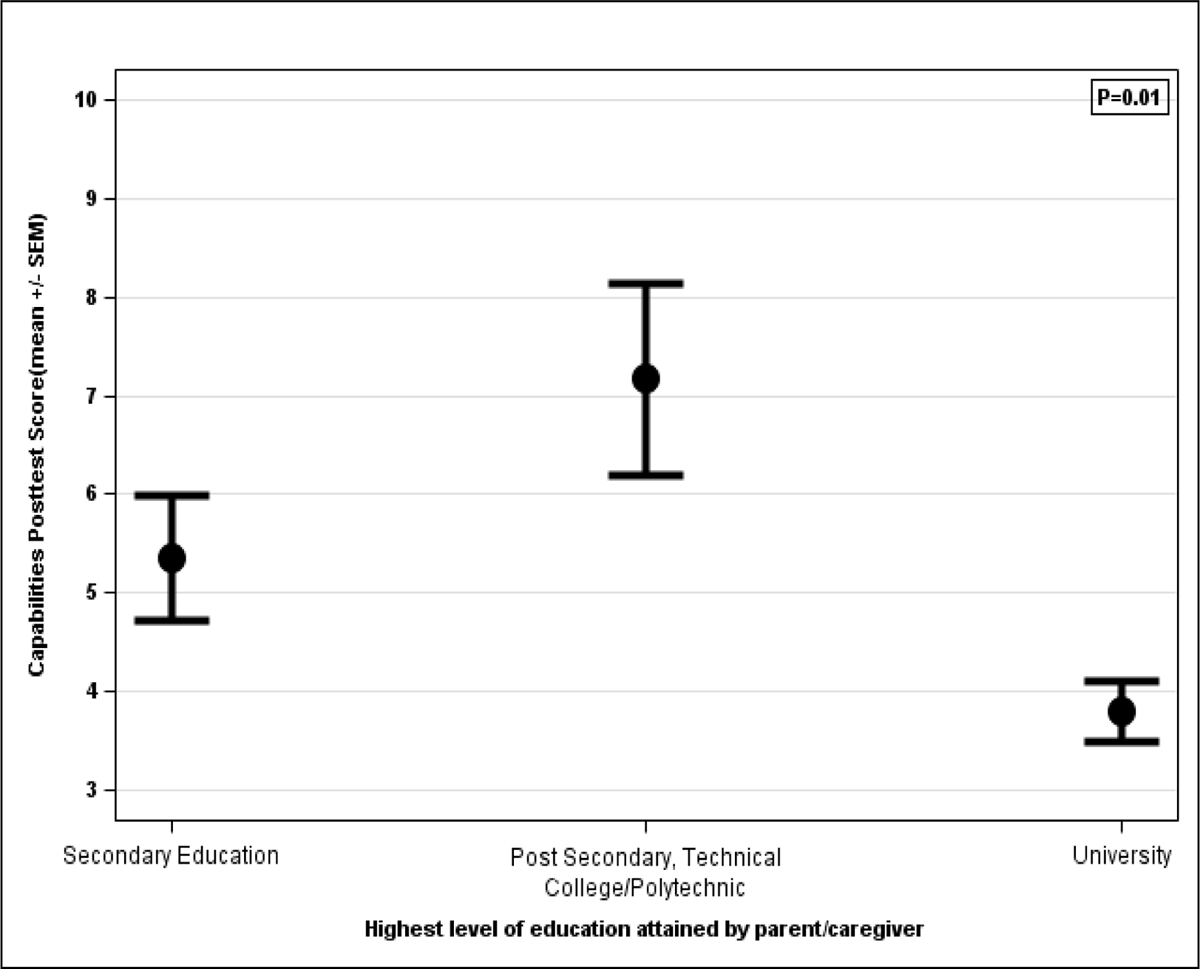
Figure 5
Association between post-education capability scores and caregiver’s highest education level.
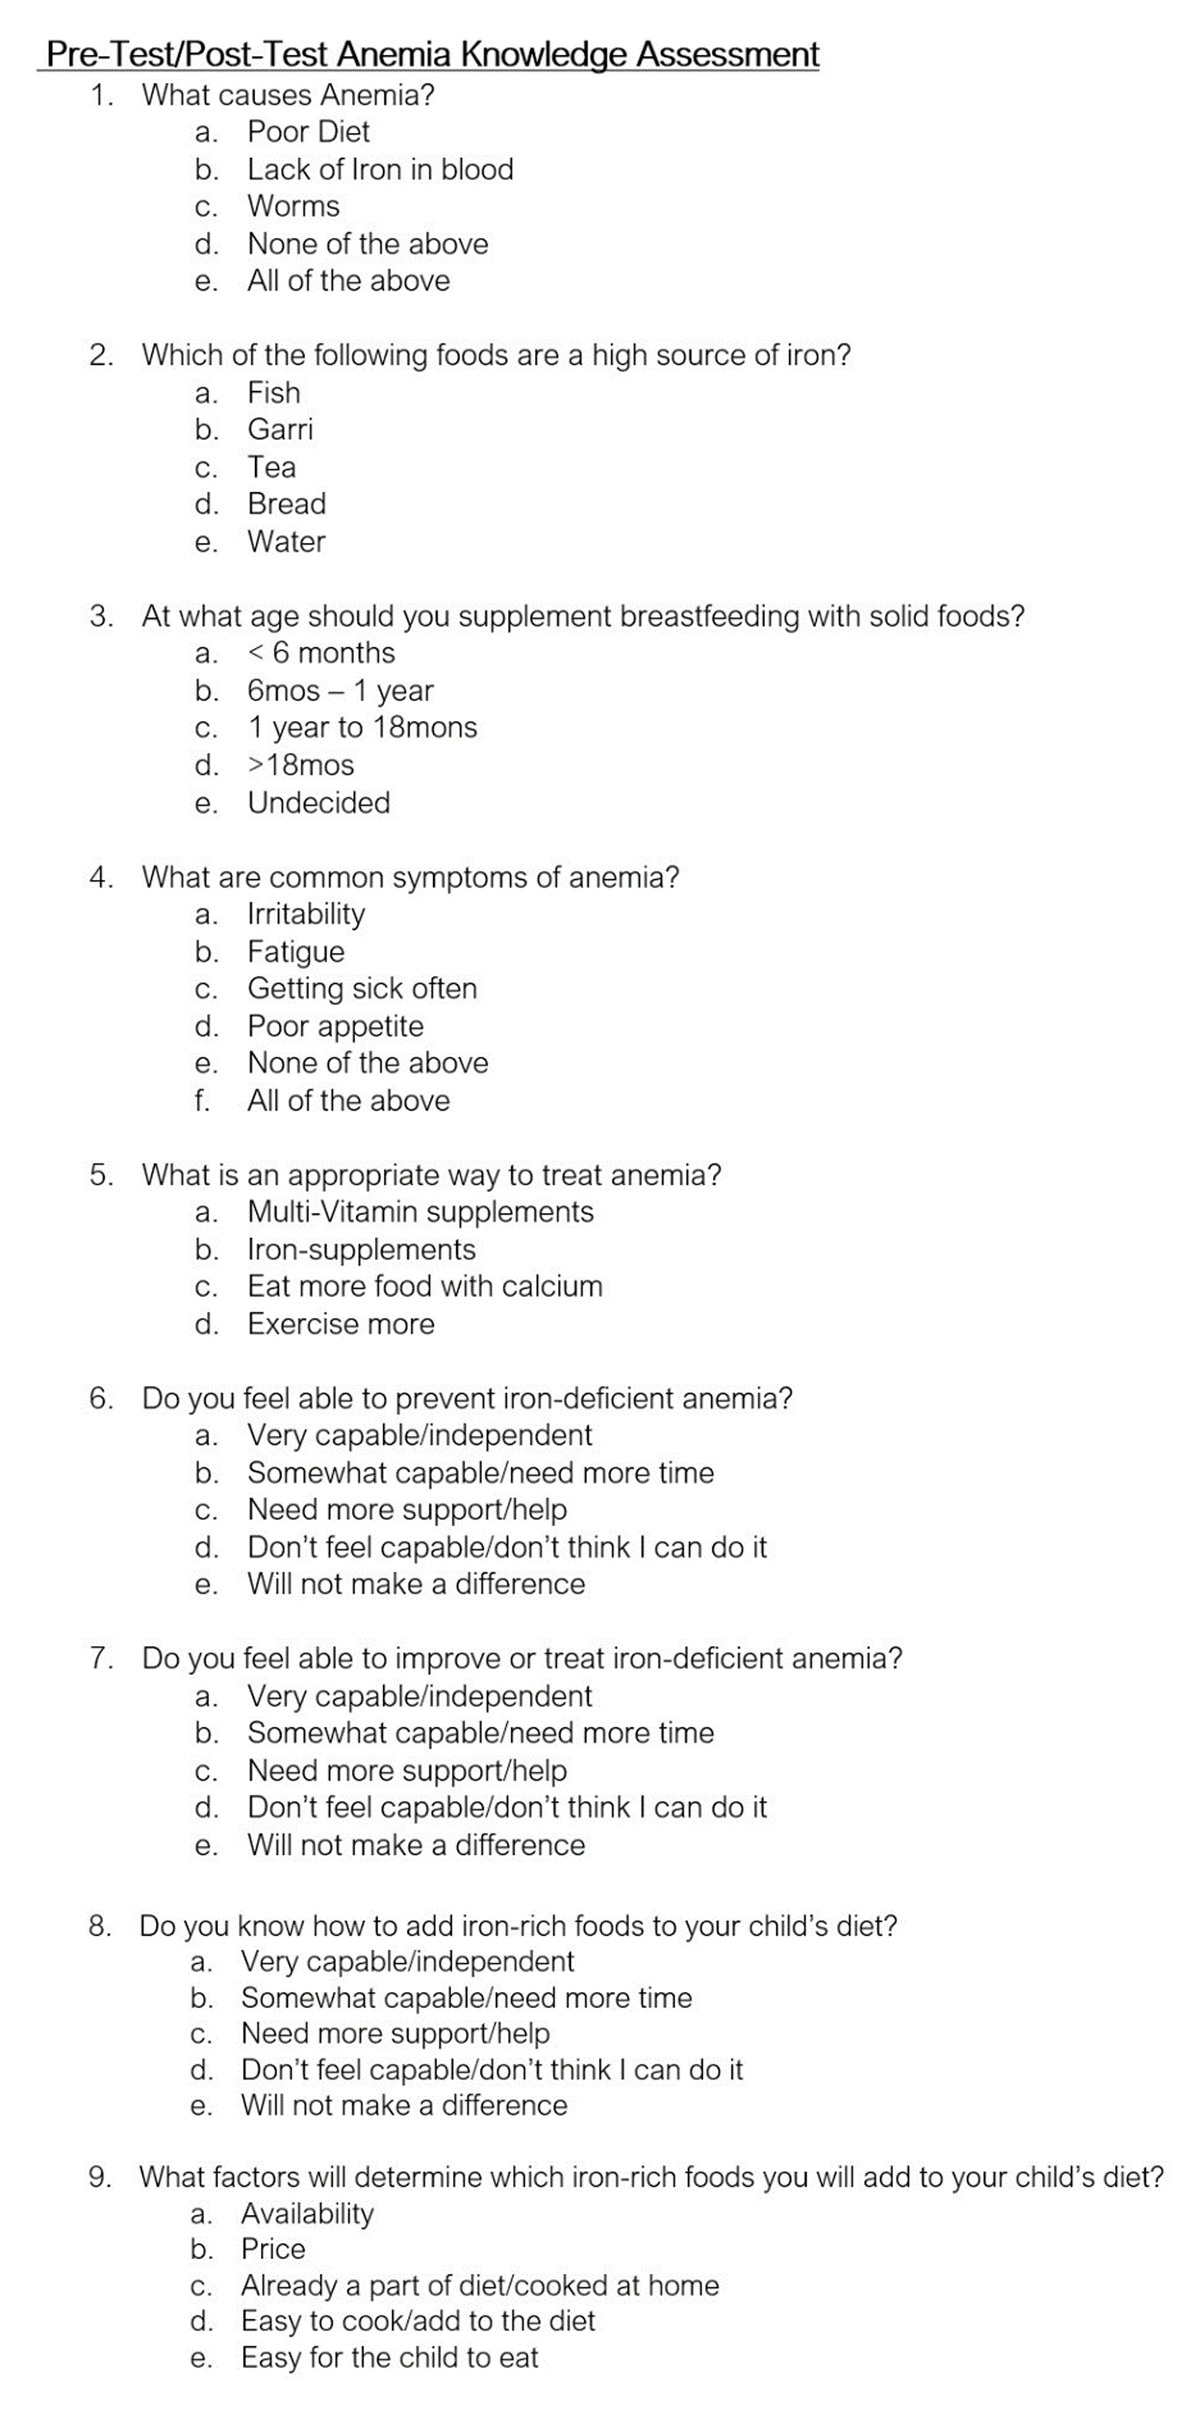
Appendix 1
Pre- and post-education anemia knowledge survey.
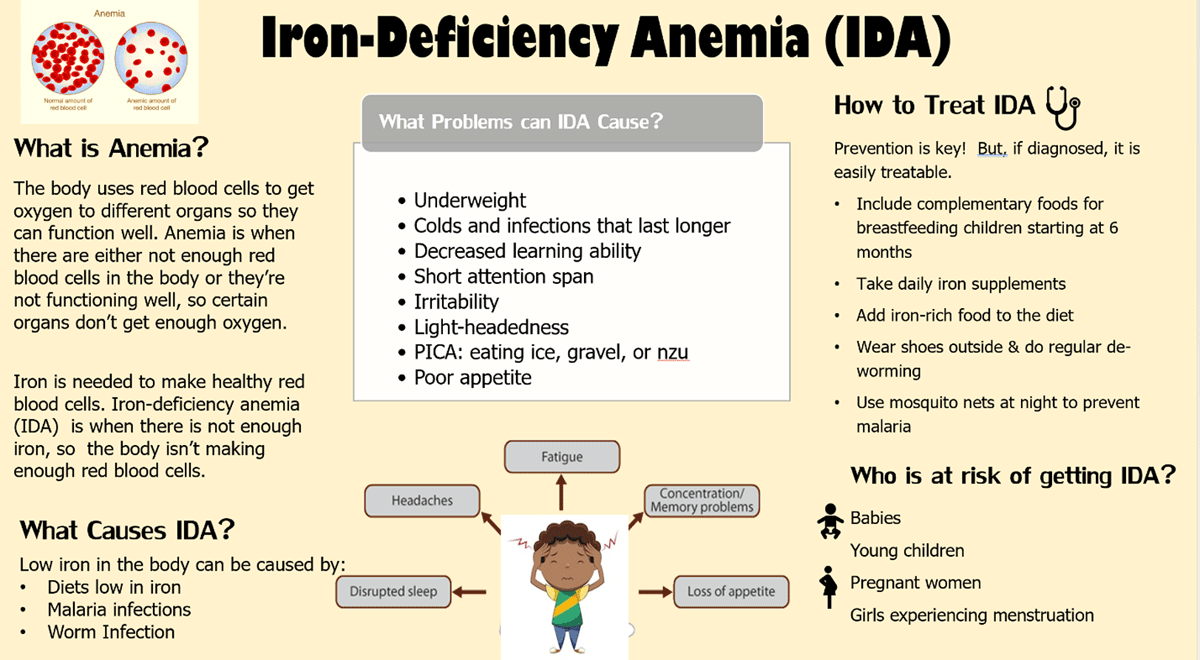
Appendix 2
Health education seminar poster.
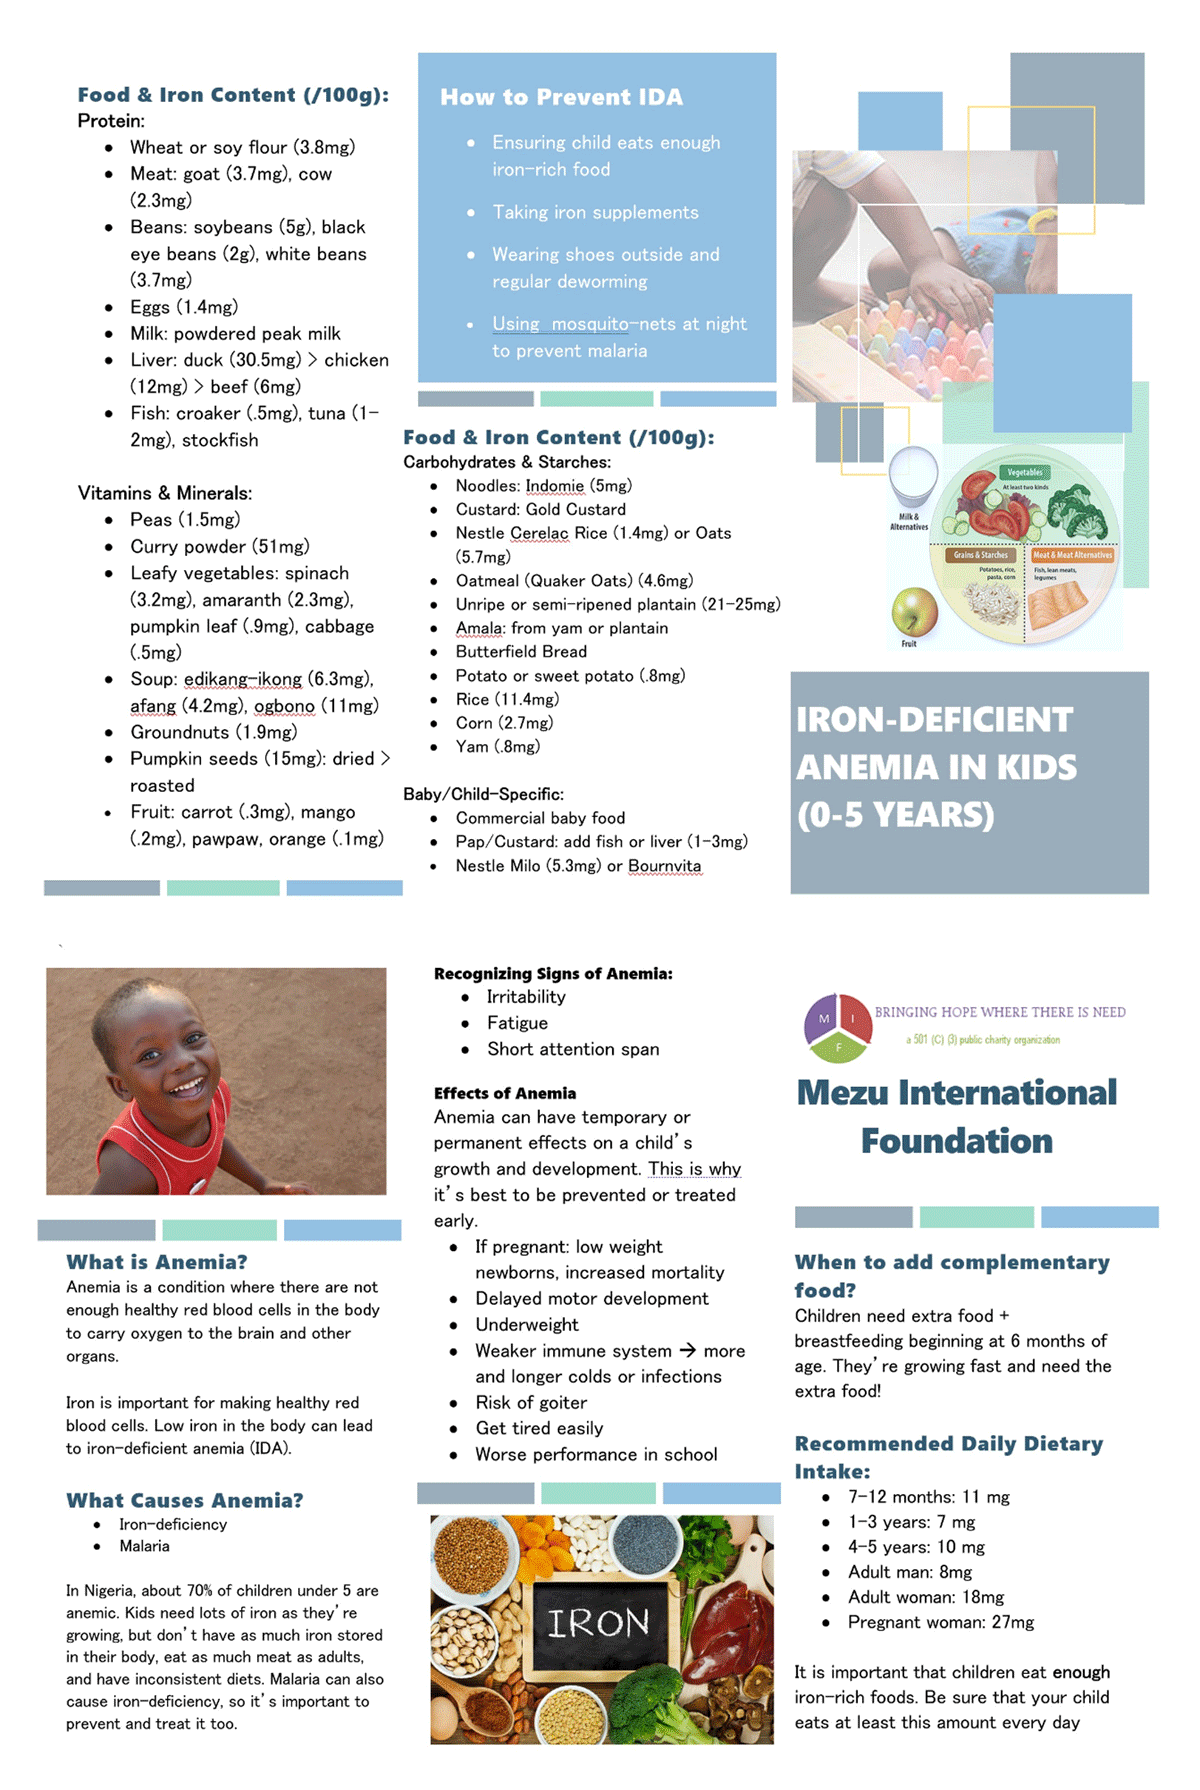
Appendix 3
Pediatric iron-deficiency anemia caregiver brochure [27282930].