
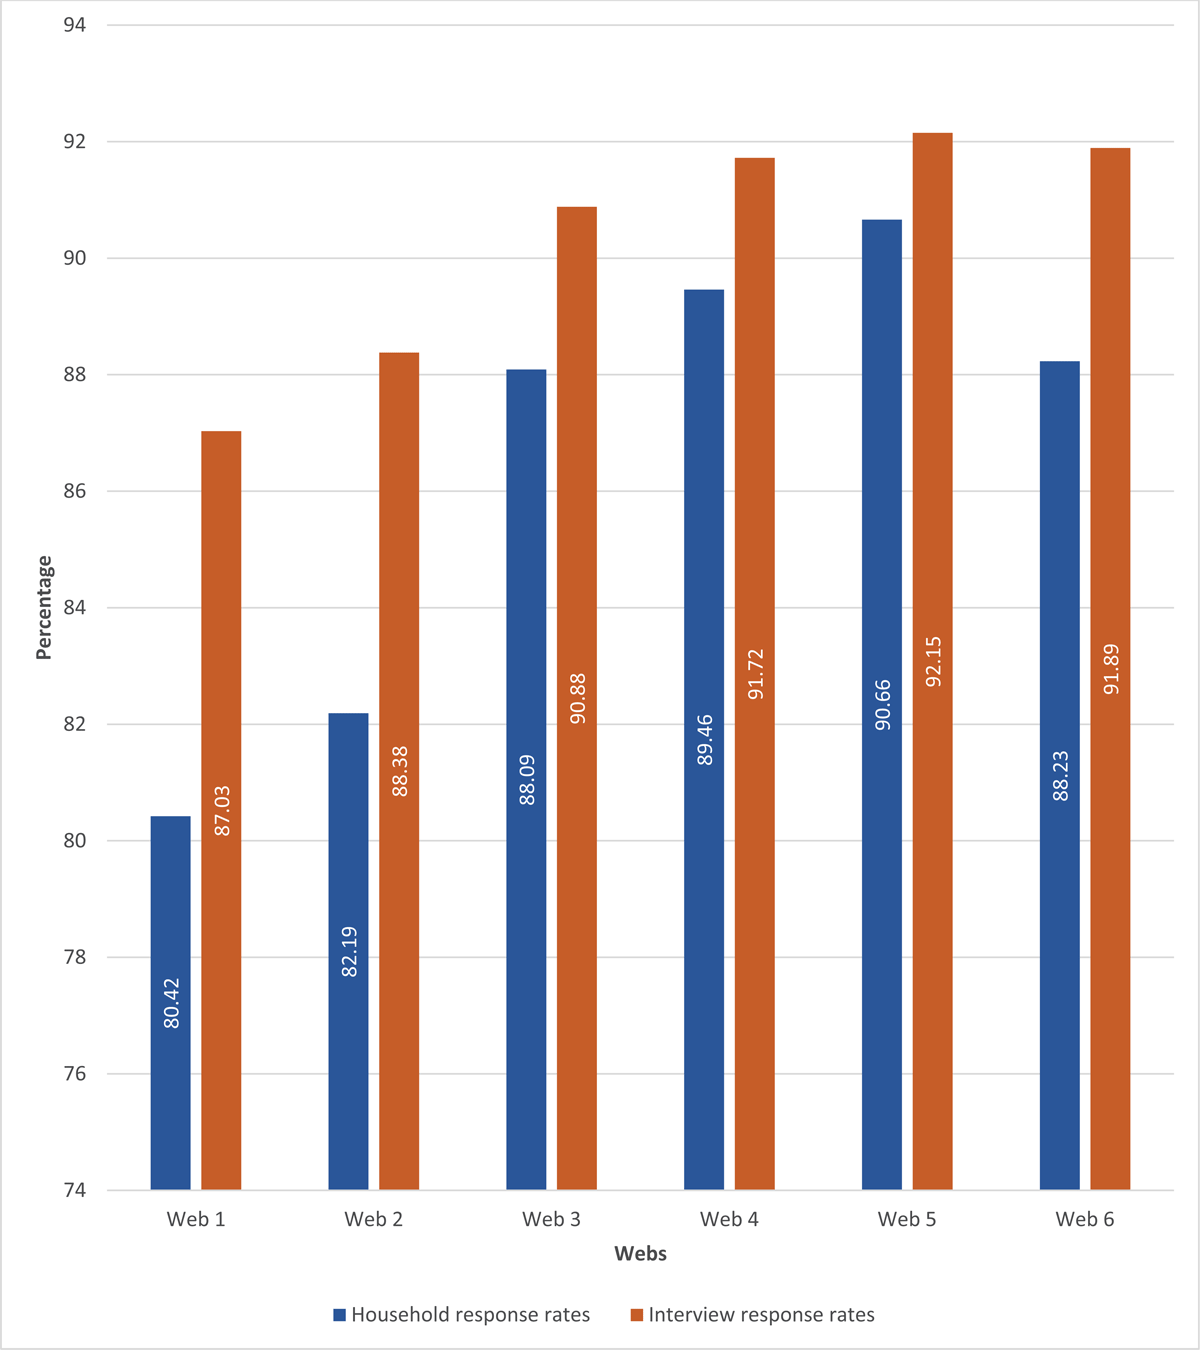
Figure 1
Household and interview response rates.
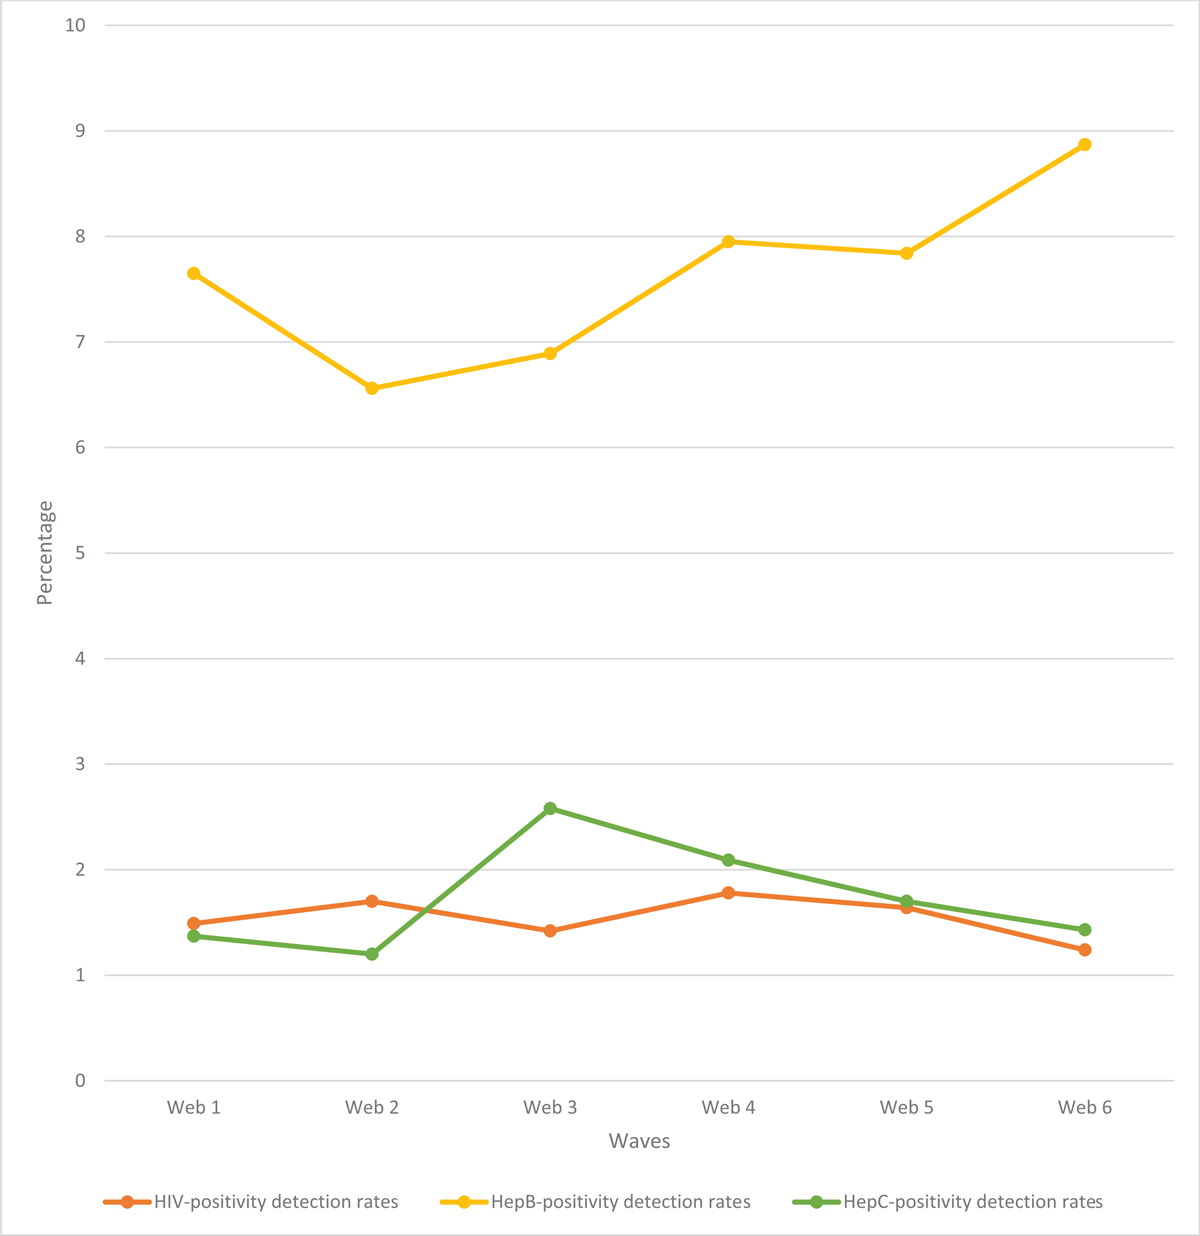
Figure 2
Positivity rates for HIV, Hepatitis B and Hepatitis C.
Table 1
Lab error rate in the Nigeria AIDS Indicator and Impact Survey (NAIIS) across webs.
| WEB | *AVERAGE NUMBER OF DATA COLLECTION DAYS | *NUMBER OF RAPID HIV TESTS DONE | DISCREPANCIES BETWEEN FIELD AND LAB HIV TESTS | ERROR RATE (PROPORTION OF DISCREPANT TESTS) |
|---|---|---|---|---|
| 1 | 30 | 40250 | 65 | 0.16 |
| 2 | 20 | 34298 | 55 | 0.16 |
| 3 | 19 | 40858 | 52 | 0.13 |
| 4 | 18 | 37924 | 40 | 0.11 |
| 5 | 17 | 32546 | 86 | 0.26 |
| 6 | 13 | 21443 | 71 | 0.33 |
[i] * P for trend < 0.01.
Table 2
Comparison of survey outcome rates between conflict and non-conflict zones, NAIIS 2018.
| VARIABLE | WEB 5 | P-VALUE | WEB 6 | P-VALUE | ||||||
|---|---|---|---|---|---|---|---|---|---|---|
| CONFLICT ZONE | NON-CONFLICT ZONE | CONFLICT ZONE | NON-CONFLICT ZONE | |||||||
| N | % | N | % | N | % | N | % | |||
| Household response rate | 4984 | 80.38 | 10647 | 90.94 | <.0001 | 7504 | 57.13 | 5880 | 88.72 | <.0001 |
| Interview response rate | 10172 | 92.31 | 21549 | 92.08 | 0.4700 | 10799 | 92.56 | 9535 | 91.13 | 0.0002 |
| Blood draw acceptance rate | 9390 | 94.42 | 19842 | 93.20 | <.0001 | 9996 | 95.00 | 8689 | 92.61 | <.0001 |
| HIV Positivity rate | 10413 | 2.54 | 22009 | 0.88 | <.0001 | 11349 | 1.03 | 10031 | 1.13 | 0.4990 |
| Hep B positivity rate | 626 | 10.38 | 1020 | 6.27 | 0.0026 | 647 | 9.43 | 684 | 8.33 | 0.4825 |
| Hep C positivity rate | 626 | 3.51 | 1020 | 0.59 | <.0001 | 647 | 2.94 | 0 | 0.00 | <.0001** |
[i] ** Fisher’s exact test used instead of Chi-square test.
N = the total number for that row and specified zone.
Table 3
Association between survey respondents’ characteristics (exposures) and HIV positivity, Hepatitis B positivity, Hepatitis C positivity (outcomes).
| CHARACTERISTICS | HIV POSITIVITY | HEPATITIS-B POSITIVITY | HEPATITIS-C POSITIVITY |
|---|---|---|---|
| OR(95% CI) | OR(95% CI) | OR(95% CI) | |
| Conflict zone | |||
| No | Reference | Reference | Reference |
| Yes | 2.80 (2.08,3.60) | 1.10 (0.72,1.64) | 5.90 (2.17,16.67) |
| Gender | |||
| Male | Reference | Reference | Reference |
| Female | 0.57 (0.48,0.68) | 1.85 (1.27,2.70) | 1.02 (0.44,2.36) |
| Place of Residence | |||
| Urban | Reference | Reference | Reference |
| Rural | 0.72 (0.53,0.98) | 1.20 (0.80,1.79) | 0.38 (0.09,1.69) |
| Wealth Quintile | |||
| Lowest | 0.39 (0.25,0.62) | 1.42 (0.67,3.04) | 13.0 (1.19,141.75) |
| Second | 0.60 (0.39,0.91) | 1.11 (0.54,2.28) | 21.01 (2.51,175.67) |
| Third | 0.65 (0.45,0.94) | 0.94 (0.45,1.96) | 19.58 (2.55,150.47) |
| Fourth | 0.89 (0.66,1.21) | 1.57 (0.8,3.09) | 0.17 (0.07,0.43) |
| Highest | Reference | Reference | Reference |
| Age Category | |||
| 15-24 years | 0.20 (0.13,0.30) | 4.11 (1.77,9.5) | 0.09 (0.02,0.36) |
| 25-34 years | 0.70 (0.5,0.0.98) | 4.61 (1.98,10.72) | 0.22 (0.06,0.74) |
| 35-44 years | 1.32 (0.96,1.82) | 3.48 (1.49,8.11) | 0.32 (0.10,1.10) |
| 45-54 years | 1.19 (0.86,1.65) | 2.51 (0.97,6.53) | 0.96 (0.37,2.47) |
| 55-64 years | Reference | Reference | Reference |
| Web | |||
| Web 5 | Reference | Reference | Reference |
| Web 6 | 0.55 (0.42,0.71) | 1.23 (0.83,1.84) | 0.74 (0.34,1.61) |
[i] OR = adjusted odds ratio; CI = Confidence Interval.