
Table 1
Adjusted lead (Pb) concentrations in spices (mg/kg) with at least two measurements.
| Spice | n | Low | 25 % IQR | Median | 75 % IQR | High |
|---|---|---|---|---|---|---|
| Homes (n = 25) | ||||||
| black pepper | 5 | < LOD | < LOD | < LOD | < LOD | 48.43 |
| coriander | 5 | < LOD | 4.14 | 8.43 | 11.45 | 33.37 |
| khmeli suneli kharcho | 7 | < LOD | 13.62 | 741.98 | 4,218.21 | 4,363.98 |
| kviteli kvavili (‘yellow flower’/marigold mixture) | 7 | < LOD | < LOD | 4,837.22 | 18,293.09 | 20,058.61 |
| qondari | 3 | < LOD | < LOD | < LOD | < LOD | 50.23 |
| red pepper | 7 | < LOD | < LOD | < LOD | < LOD | < LOD |
| svanuri marili | 6 | < LOD | 838.11 | 1,345.53 | 1,645.53 | 2,276.74 |
| table salt | 2 | < LOD | < LOD | 6.02 | 7.89 | 7.89 |
| turmeric | 2 | 466.39 | 466.39 | 1,897.06 | 3,327.72 | 3,327.72 |
| utsko suneli (blue fenugreek mixture | 6 | < LOD | 6.42 | 13.12 | 21.23 | 1,075.84 |
| spice (undefined) | 45 | < LOD | < LOD | < LOD | 5.2 | 1,069.81 |
| Bazaars (n = 4) | ||||||
| khmeli suneli kharcho | 4 | < LOD | < LOD | 1,969.86 | 4,200.31 | 4,465.06 |
| kviteli kvavili (‘yellow flower’/marigold mixture) | 6 | < LOD | < LOD | 5,273.82 | 6,727.14 | 10,564.79 |
| spice (undefined) | 20 | < LOD | < LOD | < LOD | 87.14737 | 846.12 |
[i] * Single samples of bazhe suneli, carraway and zaprana were taken but are not included in the above.
Table 2
Lead concentrations in various media, method of analysis with lower limits of detection, and applicable regulatory standard.
| Medium | Analysis method | n | Unit | Median | IQR | Range | LOD | Regulatory value applied |
|---|---|---|---|---|---|---|---|---|
| Cookware | pXRF | 53 | per cent | 0.011 | 0.011–0.086 | 0.00056–3.395 | 0.00042% | n/a |
| Cookware | LeadCheck® | 53 | positive or negative | neg. | neg. | neg. | 1 mg/cm2 or 3 ug/ml | 2 ug/ml |
| Drinking water | Varian® ICP-AES with GOST 31866-2012 (Russia) | 15 | ppb | 0.8 | 0.25–1.6 | 0.067–7.56 | undefined | 15 |
| Dust (floors) | FAAS CPGM 7303.019B | 37 | µg/ft2 | < LOD | < LOD | < LOD–240 | 65.76 | 40 |
| Dust (windows/elevated surfaces) | FAAS CPGM 7303.019B | 24 | µg/ft2 | < LOD | < LOD | < LOD–600 | 65.76 | 250 |
| Paint | pXRF | 207 | mg/cm2 | < LOD | < LOD –0.06 | < LOD–0.95 | 0.0141 | 1 mg/cm2 |
| Soil | pXRF | 91 | ppm | 16.1 | 10.53–27.51 | 5.65–842.7 | 4.14 | 400 ppm |
| Spices | pXRF | 128 | mg/kg | < LOD | < LOD–110.23 | < LOD–20,058.61 | 4.14 | 2 mg/kg |
| Toys | pXRF | 78 | ppm | < LOD | < LOD | < LOD –1,098.37 | 38.89 | 100 ppm |
Table 3
Spice Pb concentrations and the number of children with BLLs > 5 ug/dL in 2018 MICs study by region.
| Region | n | % of children > 5 ug/dL3 | Low | 25 % IQR | median | 75 % IQR | High |
|---|---|---|---|---|---|---|---|
| Adjara | 73 | 85.4 | < LOD | < LOD | 11.44 | 846.12 | 20,058.61 |
| Guria | 16 | 73.2 | < LOD | < LOD | 7.56 | 140.89 | 3,461.71 |
| Imereti | 25 | 60.8 | < LOD | < LOD | < LOD | < LOD | 3,327.72 |
| Shida Kartli | 2 | 21.4 | < LOD | < LOD | < LOD | < LOD | < LOD |
| Tbilisi | 12 | 30.1 | < LOD | < LOD | < LOD | < LOD | 22.15 |
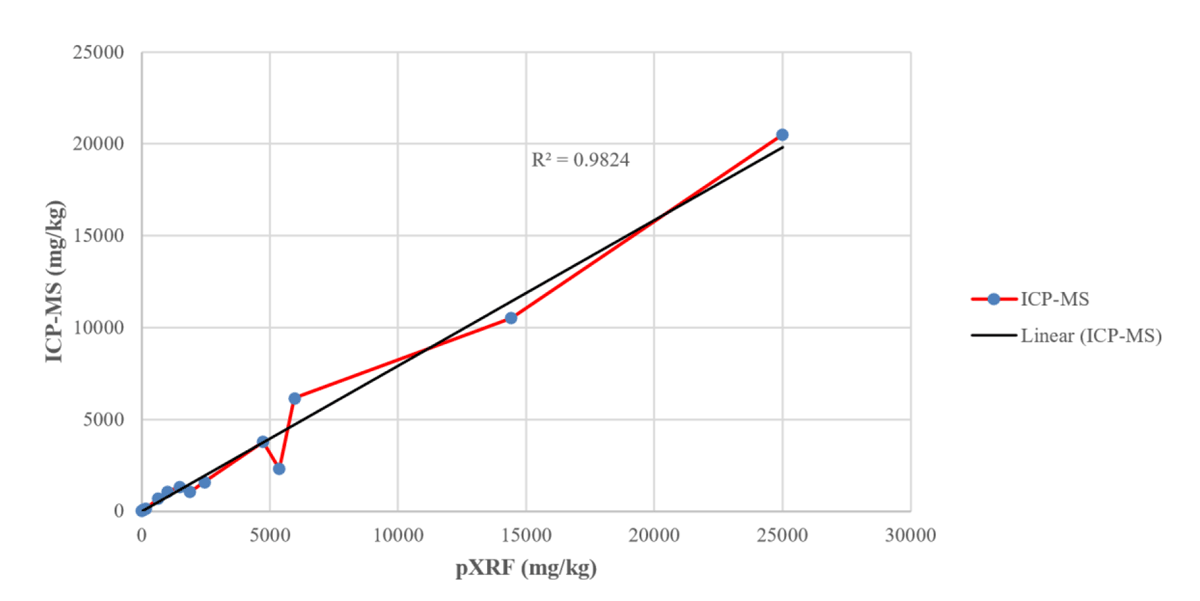
Figure 1
Raw (non adjusted) pXRF and ICP-MS measurements of lead in 15 spices.
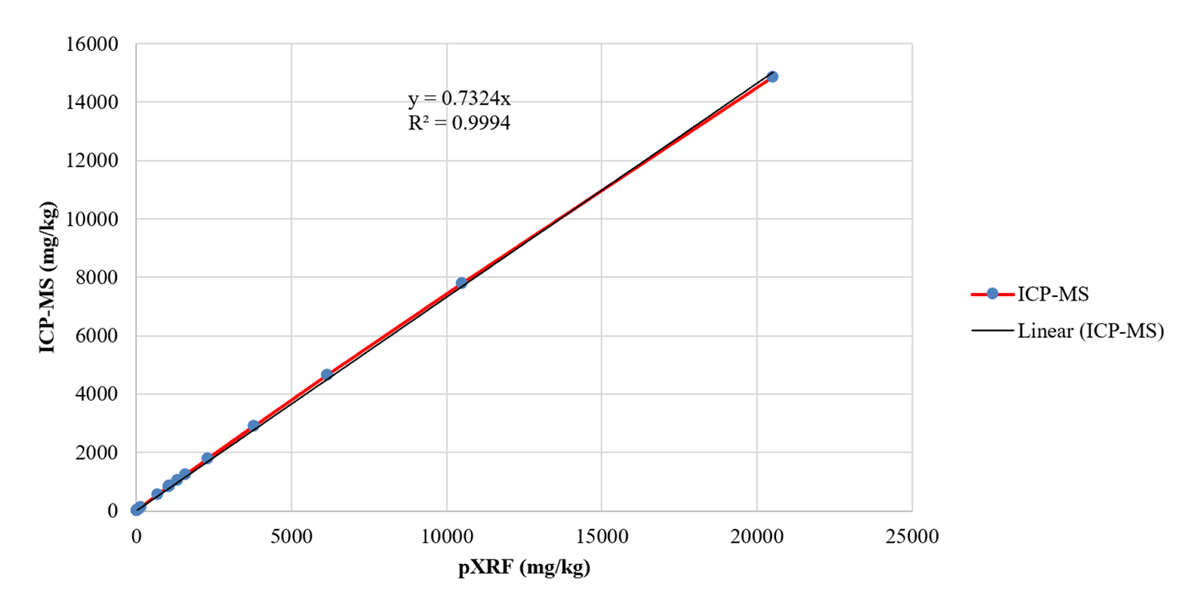
Figure 2
Adjusted pXRF and ICP-MS measurements of lead in 15 spices.