
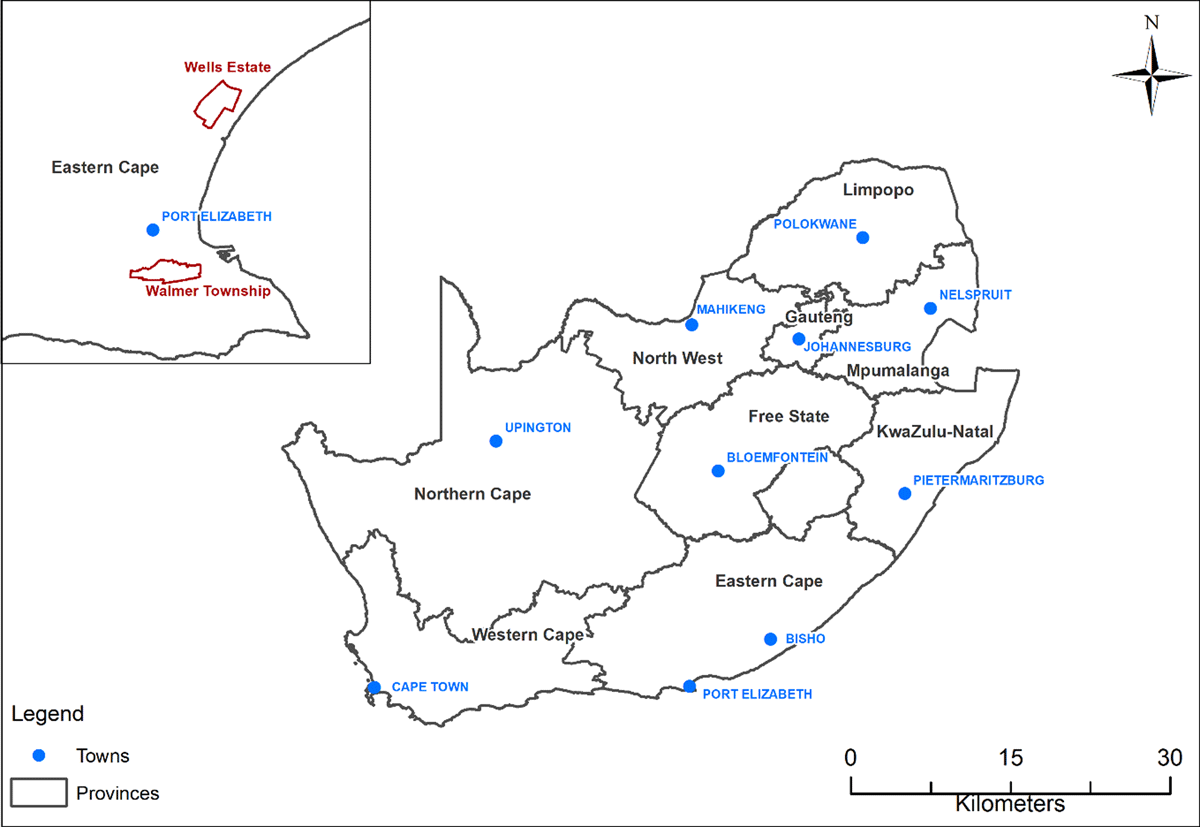
Figure 1
Location of Walmer Township and Wells Estate in the Eastern Cape Province of South Africa (Source: produced by the SAMRC).
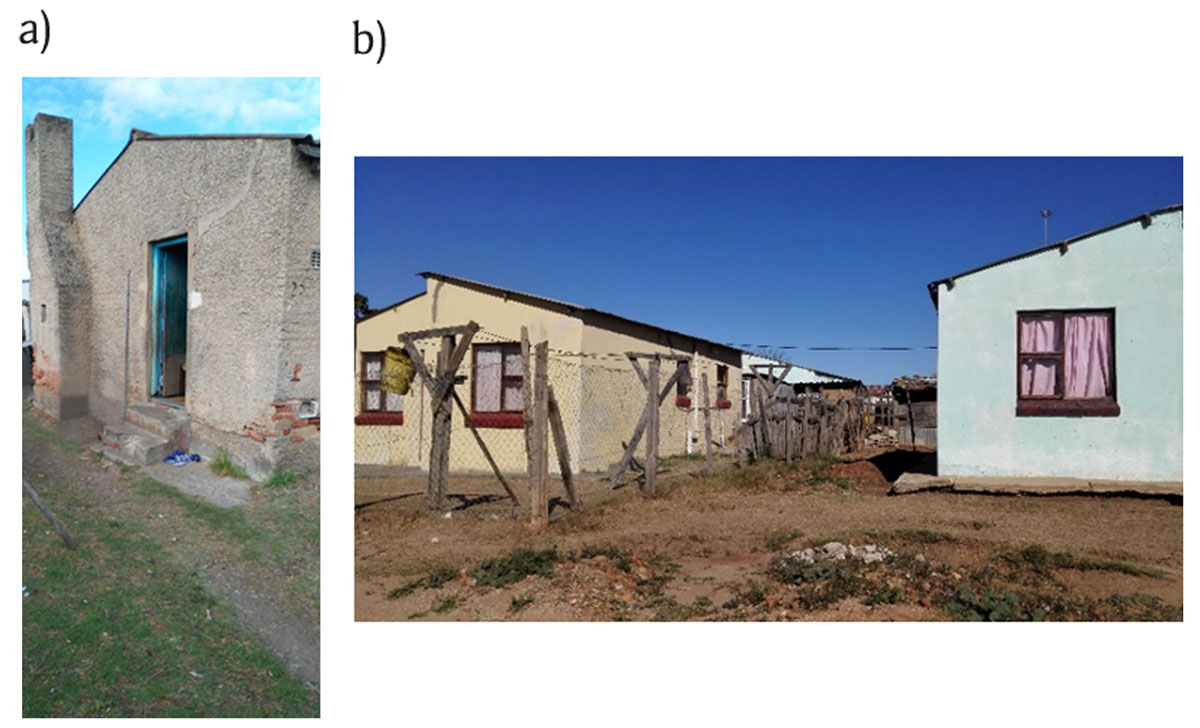
Figure 2
Examples of different dwelling types in (a) Walmer Township and (b) Wells Estate (Source: Captured by JT with permission from participants).
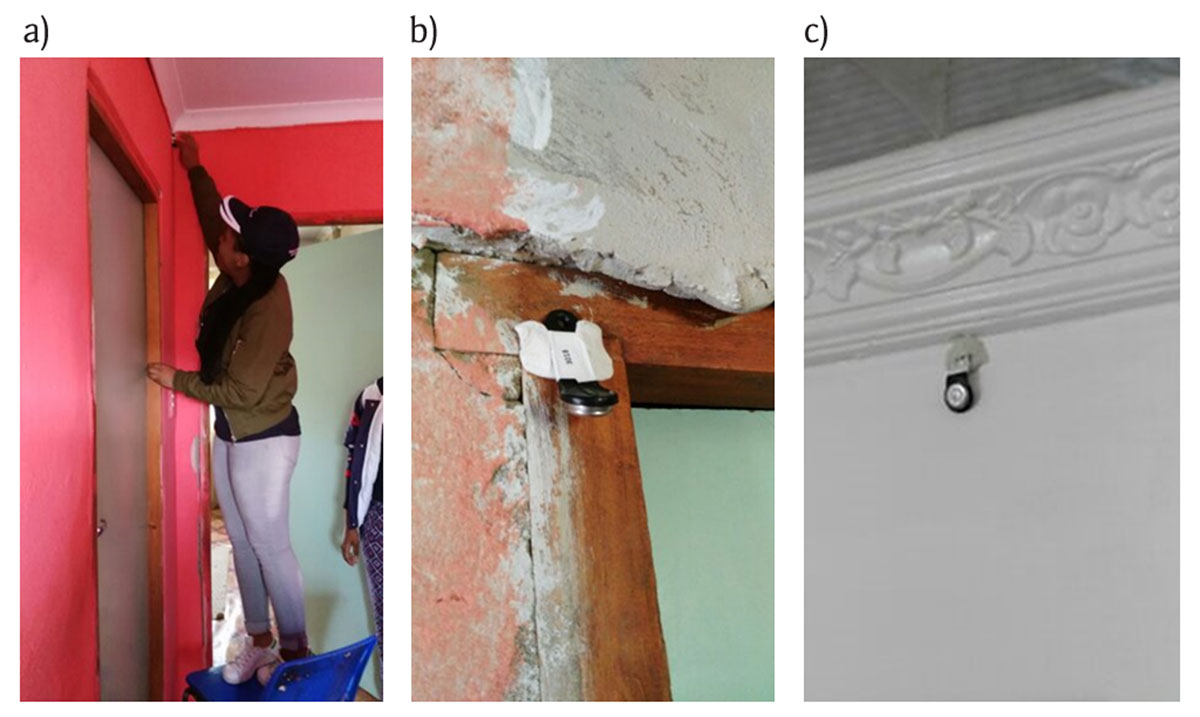
Figure 3
(a) Fieldworker installing an i-Button® temperature and humidity sensor and placement of i-Buttons® in some of the dwellings on (b) door frames and (c) walls (Source: Captured by JT with permission from participants).

Figure 4
Thermochron i-Button® DS1923 temperature and humidity logger (Source: From Manufacturer).
Table 1
Potential health impacts for four heat index threshold ranges.
| Heat index (°C) | Risk level | Effect on Body |
|---|---|---|
| 27–32 | Caution | Fatigue and discomfort possible with prolonged exposure and/or physical activity |
| 32–41 | Extreme caution | Heat stroke, sun stroke, heat cramps, or heat exhaustion possible with prolonged exposure and/or physical activity |
| 41–54 | Danger | Heat cramps or heat exhaustion likely, and heat stroke and sun stroke possible with prolonged exposure and/or physical activity |
| >54 | Extreme danger | Heat stroke, sun stroke highly likely |
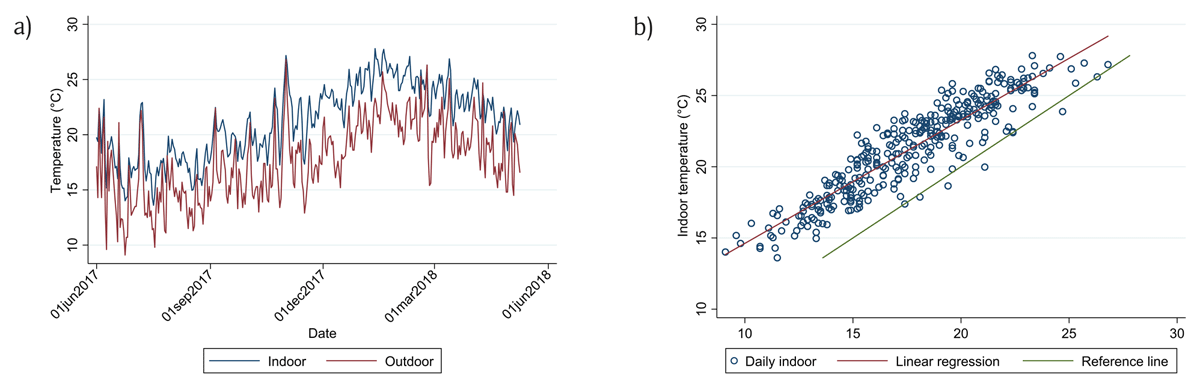
Figure 5
(a) Time series of daily average dwelling indoor temperatures for 27 dwellings compared to SAWS daily average outdoor temperatures. (b) Linear regression for the study period between the average daily indoor temperatures for all dwellings and daily SAWS average outdoor temperature (intercept β0 = 5.96, SE(β0) = 0.38, slope β1 = 0.87, SE(β1) = 0.02, model R2 = 0.84, correlation r = 0.92). The green reference line (slope = 1) indicates when dwelling indoor temperatures were equal to the SAWS daily average outdoor temperatures.
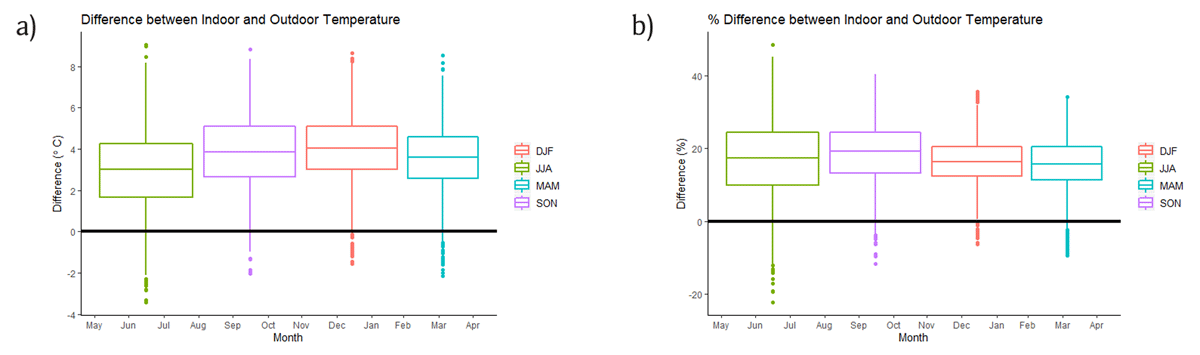
Figure 6
Boxplots of the difference between indoor and outdoor temperatures: Line represents the median, whiskers represent scores outside the middle 50%, box length represents interquartile range. (a) Temperature difference represented in degrees Celsius (b) Temperature difference represented as a percentage of indoor temperature.(Note: Summer DJF: December, January, February = summer; Winter JJA: June, July, August = winter; Autumn MAM: March, April, May = autumn; Spring SON: September, October, November = spring).
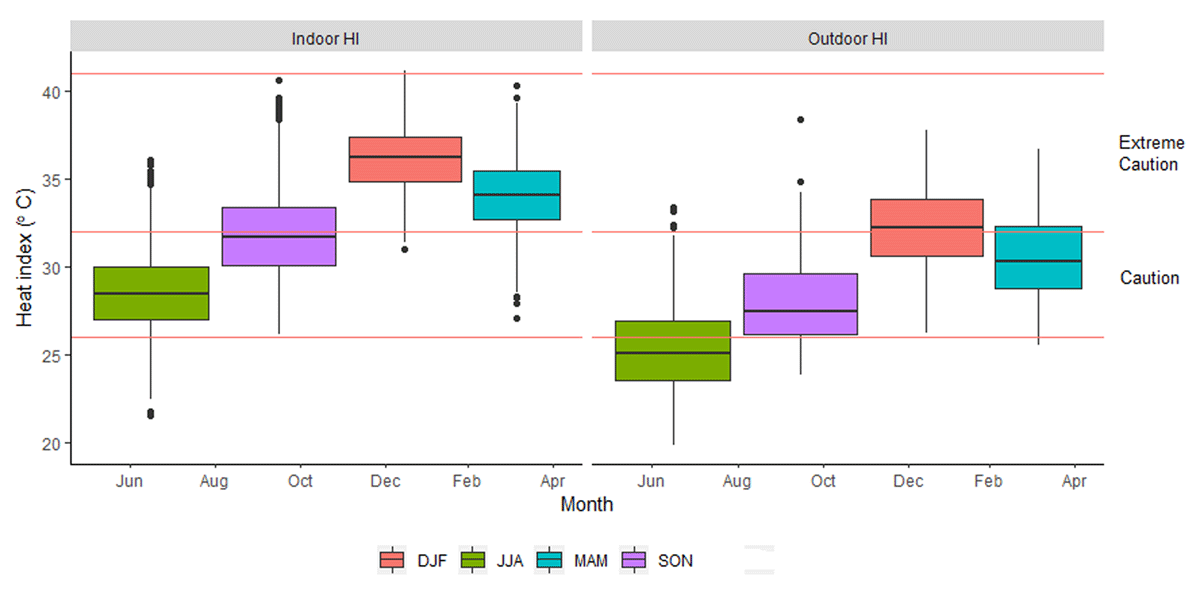
Figure 7
Boxplot of heat index for indoors and outdoors according to the health risk index.
Table 2
Self-reported socio-demographic and dwelling characteristics in the study population for Walmer Township (n = 9) and Wells Estate (n = 13).
| Characteristic | Walmer | Wells | Total | |
|---|---|---|---|---|
| n | n | n | % | |
| Gender of respondent | ||||
| Male | 2 | 3 | 5 | 23 |
| Female | 7 | 10 | 17 | 77 |
| How many people, including you, make up the main household? (mean (SD)) | 4 (2) | 4 (1) | 4 | 2 |
| How many children under five years of age are part of this household? | 2 | 4 | 6 | – |
| How long has this household been living in this dwelling? | ||||
| Months (one year or less) | 0 | 1 | 1 | 5 |
| One year or more | 9 | 12 | 21 | 95 |
| Type of dwelling used by household | ||||
| Formal house built by professional builder | 8 | 12 | 20 | 91 |
| Formal house that was self-built | 1 | 1 | 2 | 9 |
| Approximately how old in years is the dwelling? (median, (IQR)) | 30 (15–60) | 15 (15–16) | 16 (15–30) | – |
| In this dwelling, is there a: | ||||
| Kitchen (for cooking only) | 8 | 13 | 21 | 95 |
| Bathrooms/toilets | 6 | 12 | 18 | 82 |
| Dining rooms | 5 | 10 | 15 | 68 |
| Lounge | 3 | 3 | 6 | 27 |
| Bedrooms | 9 | 13 | 22 | 100 |
| One main room | 0 | 2 | 2 | 9 |
| What do you use mainly for indoor heating? | ||||
| None | 3 | 5 | 8 | 36 |
| Electricity | 5 | 7 | 12 | 55 |
| Paraffin | 1 | 1 | 2 | 9 |
| Gas | 0 | 0 | 0 | – |
| Wood | 0 | 0 | 0 | – |
| Coal | 0 | 0 | 0 | – |
| Imbhawula (burn bottom-up) | 0 | 0 | 0 | – |
| Other | 0 | 0 | 0 | – |
| Are any pets or animals kept inside the house? | ||||
| Yes | 0 | 4 | 4 | 18 |
| No | 9 | 9 | 18 | 82 |
| What do indoor household smokers smoke? | ||||
| Cigarettes | 2 | 4 | 6 | 27 |
| Pipe tobacco | 0 | 0 | 0 | – |
| Hookah/hubby bubbly | 0 | 0 | 0 | – |
| Electronic cigarettes | 0 | 0 | 0 | – |
| Other | 0 | 0 | 0 | – |
Table 3
Dwelling observations of main dwellings as observed by trained fieldworkers in the study population for Walmer Township (n = 9) and Wells Estate (n = 13).
| Dwelling Characteristic | Walmer | Wells | Total | |
|---|---|---|---|---|
| n | n | n | % | |
| Roofing material used | ||||
| Clay tiles | 1 | 0 | 1 | 5 |
| Metal sheeting | 8 | 13 | 21 | 95 |
| Concrete | 0 | 0 | 0 | – |
| Other | 0 | 0 | 0 | – |
| Shape of roof | ||||
| Gable | 8 | 8 | 16 | 73 |
| Flat | 1 | 4 | 5 | 23 |
| Other | 0 | 0 | 0 | – |
| Missing | 0 | 1 | 1 | 4 |
| Ceiling material used | ||||
| No ceiling | 2 | 0 | 2 | 9 |
| Cement | 0 | 0 | 0 | – |
| Wood | 1 | 0 | 1 | 5 |
| Ceiling boards | 6 | 13 | 19 | 86 |
| Other | 0 | 0 | 0 | – |
| Exterior walls | ||||
| Plastered brick | 7 | 11 | 18 | 82 |
| Brick | 2 | 2 | 4 | 18 |
| Wood | 0 | 0 | 0 | – |
| Metal sheeting | 0 | 0 | 0 | – |
| Stone | 0 | 0 | 0 | – |
| Other | 0 | 0 | 0 | – |
| Interior walls | ||||
| Plastered brick | 7 | 11 | 18 | 82 |
| Brick | 2 | 2 | 4 | 18 |
| Wood | 0 | 0 | 0 | – |
| Metal sheeting | 0 | 0 | 0 | – |
| Stone | 0 | 0 | 0 | – |
| Other | 0 | 0 | 0 | – |
| How many windows are there in the dwelling? | ||||
| 1 to 3 | 1 | 1 | 2 | 9 |
| 4 to 6 | 7 | 10 | 17 | 77 |
| >6 | 1 | 0 | 1 | 5 |
| Missing | 0 | 2 | 2 | 9 |
| Do the windows have shade protection inside or outside (e.g. blinds, awnings, etc.)? | ||||
| Yes | 7 | 7 | 14 | 63 |
| No | 2 | 5 | 7 | 32 |
| Some | 0 | 0 | 0 | – |
| Missing | 0 | 1 | 1 | 5 |
| Can the windows be opened? | ||||
| Yes | 9 | 11 | 20 | 90 |
| No | 0 | 1 | 1 | 5 |
| Missing | 0 | 1 | 1 | 5 |
| How would you describe ventilation in this dwelling: | ||||
| No problem | 8 | 9 | 17 | 77 |
| Moderate problem | 1 | 3 | 4 | 18 |
| Major problem | 0 | 1 | 1 | 5 |
| How would you describe mould in this dwelling: | ||||
| No problem | 4 | 4 | 8 | 36 |
| Moderate problem | 2 | 7 | 9 | 41 |
| Major problem | 3 | 2 | 5 | 23 |
| Flooring material used | ||||
| Cement | 1 | 2 | 3 | 14 |
| Linoleum | 3 | 4 | 7 | 32 |
| Wood | 1 | 3 | 4 | 18 |
| Brick | 0 | 0 | 0 | – |
| Tile | 5 | 5 | 10 | 45 |
| Earth | 0 | 0 | 0 | – |
| Other | 0 | 0 | 0 | – |
| Temperature control | ||||
| Yes | 1 | 3 | 4 | 18 |
| No | 8 | 10 | 18 | 82 |
| If yes, please indicate method used | ||||
| Portable fan | 1 | 1 | 2 | 9 |
| Ceiling fan | 0 | 0 | 0 | – |
| Air conditioner | 0 | 0 | 0 | – |
| Other | 0 | 2 | 2 | 9 |
| Are there shade trees close to the dwelling? | ||||
| Yes | 4 | 2 | 6 | 27 |
| No | 5 | 11 | 16 | 73 |
Table 4
Coefficients (95% Confidence Intervals [CIs]) from the mixed-effects regression of indoor apparent temperature and dwelling characteristics. The model was adjusted for clustering by dwelling.
| Dwelling characteristics | Indoor apparent temperature (°C) n = 17 | ||
|---|---|---|---|
| Coefficient | 95% CIs | ||
| Roof type | |||
| Gable# | 0 | ||
| Flat | –0.09 | –0.87–0.69 | |
| Roof material | |||
| Clay tile# | 0 | ||
| Metal sheeting | 0.53 | –1.63–2.70 | |
| Concrete | –1.07 | –4.06–1.91 | |
| Floor | |||
| Cement# | 0 | 0.19–2.72* | |
| Linoleum | 1.45 | 1.18–3.86* | |
| Wood | 2.52 | 0.44–3.63* | |
| Tiles | 2.04 | 0.41–3.18* | |
| Other, e.g. dung | 1.80 | ||
| Exterior | |||
| Plastered brick# | 0 | ||
| Brick | 0.85 | –0.59–2.30 | |
| Shade trees | |||
| No# | 0 | ||
| Yes | 0.20 | –0.48–0.89 | |
| Model constant | 21.53 | 18.46–24.61* | |
[i] Note: * p < 0.05; # indicates the reference variable; CI indicates confidence interval.