
Table 1
Midgut infection percentages of mosquitoes from the three field-caught origins and one laboratory colony and the log-odds of getting a positive midgut compared to the baseline of colony origins (Chetumal colony) at 4, 7, 11 and 14 days post-infection (dpi) according to IFA.
| Percentage of midgut Infection (n) | Log-Odds | |||||||
|---|---|---|---|---|---|---|---|---|
| dpi | 4 | 7 | 11 | 14 | 4 | 7 | 11 | 14 |
| Chetumal | 0.48 (27) | 0.79 (29) | 0.6 (30) | 0.63 (27) | . | . | . | . |
| Riohacha | 0.33 (27) | 0.47 (30) | 0.6 (30) | 0.5 (30) | –0.148 | –0.326* | <0.0001 | –0.13 |
| Bello | 0.56 (25) | 0.48 (33) | 0.53 (28) | 0.48 (27) | 0.079 | –0.308* | –0.0064 | –0.15 |
| Villavicencio | 0.58 (26) | 0.56 (25) | 0.58 (24) | 0.2 (30) | 0.095 | –0.233 | –0.016 | –0.43* |
[i] * statistically significant at 95% confidence.
Table 2
Head infection percentages of mosquitoes from the three field-caught origins and one laboratory colony and the log-odds of getting a positive head compared to the baseline of colony origins (Chetumal colony) at 4, 7, 11 and 14 days post-infection (dpi) according to IFA.
| Percentage of head Infection (n) | Log-Odds | |||||||
|---|---|---|---|---|---|---|---|---|
| dpi | 4 | 7 | 11 | 14 | 4 | 7 | 11 | 14 |
| Chetumal | 0.03 (30) | 0.2 (30) | 0.5 (30) | 0.63 (30) | . | . | . | . |
| Riohacha | 0 (30) | 0.13 (30) | 0.4 (30) | 0.47 (30) | –0.033 | –0.067 | –0.1 | –0.167 |
| Bello | 0 (30) | 0 (30) | 0.07 (30) | 0.17 (30) | –0.033 | –0.2* | –0.43* | –0.467* |
| Villavicencio | 0.03 (30) | 0 (30) | 0.2 (30) | 0.23 (30) | <.0001 | –0.2* | –0.3* | –0.4* |
[i] * statistically significant at 95% confidence.
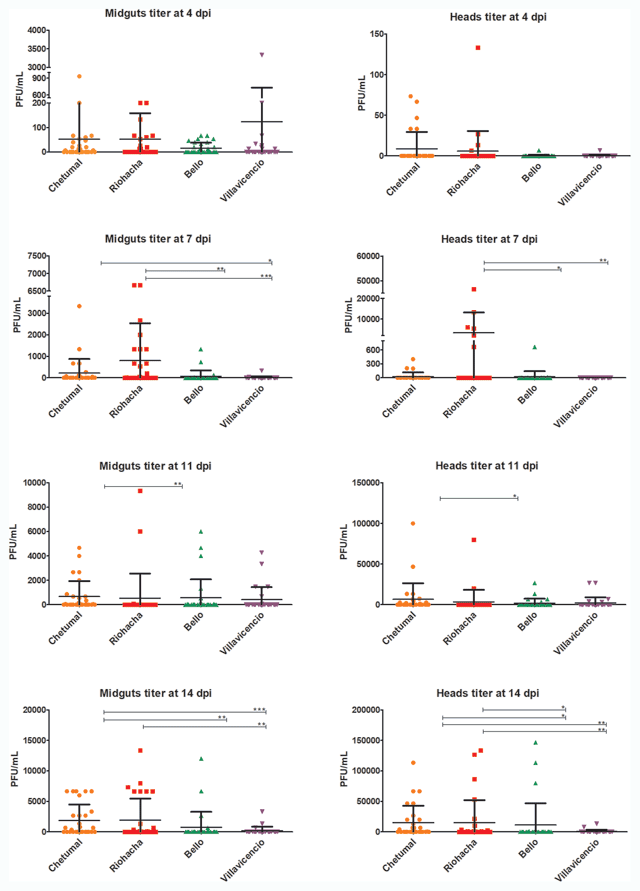
Figure 1
Viral titers at 4, 7, 11 and 14 days post-infection in the midgut and head tissues of mosquitoes from Riohacha, Bello, Villavicencio and the control population of Chetumal. Number of processed mosquitoes per city per dpi equals to 30. Significant differences are represented by *(p < 0.05), **(p < 0.01) and ***(p < 0.001). PFU/mL: Plaque forming units per milliliter.
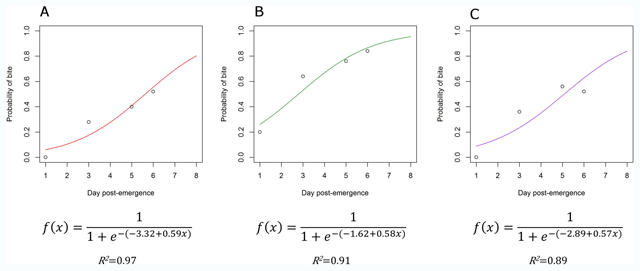
Figure 2
Curves and mathematical functions fitted to bite data from Riohacha (A), Bello (B) and Villavicencio (C). Every dot is the average of five volunteers. Mathematical functions and determination coefficient is shown under respective graph.
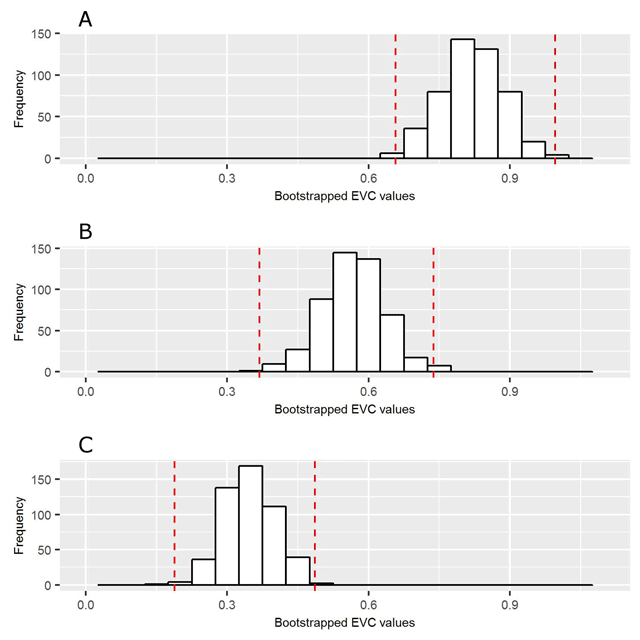
Figure 3
Distribution of bootstrapped EVC values for mosquitoes from Riohacha (A), Bello (B) and Villavicencio (C). Red lines indicate percentiles 2.5 and 97.5.
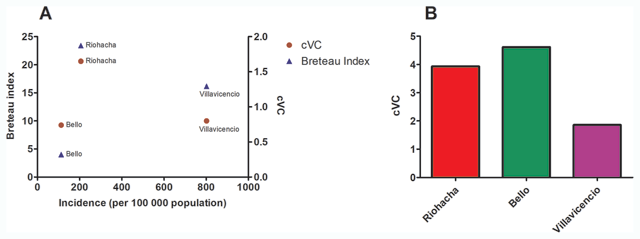
Figure 4
The role of density in cVC estimation. (A) Similarity of pattern produced by Breteau indices of the cities and cVC when density estimated is included related to dengue incidence during time study (mid-2012 to December 2013). (B) cVC estimated with vector density fixed at 1 showing higher values for Bello population.
Table 3
Parameters used to estimate cVC of each of the three cities.
| City | EVC (φ)* | Avg. bites per day (a) | Density (m) | Probability of daily survival (p) |
|---|---|---|---|---|
| Riohacha | 0.82 | 0.59 | 0.42 | 0.9295 |
| Bello | 0.57 | 0.76 | 0.16 | 0.9304 |
| Villavicencio | 0.34 | 0.62 | 0.43 | 0.9306 |
[i] * Head positivity by plaque assay used as a proxy for transmission potential of DENV-2.