
Figure 1
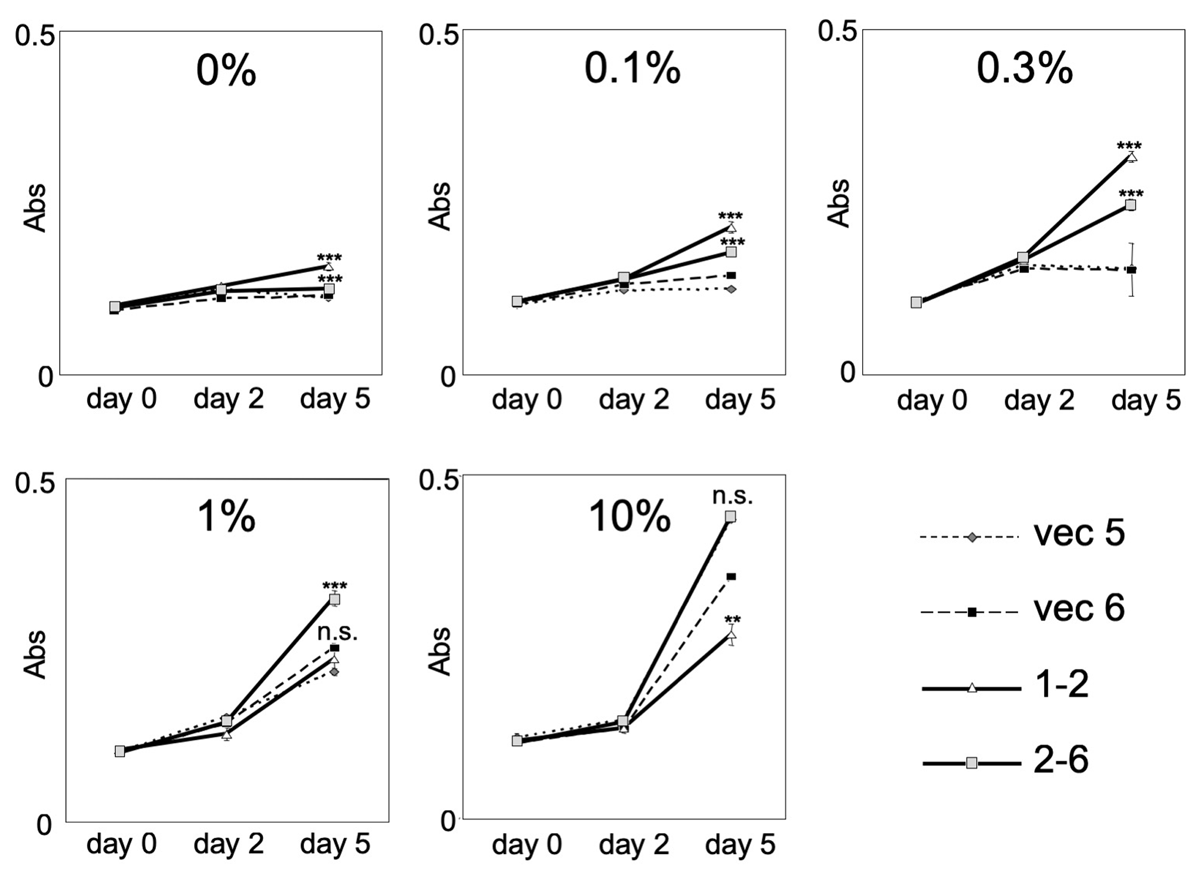
Growth of K562 SIRPα1KD cells and their controls on the various concentrations of serum in the medium. Cell proliferation was quantified by the WST-8 assay. Indicated amounts of serum were added to the medium and the WST-8 assay was performed at the times indicated. 1-2 and 2-6 are K562 SIRPα1KD cells. vec5 and vec 6 are control cells. Data were calculated from the average ± standard deviations from at least three samples and shown are representative of three independent experiments. P-value was calculated from student’s t-test, by comparing controls (vec 5, vec 6) and each (1-2, 2-6) K562 SIRPα1KD cells (** p < 0.01, *** p < 0.001, n.s: not significant).
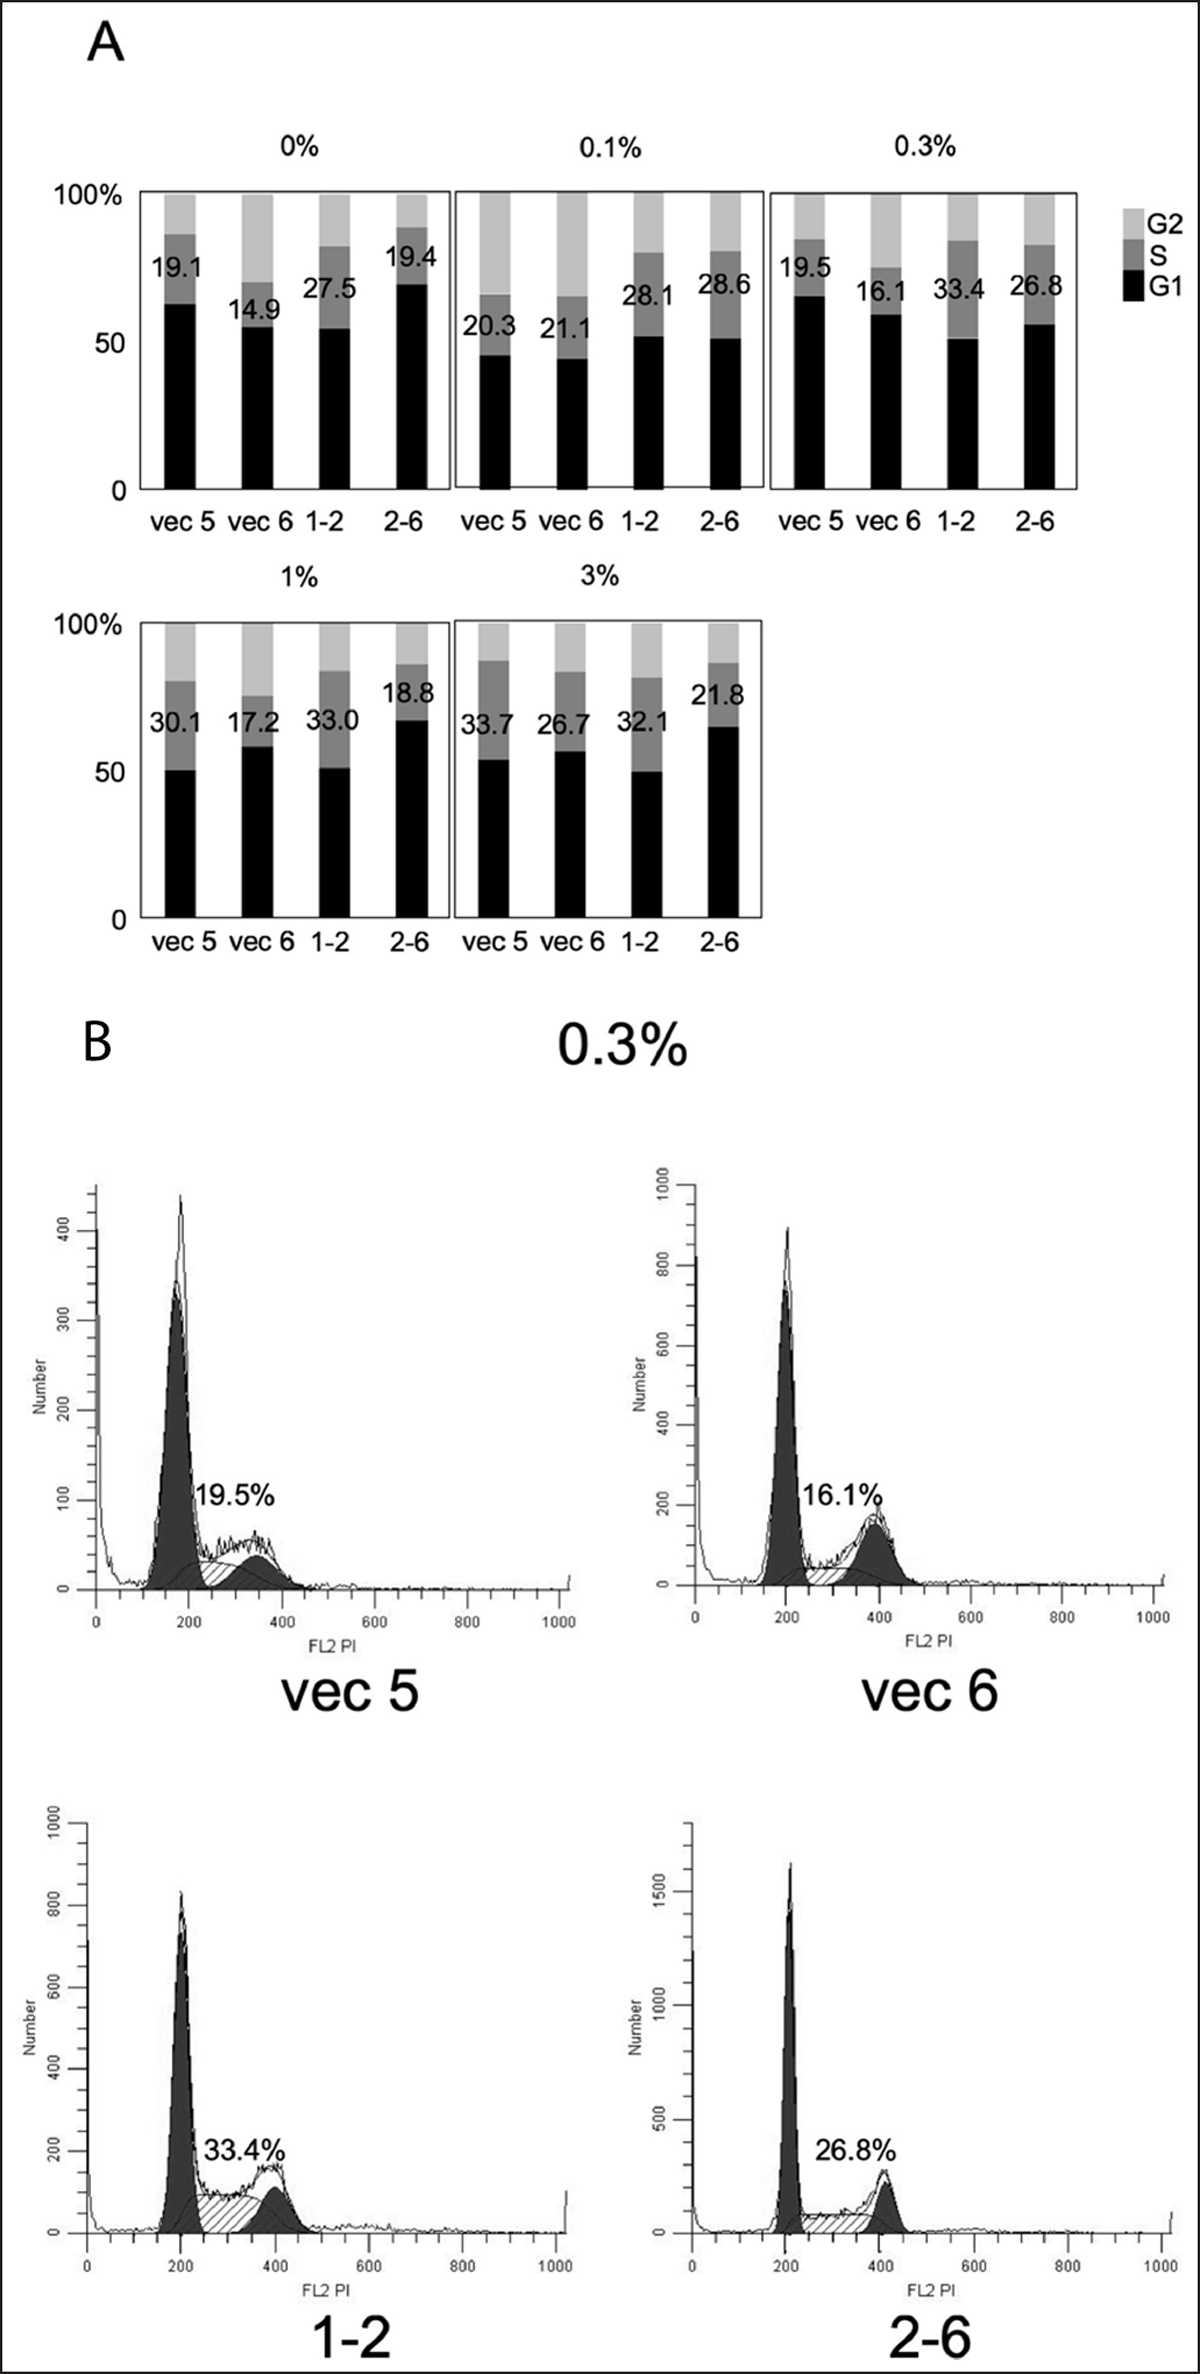
Figure 2
Effects of the change of serum concentration in the culture for 48 hours on the cell cycle for K562 SIRPα1KD cells and their controls. The data shown are representative of three independent experiments, and reproducibility was confirmed. (A) Summary of the percentages of cells in each phase of the cell cycle (G1, S and G2/M) of the data are presented. (B) Flow cytometry images of cell cycle analysis using propidium iodide staining. Depicted are cells incubated with 0.3% serum in culture.
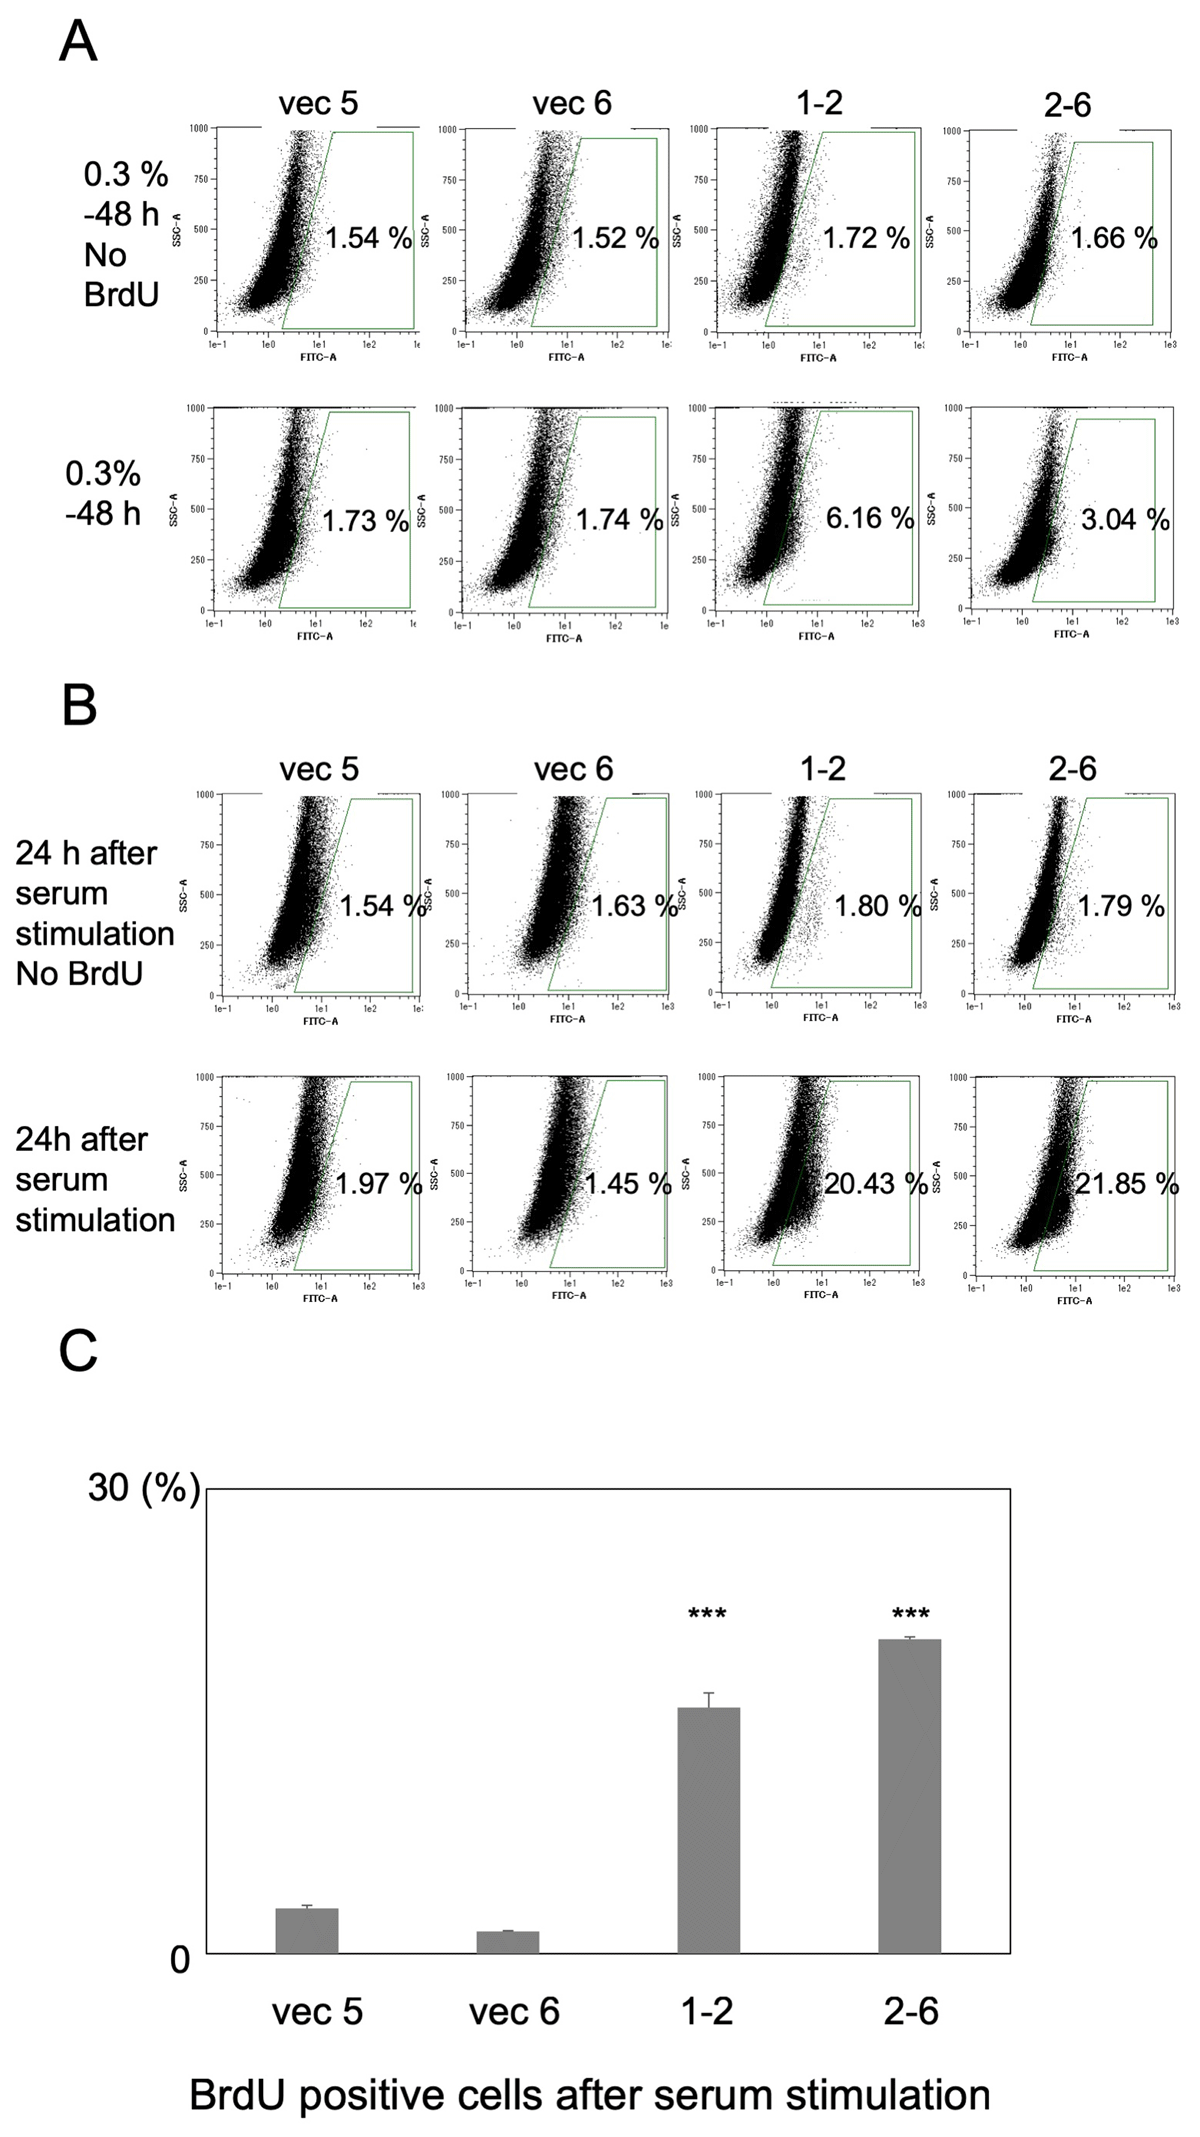
Figure 3
BrdU incorporation measured using flow cytometry. (A) Flow cytometry plots of side scatter (SSC) vs. BrdU fluorescence. Result of BrdU positive cells incubated for 48 hours in 0.3% serum in culture. Upper panel indicates negative control samples without BrdU. They were used to establish levels of background autofluorescence and to define the BrdU positive gate. Numbers denote percent of cells in the indicated area. (B) Flow cytometry plots, similar to Figure 3A. Result of BrdU positive cells after serum stimulation. Shown are representative of three independent experiments and reproducibility was confirmed. (C) Summary of BrdU positive cells after serum stimulation, obtained from three independent experiments. Depicted are average ± standard deviations and P-value was calculated from student’s t-test, by comparing controls and each (1–2, 2–6) K562 SIRPα1KD cells (*** p < 0.001).
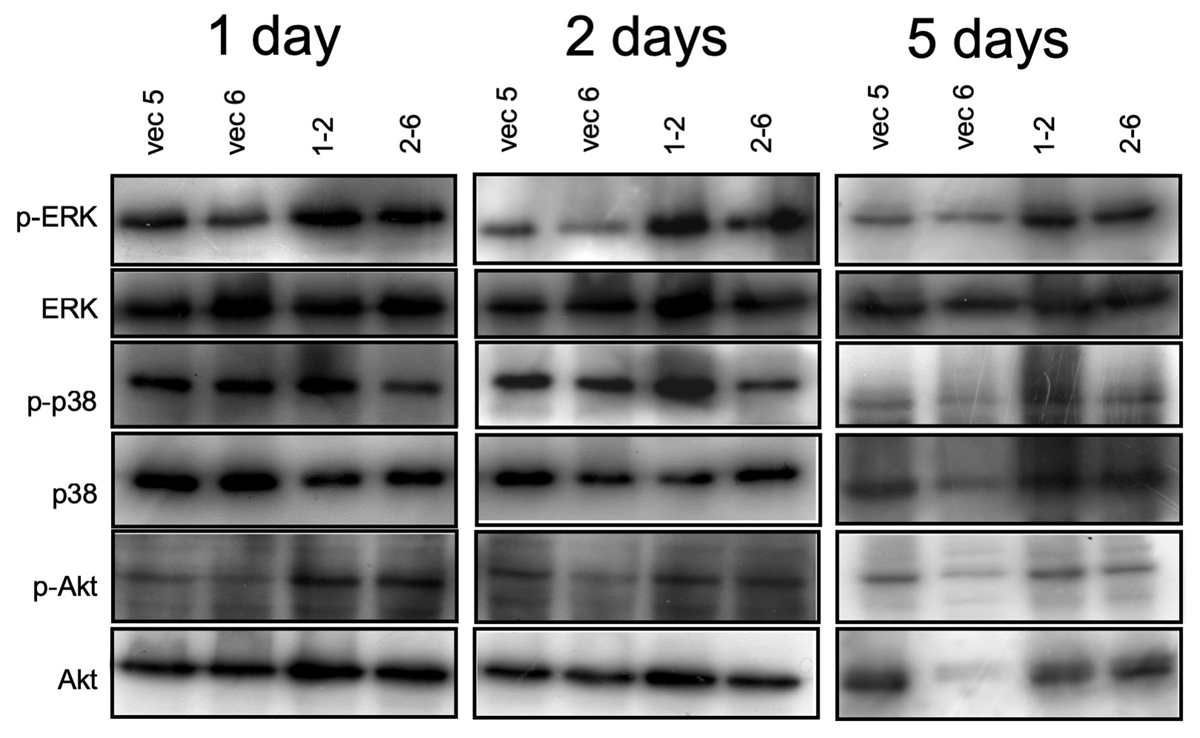
Figure 4
Down-regulation of SIRPα1 results in the constitutive phosphorylation of ERK and Akt in low serum culture. The indicated K562 SIRPa1KD cells were cultured with 0.3% FBS for indiacted period and total cell lysates were harvested. After blotting, the blots were stained with the indicated activation-specific antibodies. These are, anti-phospho-p44/42 MAPK (Thr202/Tyr204), anti-phospho-p38 (T180/Y182), anti-p-Akt (S473) rabbit polyclonal antibodies. Subsequently, the blots were stripped and stained with the indicated antibodies, (i.e., p44/42 MAPK mouse monoclonal antibody, anti-Akt1 rabbit polyclonal antibodies, anti-38 α/SAPK2α mouse monoclonal antibody) recognizing above proteins in their nonactivated state demonstrate equal loading.