
Figure 1
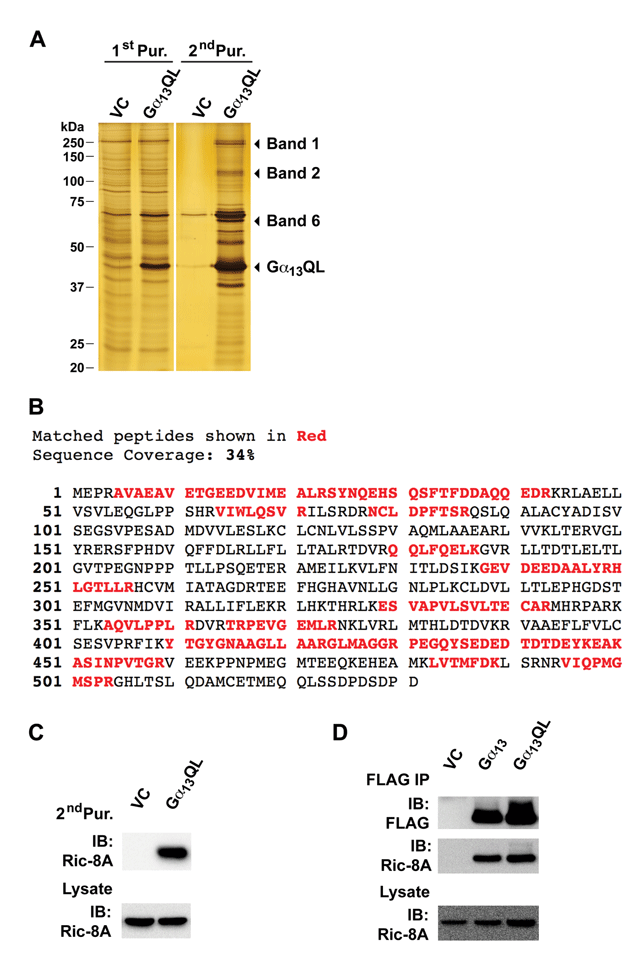
Identification of Ric-8A as Gα13-interacting protein. A. Silver staining profiles of tandem affinity purified proteins from HEK293 cells transfected with FS-tagged Gα13QL construct or vector control (VC). First affinity purification (1st Pur.) was carried out using Strep-Tactin resin in which the proteins bound to the resin were eluted using desthiobiotin, resolved by SDS-PAGE electrophoresis and visualized by silver staining. Second affinity purification (2nd Pur.) was carried out using anti-FLAG M2 resin in which the bound proteins were eluted using FLAG peptide. The eluted proteins were resolved by 10% SDS-PAGE and visualized by silver staining. B. Mass spectrometric analysis of band 6. Matched peptides (in red) cover 34% of human Ric-8A protein. C. Lysates from vector control and Gα13QL-tranfectants were processed through second affinity purification (2nd Pur.). The bound proteins eluted by FLAG-peptides were resolved in by SDS-PAGE and subjected to immunoblot analysis using Ric-8A-antibodies. D. Lysates from HEK293 cells transfected with FS-tagged wild-type Gα13 (Gα13), activated mutant of Gα13 (Gα13QL), or FS-tag-vector control (VC), were immunoprecipitated with FLAG antibody and assessed for the presence of Ric-8A.
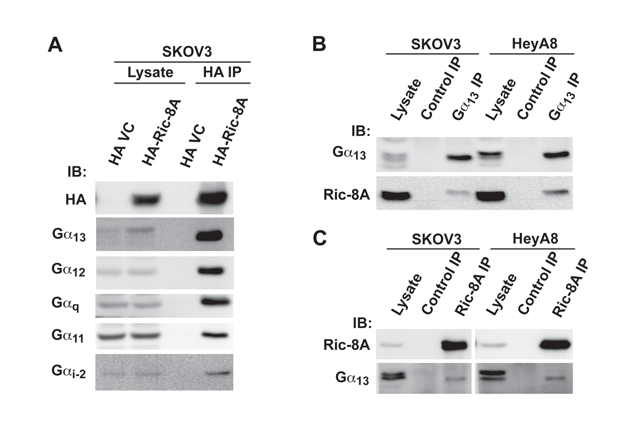
Figure 2
In Vivo interactions of Ric-8A. A. HA-epitope tagged Ric-8A (pcDNA3-HA-Ric-8A) along with the vector control was transiently expressed in SKOV3 cells (2 × 10⁶ cells) for 48 hrs. Ric-8A from the lysates was immunoprecipitated, using antibodies to HA-epitope. Endogenous Gα13, Gα12, Gαq, Gα11 or Gαi2 that interacted with ectopically expressed Ric-8A was monitored by coimmunoprecipitation, followed by immunoblot analysis with the respective antibodies. Data presented is a representation of three independent experiments. B. Lysates from SKOV3 or HeyA8 cells (2 × 10⁶ cells) were incubated with normal mouse IgG (Control IP) or anti- Gα13 antibody. Gα13-bound immunecomplex in the lysates was precipitated by protein-G resin and analyzed for the presence of endogenous Ric-8A by immunoblot analysis (IB). C. Lysates from SKOV3 or HeyA8 cells were incubated with normal mouse IgG (Control IP) or anti-Ric-8A antibody. The bound protein complex was precipitated by protein-G resin and analyzed for the presence of endogenous Gα13 by immunoblot analysis.
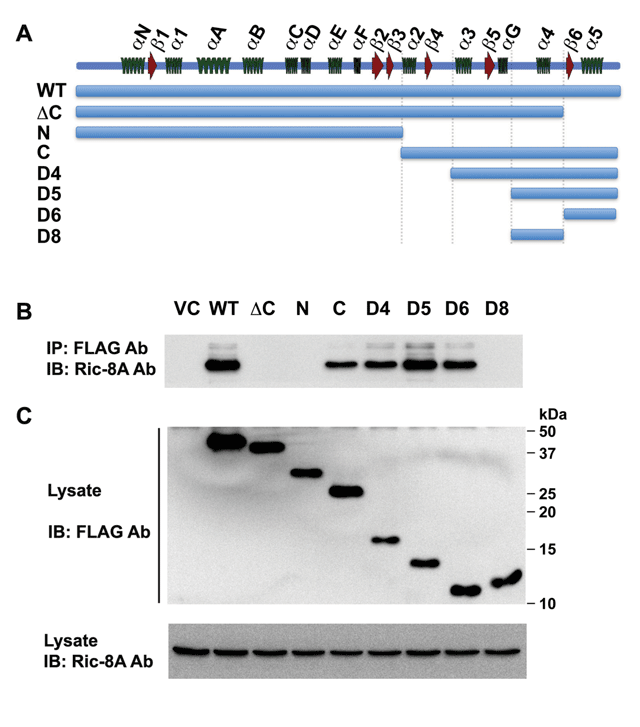
Figure 3
Mapping the Ric-8A-interacting domain of Gα13. A. Diagrammatic representation of the secondary structure of Gα13 and the respective deletion constructs of Gα13. All of the Gα13-constructs are FS-tagged at the N-terminal. B. Presence of Ric-8A was analyzed in the FLAG immunoprecipitation from cells transfected with vector control or the truncated constructs of Gα13. C. Expression levels of the truncated mutants of Flag-tagged Gα13 and Ric-8Awere monitored by immunoblot analysis of the lysates from the transfectants using antibodies to FLAG-epitope (Upper Panel) or Ric-8A (Lower Panel) respectively. The data presented are representative of three independent experiments with similar results.
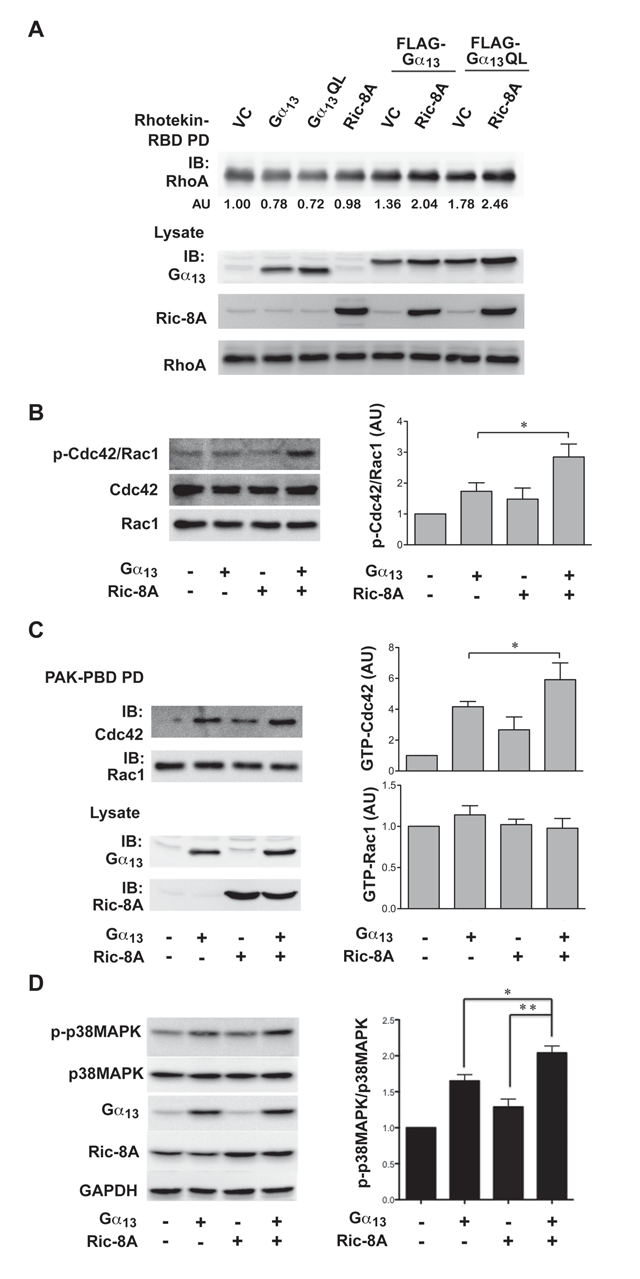
Figure 4
Ric-8A enhances Gα13-signaling Outputs. A. Activation of RhoA was analyzed based on the ability of Rho-binding domain (RBD) of Rhotekin to interact with activated RhoA. Vector control (VC) or constructs encoding Gα13, Ric-8A, Gα13QL, Gα13 + Ric-8A or Gα13QL + Ric-8A were transiently expressed in HEK293 cells for 48 hrs. GTP-bound active form of Rho in the lysates from the transfectants was pulled down using GST-RBD beads (RBD PD) and visualized by immunoblot analysis. The experiment was repeated thrice and the results are from a typical experiment. Activated RhoA levels were quantified and presented as arbitrary units (AU) under the respective activated Rho lanes. B. Activation of CDC42/Rac1 was monitored using antibodies that recognize Ser-71 phosphorylated, activated forms of both Cdc42 and Rac1. Vector control (VC) or constructs encoding Gα13, Ric-8A or Gα13 + Ric-8A were transiently expressed in HEK293 cells for 48 hrs. Lysates from the transfectants were subjected to immunoblot analysis using antibodies against Ser-71 phosphorylated CDC42/Rac1. The blot was stripped and re-probed for the expression levels of Rac1 and CDC42. Band intensity of Ser-71 phosphorylated Cdc42/Rac1 (p-Cdc42/Rac1) was normalized by the band intensity of Rac1 in the lysates. Relative p-Cdc42/Rac1 was calculated by comparing their expression levels in vector control (Right Panel). AU, arbitrary units; mean ± SD, n=3; * p < 0.05. C. Activation of Rac1 and Cdc42 were analyzed based on the ability of PAK interact with activated Rac or Cdc42. GTP-bound active form of Cdc42 or Rac1 was pulled down by GST-PAK3 PBD beads (PBD PD) and analyzed by Western blot. Band intensity of GTP-bound Cdc42 or Rac1 in PBD PD was normalized by the band intensity of Cdc42 or Rac1 in lysate, respectively (Right Panel). Relative levels were calculated by comparing to the level in vector control. (AU, arbitrary units; mean±SD, n=3; * p < 0.05). D. Activation of p38MAPK was monitored using antibodies specific for the phosphorylated activated form of p38MAPK. SKOV3-ip cells (1 × 10⁶) were transiently transfected with either vector control, Ga13, or Ric-8A constructs as indicated. At 48 hrs, the transfectants were lysed and the lysates were subjected to immunoblot analysis for phosphorylated p38MAPK using antibodies specific to phospho-p38MAPK. The blot was stripped and re-probed for the expression levels of p38MAPK and GAPDH to ensure equal loading. The stripped blots were also probed for the expression levels of Gα13 and Ric-8A using respective antibodies. The phosphorylated levels of p38MAPK in relation to total levels of p38MAPK were quantified and presented as bar graph in which the bar represent mean ± SD; n=3 (Right Panel). An unpaired two-tail t-test with Welch’s correction was performed to determine statistical significance, * p < 0.05.
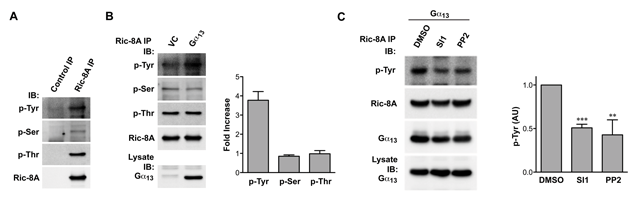
Figure 5
Gα13 induces Src-dependent tyrosine phosphorylation of Ric-8A. A. Lysates of HEK293 cells expressing Ric-8A was incubated with normal mouse IgG (Control IP) or anti-Ric-8A antibody and precipitated by protein-G resin. Immunoprecipitation was analyzed for the presence of tyrosine, serine and threonine phosphorylation (p-Tyr, p-Ser, p-Thr) of Ric-8A by immunoblot (IB). B. HEK293 cells were co-transfected with Ric-8A expressing construct along with vector control (VC) or Gα13 construct. Expression of Gα13 was confirmed in lysate. Immunoprecipitation of Ric-8A was analyzed for p-Tyr, p-Ser and p-Thr. Data are representative of three independent experiments with similar results. Band intensity of p-Tyr, p-Ser and p-Thr was normalized by the band intensity of Ric-8A, and the ratio of phosphorylation in the presence versus absence of Gα13 was calculated as fold increase (mean ± SD; n = 3). C. HEK293 cells transfected with Ric-8A and Gα13 were treated with vehicle control (DMSO) or 10 ΟM Src kinase inhibitor (SI1 or PP2) overnight. Ric-8A was immunoprecipitated and analyzed for p-Tyr. Immunoprecipitated Ric-8A was also analyzed for the presence of co-immunoprecipitated Gα13. In addition, Gα13 that was present in the lysates was also monitored. Results are representative of three independent experiments with similar results. Quantification of these results is presented in the Right Panel. Band intensity of p-Tyr was normalized by the band intensity of Ric-8A (AU, arbitrary units), and relative p-Tyr was calculated by comparing to the p-Tyr level in vehicle control. Mean ± SD, n=3; ** p < 0.01; *** p < 0.001.
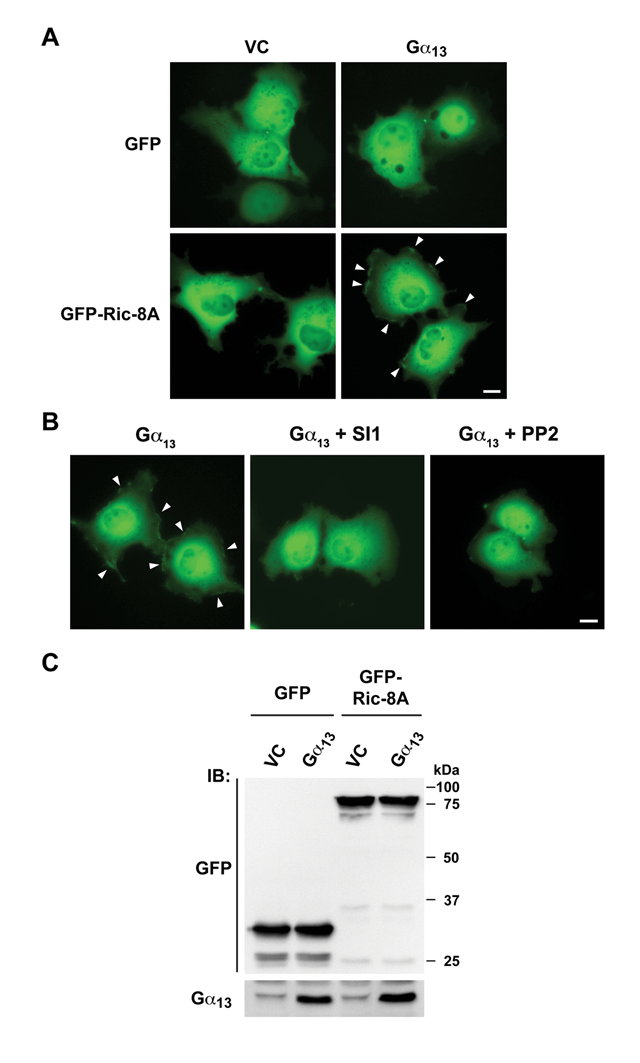
Figure 6
Gα13 induces Src-dependent plasma membrane translocation of Ric-8A. A. GFP or GFP-Ric-8A fusion construct was coexpressed with vectors expressing Gα13 along with appropriate control vectors (1 mg) in COS-7 cells (1.5 × 10⁶ cells/dish). At 48 hrs, the transfectants were lysed and the lysates were subjected to immunoblot (IB) analysis using the respective antibodies to monitor the expressions of GFP, GFP-Ric-8A and Gα13 proteins. B. Cells transiently expressing GFP or GFP-Ric-8A fusion protein along with vectors expressing Gα13 or vector control for 48 hrs were imaged by fluorescence microscopy. Localization of GFP-Ric-8A on plasma membrane (arrowheads) was observed in the presence of Gα13. Scale bar, 10 mm. C. COS7 cells transfected with GFP-Ric-8A and Gα13 for 48 hrs were treated 10mM Src kinase inhibitor SI1 or PP2 for 16 hrs and the fluorescence of GFP was imaged. Plasma membrane localization (arrowheads) was attenuated in the presence of SI1 or PP2. Scale bar, 10 mm. Data are representative of three independent experiments with similar results.
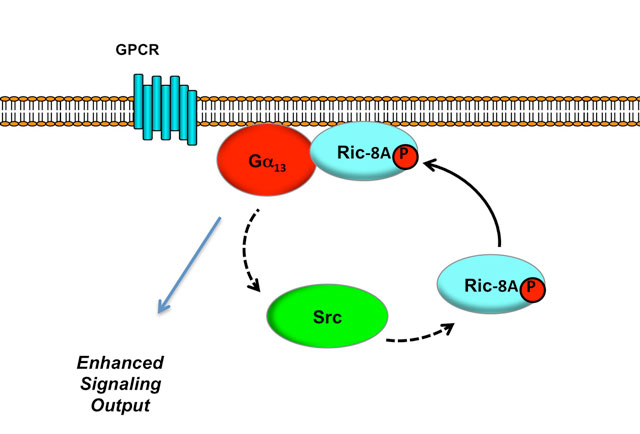
Figure 7
Signaling Paradigm involving Gα13-Ric-8A Interaction. Gα13 interacts with Ric-8A and stimulates the tyrosine phosphorylation of Ric-8A at Tyr-435 through a mechanism involving Src-family of tyrosine kinases. Gα13-mediated tyrosine phosphorylation plays an essential role in Gα13-mediated translocation of Ric-8A to plasma membrane events so as to promote the translocation. Ric-8A, in turn, enhances Gα13 signaling output such as the activation of RhoA, Cdc42, and downstream p38MAPK (see text for details).