
Figure 1
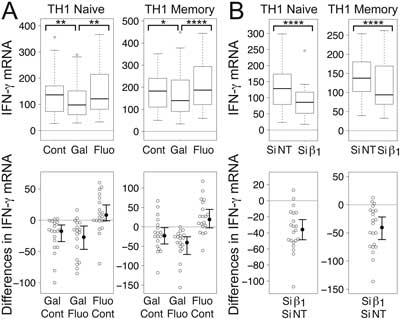
Gβγ inhibition decreases IFN-γ mRNA levels in TCR-stimulated CD4+ TH1 cells. (A) Gallein, but not fluorescein, significantly decreased IFN-γ mRNA levels. Box plots (top) and difference plots (bottom) show data from naïve (left) and memory (right) CD4+ T cells isolated from the peripheral blood of 20 healthy donors, stimulated with plate-bound anti-CD3 and soluble anti-CD28, and grown in conditions promoting TH1 differentiation in the absence or presence of gallein or fluorescein for three days. In the box plots (top), the height of the box plots equals the interquartile range (IQR) and the horizontal line within the box indicates the median value. The whiskers extend to the lowest and highest data points within 1.5 X IQR and the open circles indicate the outliers. In the difference plots (bottom), open circles show pairwise differences in IFN-γ mRNA for each sample when treated with the top versus bottom condition listed on the X axis. To the right of the open circles are the median values (closed circles) and 95% confidence intervals. (B) Gβ1 siRNA significantly decreased IFN-γ mRNA levels. Box plots (top) and difference plots (bottom) show data from naïve (left) and memory (right) CD4+ T cells isolated from the blood of 30 healthy donors and stimulated for three days with plate-bound anti-CD3 and soluble anti-CD28 in conditions promoting TH1 differentiation in the presence of Gβ1 siRNA or NT siRNA. IFN-γ mRNA levels were determined by qPCR. *, p < 0.05; **, p < 0.01; ****, p < 0.0001.
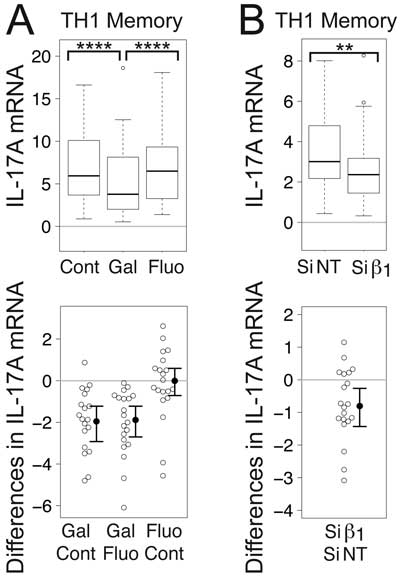
Figure 2
Gβγ inhibition decreases IL-17A mRNA levels in TCR-stimulated CD4+ TH1 memory cells. (A) Gallein, but not fluorescein, significantly decreased IL-17A mRNA levels. Box plots (top) and difference plots (bottom) show data from CD4+ memory T cells isolated from the peripheral blood of 20 healthy donors, stimulated with plate-bound anti-CD3 and soluble anti-CD28, and grown in conditions promoting TH1 differentiation in the absence or presence of gallein or fluorescein for three days. (B) Gβ1 siRNA significantly decreased IL-17A mRNA levels. Box plots (top) and difference plots (bottom) show data from memory CD4+ T cells isolated from the blood of 30 healthy donors and stimulated for three days with plate-bound anti-CD3 and soluble anti-CD28 in conditions promoting TH1 differentiation in the presence of Gβ1 siRNA or NT siRNA. IL-17A mRNA levels were determined by qPCR. **, p < 0.01; ****, p < 0.0001.
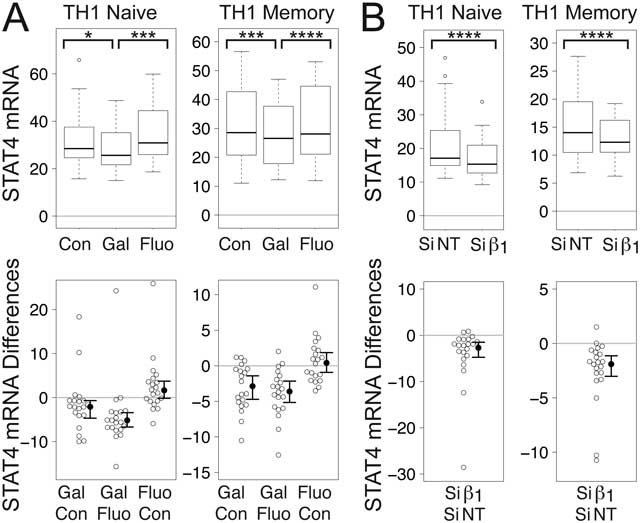
Figure 3
Gβγ inhibition decreases STAT4 mRNA in TCR-stimulated CD4+ TH1 cells. (A) Gallein, but not fluorescein, significantly decreased STAT4 mRNA levels. Box plots (top) and difference plots (bottom) show data from naïve (left) and memory (right) CD4+ T cells isolated from the peripheral blood of 20 healthy donors, stimulated with plate-bound anti-CD3 and soluble anti-CD28, and grown in conditions promoting TH1 differentiation in the absence or presence of gallein or fluorescein for three days. (B) Gβ1 siRNA significantly decreased STAT4 mRNA levels. Box plots (top) and difference plots (bottom) show data from primary human naïve (left) and memory (right) CD4+ T cells isolated from the blood of 30 healthy donors and stimulated for three days with plate-bound anti-CD3 and soluble anti-CD28 in conditions promoting TH1 differentiation in the presence of Gβ1 siRNA or NT siRNA. STAT4 mRNA levels were determined by qPCR. *, p < 0.05; ***, p < 0.001; ****, p < 0.0001.
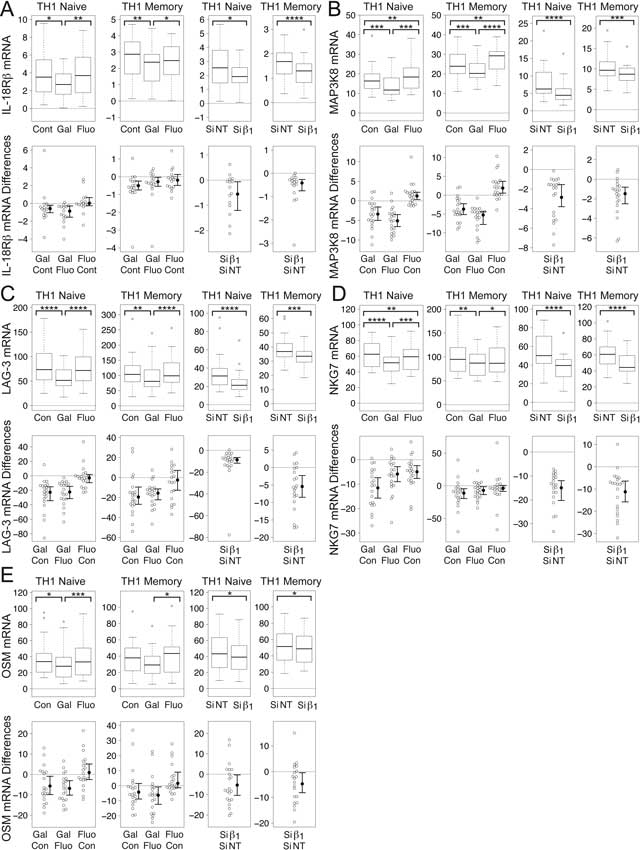
Figure 4
Gβγ inhibition decreases levels of mRNA encoding STAT4-regulated genes in TCR-stimulated CD4+ TH1 cells. Gallein, but not fluorescein, and Gβ1 siRNA significantly decreased mRNA levels of IL-18Rβ (A), MAP3K8 (B), and LAG-3 (C) in TCR-stimulated naïve and memory TH1 cells. (D) Gallein, but not fluorescein, significantly decreased NKG7 mRNA levels in TCR-stimulated memory TH1 cells. Gallein significantly decreased NKG7 mRNA levels in naïve cells, but fluorescein also caused a significant, but smaller decrease. Gβ1 siRNA significantly decreased NKG7 mRNA levels in both naïve and memory cells. (E) Gallein, but not fluorescein, significantly decreased OSM mRNA levels in TCR-stimulated naïve TH1 cells. Gallein decreased OSM mRNA levels significantly in memory cells relative to fluorescein-treated cells, but not to control cells. Gβ1 siRNA significantly decreased OSM mRNA levels in both naïve and memory cells. (A-E) First two sets of graphs: box plots (top) and difference plots (bottom) show data from naïve (left) and memory (right) CD4+ T cells isolated from the peripheral blood of 20 healthy donors, stimulated with plate-bound anti-CD3 and soluble anti-CD28, and grown in conditions promoting TH1 differentiation in the absence or presence of gallein or fluorescein for three days. Second two sets of graphs: box plots (top) and difference plots (bottom) show data from primary human naïve (left) and memory (right) CD4+ T cells isolated from the blood of 30 healthy donors and stimulated for three days with plate-bound anti-CD3 and soluble anti-CD28 in conditions promoting TH1 differentiation in the presence of Gβ1 siRNA or NT siRNA. mRNA levels were determined by qPCR. *, p < 0.05; **, p < 0.01; ***, p < 0.001; ****, p < 0.0001.
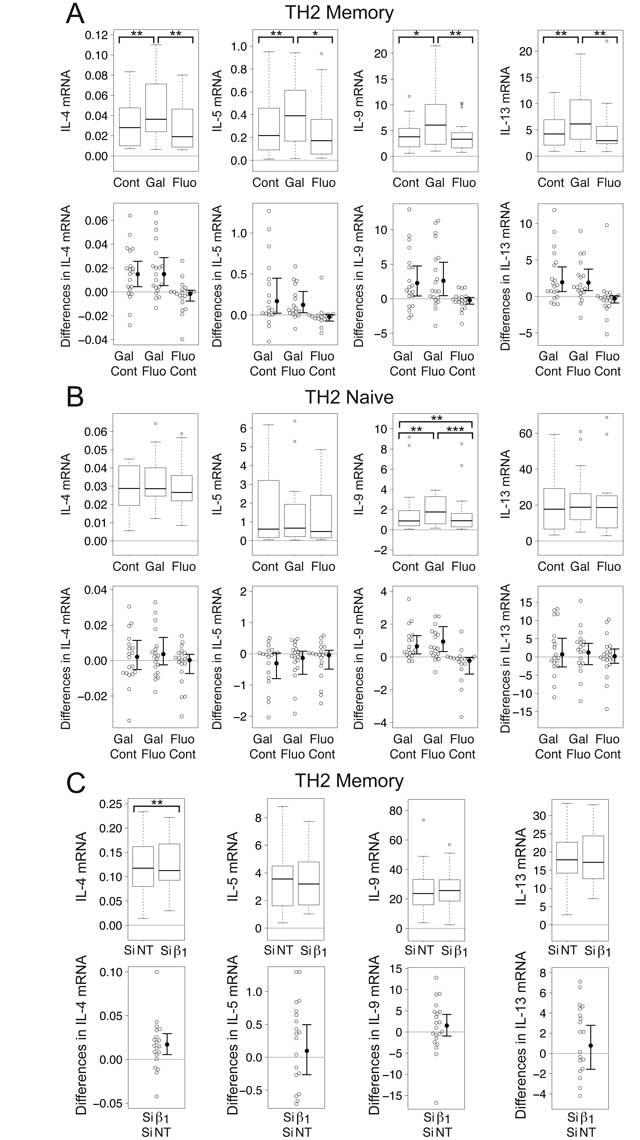
Figure 5
Gβγ inhibition increases levels of mRNA encoding TH2 cytokines in TCR-stimulated CD4+ TH2 memory cells. (A) Gallein, but not fluorescein, significantly increased levels of IL-4, IL-5, IL-9, and IL-13 mRNA in TCR-stimulated TH2 memory cells. (B) Gallein, but not fluorescein, significantly increased IL-9, but not IL-4, IL-5, or IL-13 mRNA levels in TCR-stimulated TH2 naive cells. (C) Gβ1 siRNA significantly increased IL-4, but not IL-5, IL-9, or IL-13 mRNA levels in TCR-stimulated TH2 memory cells. (A-B) Box plots (top) and difference plots (bottom) show data from memory (A) and naive (B) CD4+ T cells isolated from the peripheral blood of 20 healthy donors, stimulated with plate-bound anti-CD3 and soluble anti-CD28, and grown in conditions promoting TH2 differentiation in the absence or presence of gallein or fluorescein for three days. (C) Box plots (top) and difference plots (bottom) show data from memory CD4+ T cells isolated from the blood of 30 healthy donors and stimulated for three days with plate-bound anti-CD3 and soluble anti-CD28 in conditions promoting TH2 differentiation in the presence of Gβ1 siRNA or NT siRNA. mRNA levels were determined by qPCR. *, p < 0.05; **, p < 0.01; ***, p < 0.001.
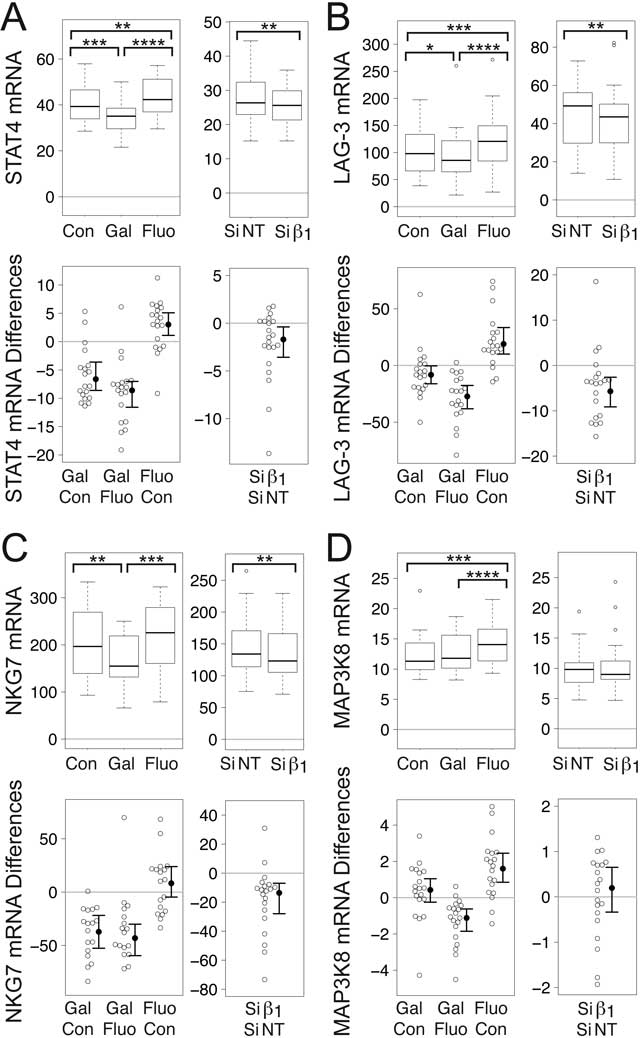
Figure 6
Gβγ inhibition decreases mRNAs encoding STAT4 and some STAT4-regulated genes in CD4+ TH2 memory cells. (A) Gallein, but not fluorescein, and Gβ1 siRNA significantly decreased levels of mRNA encoding STAT4 (A), LAG-3 (B), and NKG-7 (C). (D) Gallein decreased MAP3K8 mRNA levels significantly relative to fluorescein-treated cells, but not to control cells. Gβ1 siRNA did not decrease MAP3K8 mRNA levels. (A-D) First set of graphs: box plots (top) and difference plots (bottom) show data from memory CD4+ T cells isolated from the peripheral blood of 20 healthy donors, stimulated with plate-bound anti-CD3 and soluble anti-CD28, and grown in conditions promoting TH2 differentiation in the absence or presence of gallein or fluorescein for three days. Second set of graphs: box plots (top) and difference plots (bottom) show data from memory CD4+ T cells isolated from the blood of 30 healthy donors and stimulated for three days with plate-bound anti-CD3 and soluble anti-CD28 in conditions promoting TH2 differentiation in the presence of Gβ1 siRNA or NT siRNA. mRNA levels were determined by qPCR. *, p < 0.05; **, p < 0.01; ***, p < 0.001; ****, p < 0.0001.
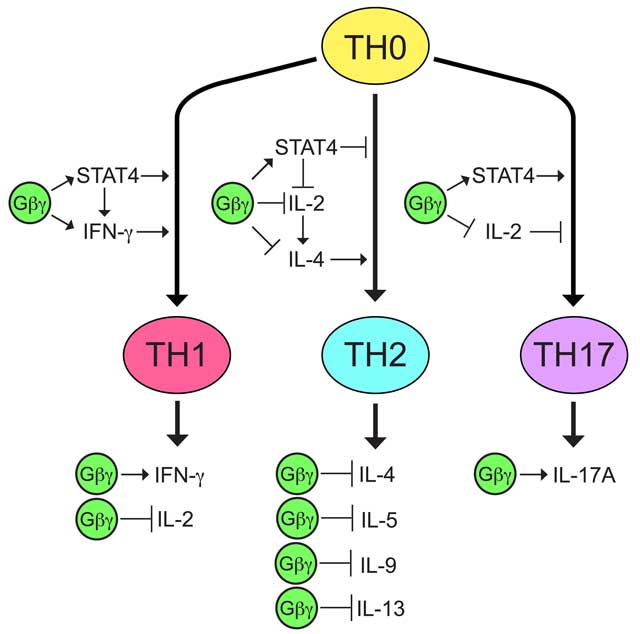
Figure 7
Model of how Gβγ may contribute to proinflammatory cytokine production by CD4+ T helper cells. There are multiple transcription factors and cytokines that influence the differentiation of CD4+ T helper cells, as well as cytokines that are produced by differentiated effector cells, but for simplicity, only STAT4 and the cytokines regulated by Gβγ are shown. Effects of Gβγ on IFN-γ, IL-4, IL-5, IL-9, IL-13, IL-17A, and STAT4 are based on the results of Gβγ inhibition on mRNA levels in the current study. The effect of Gβγ on IL-2 is based on previously reported results of Gβγ inhibition [1]. Previous reports described the roles of IFN-γ in TH1 differentiation [44], IL-2 in TH2 differentiation [31, 102] and TH17 differentiation [12, 13], IL-4 in TH2 differentiation [88, 89], and STAT4 in the differentiation of TH1 [100], TH2 [97], and TH17 T helper cell subtypes [69, 70].