
Table 1
Summary of the TASQ, Toronto Aortic Stenosis Quality of Life Questionnaire
| Domain | Questions | Maximum points |
|---|---|---|
| Physical symptoms | 1, 14 | 14 |
| Physical limitations | 3, 6, 7, 15 | 28 |
| Emotional impact and expectations | 16 | 7 |
| Emotional impact | 2,8, 9, 10, 11, 12, 13 | 49 |
| Social limitations | 4,5 | 14 |
| Total score=112 |
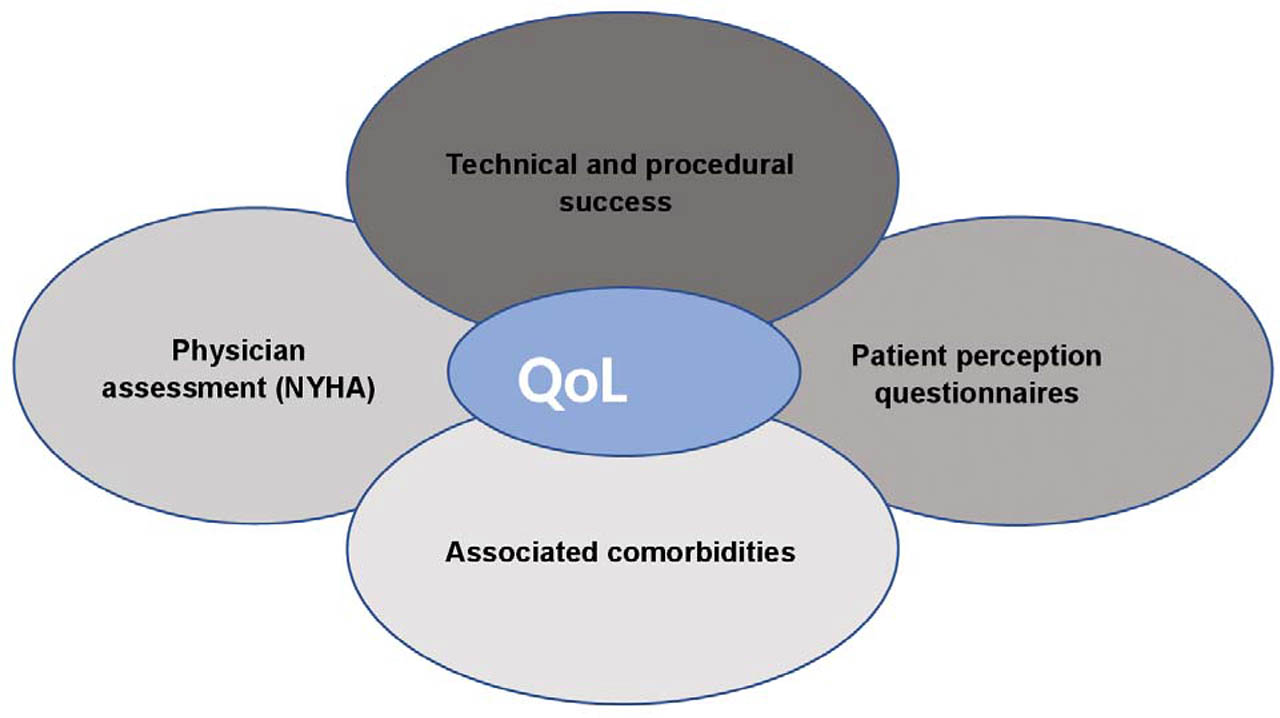
Figure 1
Interdependence of main determinants that influence quality of life.
Figure 2
Table 2
Predictors of deterioration of quality of life 1 year after TAVI (from Goudzwaard et al., 2020)
| Variable | OR | 95%CI | P-value |
|---|---|---|---|
| Age | 1.01 | 0.96–1.07 | 0.647 |
| Gender | 1.13 | 0.56–2.27 | 0.737 |
| Eq5D-5L index on baseline | 10.62 | 2.32–48.52 | 0.002 |
| Current smoker | 3.21 | 1.06–9.77 | 0.040 |
| Peripheral artery disease | 1.40 | 0.73–2.66 | 0.312 |
| Renal dysfunction | 2.12 | 1.11–4.04 | 0.023 |
| Limitation of mobility (5mGST) | 2.29 | 1.35–6.17 | 0.006 |
| Frailty (EFS) | 2.25 | 1.07–4.70 | 0.003 |
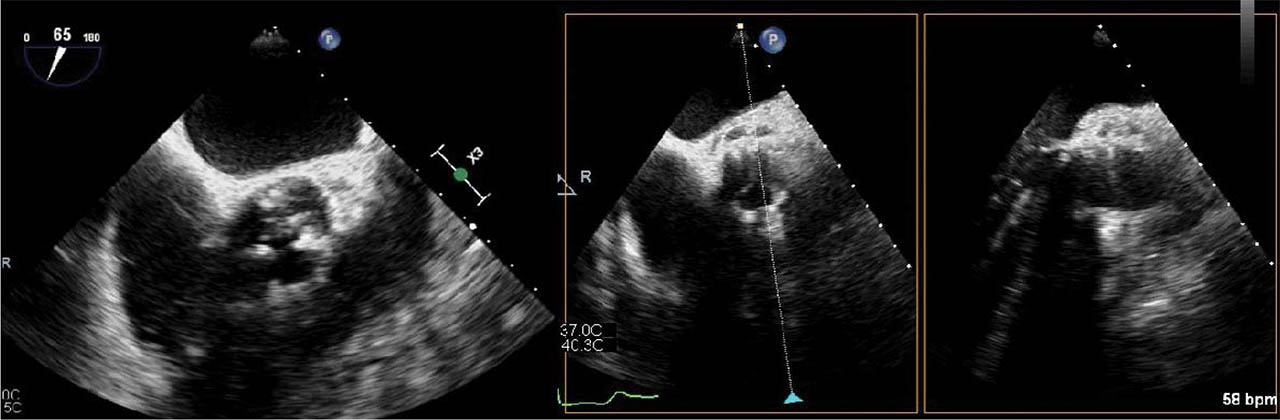
Figure 3
Intraprocedural transesophageal echocardiography. Short axis view of calcified aortic valve with severe aortic stenosis; short and long axis view by X-plane after de implantation of a biological valve (Edwards Sapien 3, no. 26).