
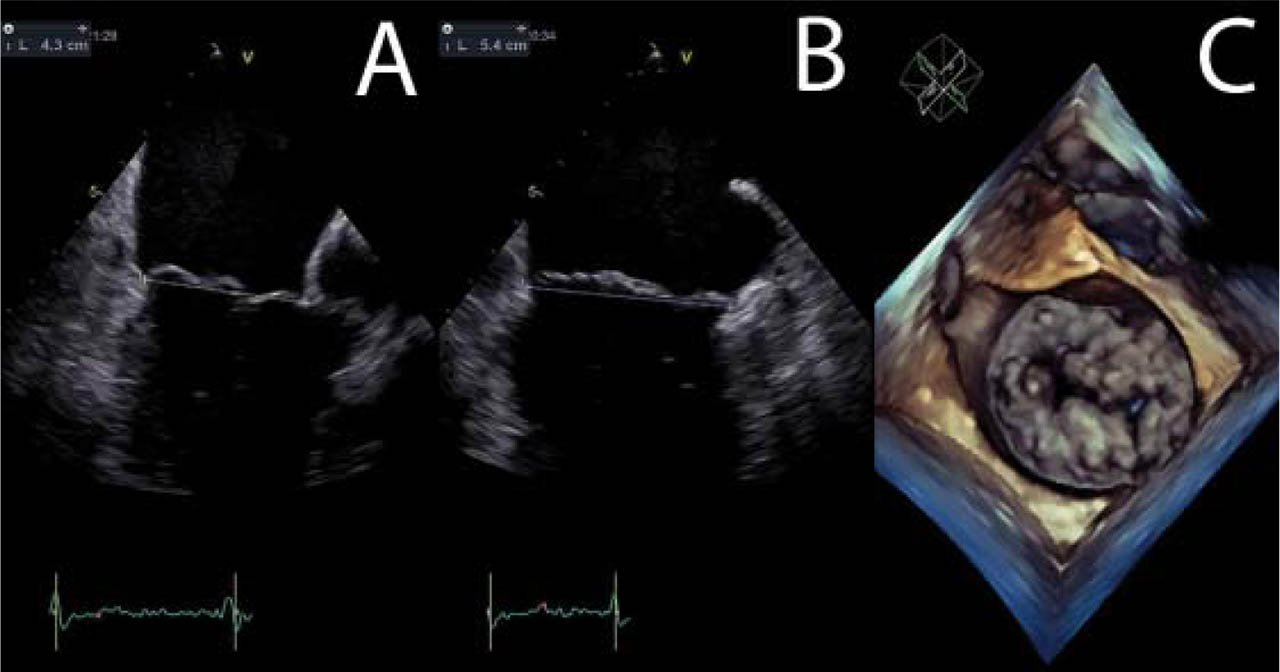
Figure 1
Transesophageal echocardiographic views for analysing the morphology of mitral valve (mid-systole still images) in a patient with extensive mitral valve mixomatous disease: mid-oesophageal long axis view for A2-P2 visualisation and measurement of antero-posterior annulus (A), bi-commisural view for P1-A2-P3 scallop visualisation and measurement of commissural diameter (B), „en-face” 3D visualisation of mitral valve (C).
Table 1
Automatic mitral valve measurements (using 4D MV Assessment 2.0 TomTec imaging Systems)
| Parameter | Definition | Unit |
|---|---|---|
| Antero-posterior diameter | Distance between the anterior and posterior point of mitral annulus. | cm |
| Anterolateral-posteromedial diameter | Longest distance between two points on the annulus that are derived by intersecting the annulus and a line perpendicular to antero-posterior diameter. | cm |
| Commissural diameter | Distance between two points on the annulus. Both points are derived by intersecting the annulus spline with a plane that goes through both end points of the coaptation and is perpendicular to the best fitting plane. | cm |
| Annulus circumference (3D) | Real length of annulus spline | cm |
| Annulus area (3D) | Size of core area | cm2 |
| Annulus area (2D) | Size of area derived by projecting the annulus spline onto the Best Fitting Plane. | cm2 |
| Non-planar Angle | Angle between the plane formed by anterior point of MA and commissural diameter and the plane formed by posterior point of MA and commissural diameter. | ° |
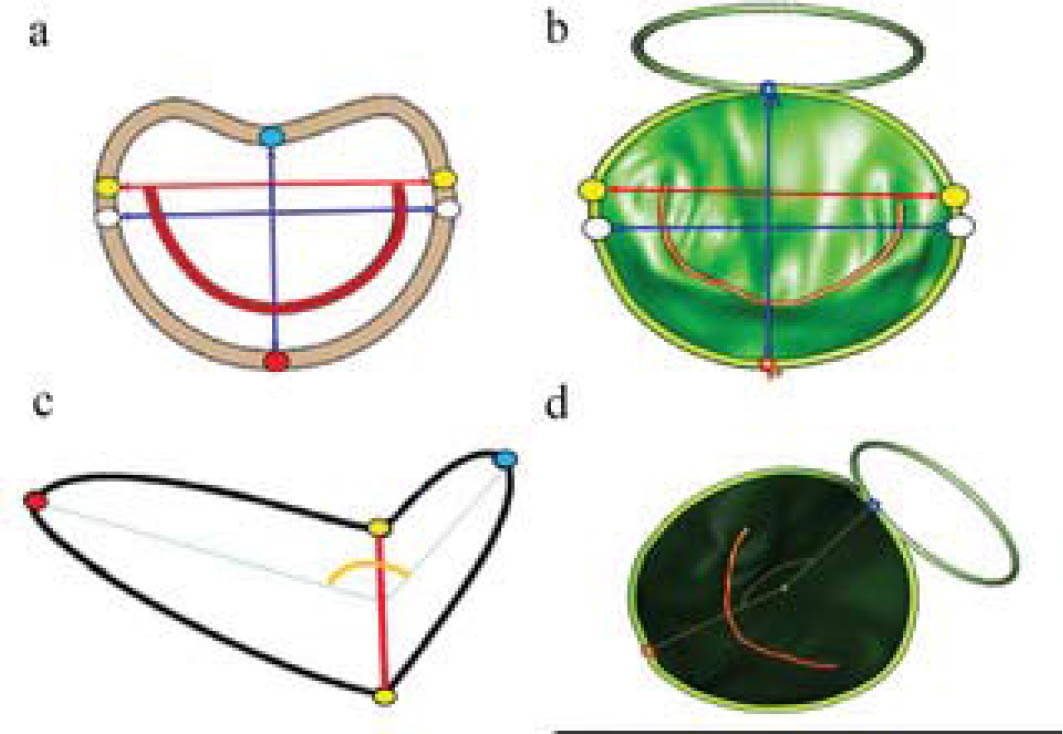
Figure 2
Mitral annulus measurements performed using 3D reconstructed model (b,d): antero-posterior diameter (between red and blue dots- a and b), anterolateral-posteromedial diameter (between white dots- a and b), bi-commissural diameter (between yellow dots), non-planar angle (c and d).
Table 2
Demographic and clinical characteristics in normal subjects and patients with mitral regurgitation
| Normal subjects | Limited MVD | Extensive MVD | p* | |
|---|---|---|---|---|
| Patients, n | 38 | 58 | 41 | |
| Age, y | 54.9+/−10.6 | 58.5+/−9.1 | 56.11+/−10.33 | 0.55 |
| Men, % | 57.9 | 58.6 | 56.1 | 0.96 |
| BSA, m2 | 1.91+/−0.2 | 1.85+/−0.2 | 1.83+/−0.19 | 0.14 |
| Symptoms | ||||
| • No symptoms | 38 | |||
| • NYHA I | 28 | 22 | ||
| • NYHA II | 14 | 13 | ||
| • NYHA III | 6 | 4 |
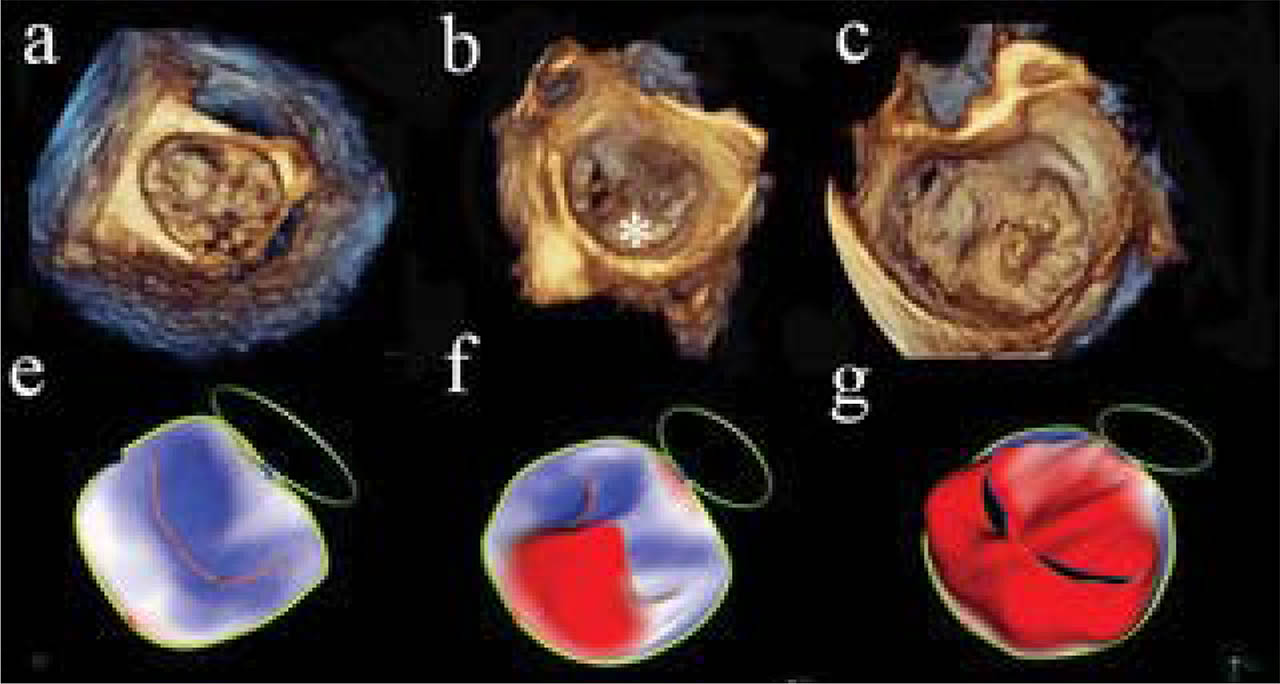
Figure 3
The three groups analysed in our study (3D atrial view of mitral valve- a, b and c and mathematical model- e, f and g): normal (a and e), limited mitral valve disease (b and f) and extensive mitral valve disease (c and g).
Table 3
Parameters of mitral valve apparatus geometry
| Normal | Limited MVD | Extensive MVD | p | p′ | |
|---|---|---|---|---|---|
| Patients (number) | 38 | 58 | 41 | ||
| Antero-posterior diameter2 (cm) | 3+/−0.23 | 3.58+/−0.56 | 3,86+/−0.61 | <0.001 | 0.008 |
| Anterolateral-posteromedial diameter2 (cm) | 3.35+/−.31 | 3.84+/−0.55 | 4.27+/−0.7 | <0.001 | <0.001 |
| MA circumference2 (cm) | 10,46+/−0,87 | 12,15+/−1,7 | 13.4+/−2.18 | <0.001 | <0.001 |
| MA 2D area2 (cm2) | 8,08+/−1,35 | 11,14+/−3,3 | 13.53+/−4.53 | <0.001 | 0.001 |
| MA 3D area2 (cm2) | 8,3+/−1,38 | 11,33+/−3,36 | 13.66+/−4.2 | <0.001 | 0.001 |
| Intercommisural distance2 (cm) | 3,31+/−0.31 | 3,75+/−0.52 | 4.14+/−0.68 | <0.001 | <0.001 |
| Anterior mitral leaflet area2 (cm) | 5,32+/−0,92 | 6,71+/−2,00 | 8.4+/−2.9 | <0.001 | <0.001 |
| Posterior mitral leaflet area2 (cm2) | 4,02+/−0,93 | 7,16+/−3,15 | 9.51+/−4.64 | <0.001 | 0.001 |
| Leaflets area reported to 3D MA area2 | 1.1+/−0.05 | 1.2+/−0.11 | 1.3+/−0.20 | <0.001 | 0.005 |
| Mitral-aortic angle2 (degree) | 120,91+/−10,50 | 122,09+/−12,33 | 119.73+/−25.66 | 0,936 | 0.74 |
| Nonplanar angle- beginning systole | 150,23+/−8,73 | 154,45+/−11.97 | 162.83+/−13.29 | <0.001 | <0.001 |
| Nonplanar angle- early-systole | 146,81+/−8,87 | 150,91+/−12,36 | 160.19+/−11.92 | <0.001 | <0.001 |
| Nonplanar angle- mid-systole | 147,13+/−7,92 | 152,29+/−10,01 | 158.21+/−10.70 | <0.001 | 0.006 |
| Nonplanar angle- late- systole | 149,93+/−7,07 | 155,21+/−10.01 | 158.21+/−10.7 | 0,001 | 0.124 |
| Nonplanar angle- end-systole | 153,64+/−7,51 | 157,54+/−10,18 | 158.10+/−11.23 | 0,09 | 0.7 |
| Nonplanar angle- mean value | 149,55+/−7,23 | 153.48+/−10.18 | 159.46+/−10.3 | <0.001 | 0.003 |
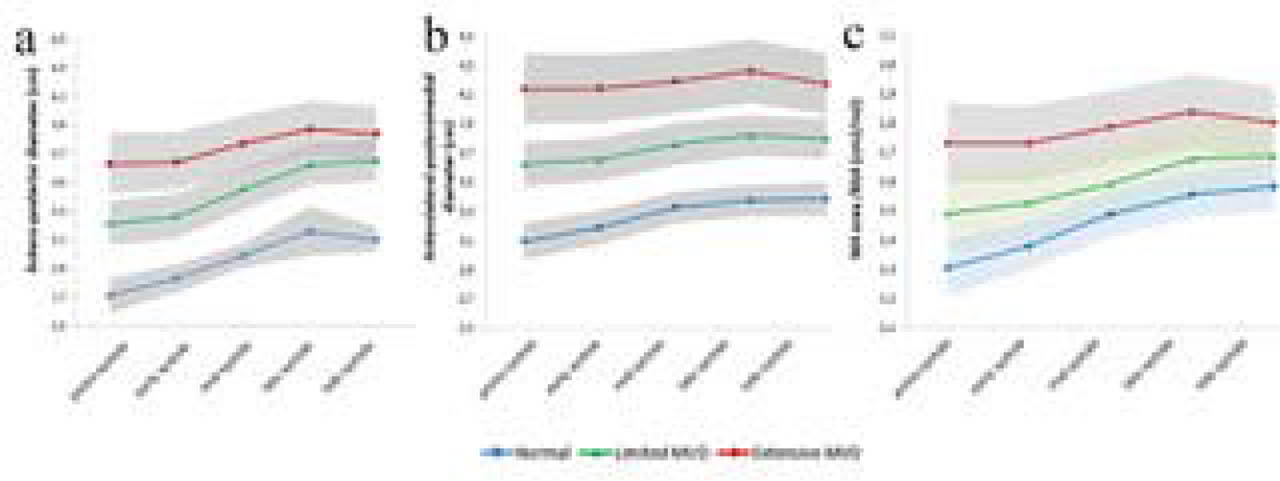
Figure 4
Static MA parameters dynamics among five systolic moments (beginning of systole of proto-systole, early systole, mid-systole, late systole and end of systole or tele-systole): the MA antero-posterior diameter is larger in patients with limited MVD (green) comparing to normal (blue) and even larger in patients with extensive MVD (red) and increases along systole in all groups but the increasing rate is higher in patients with limited MVD (a); the MA anterolateral-posteromedial diameter (b) and MA area (c) has the same characteristics as MA antero-posterior diameter.
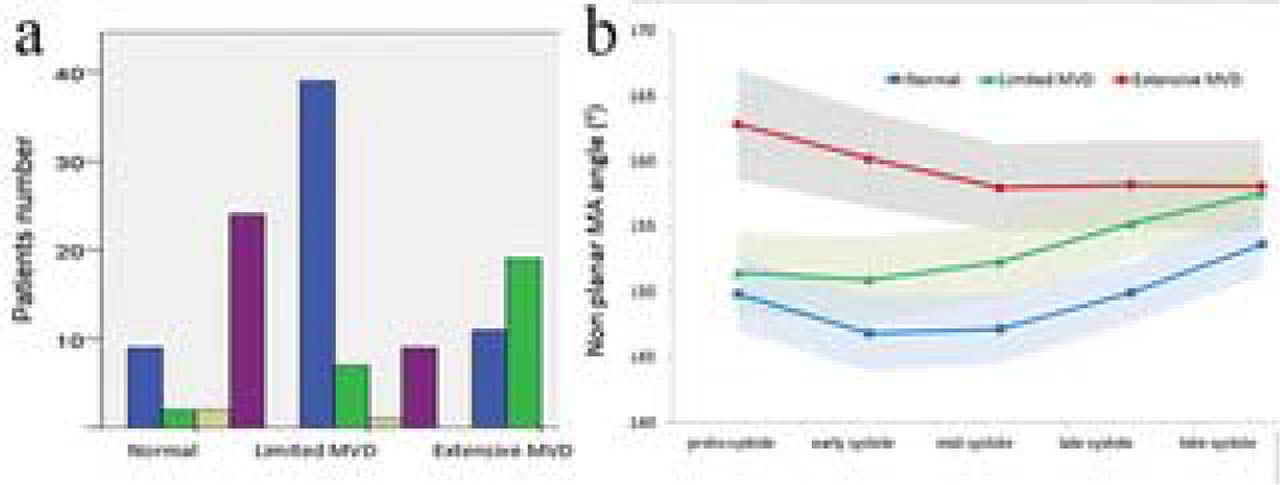
Figure 5
The graphic representation of MA non-planar dynamic evolution during systole (a): ascendant–blue, descendent – green, U turn yellow and U shape- purple; in the group of normal the U turn pattern is predominant while in the group of patients with limited mitral valve disease the predominant pattern is ascendant and in the group of patients with extensive mitral valve disease the predominant pattern is descending. Therefore, the MA non-planar angle dynamics describe an ascendant-descendent shape in normal group (blue), an ascendant shape in limited MVD group (green) and descendent shape in extensive MVD group (red).
Table 4
Parameters of mitral annulus dynamics
| Parameter | Normal subjects | Limited MVD | Extensive MVD | p | p′ |
|---|---|---|---|---|---|
| Annular displacement (mm) | 8,01+/−2,66 | 8.83+/−2.88 | 6.42+/−2.76 | 0,000 | <0.001 |
| Annular velocity (mm/sec) | 32,84+/−11,86 | 40.77+/−14.56 | 31.2+/−14.25 | 0,001 | 0.001 |
| Antero-posterior diameter change (%) | 15.03+/−1.6 | 13.9+/−6.5 | 9.8+/−0.05 | 0.004 | 0.007 |
| Anterolateral-postero medial diameter change (%) | 10.2+/−5.3 | 6.9+/−4.4 | 6.8+/−4.5 | 0.002 | 0.92 |
| Fractional 3D MA area change (%) | 21,59+/−12,36 | 16.06+/−8.41 | 11.89+/−7.3 | 0,000 | 0.033 |
| Fractional non-planar MA angle change (%) | 10,34+/−6,34 | 11.87+/−6.61 | 14.15+/−7.8 | 0,51 | 0.89 |
[i] p value is obtained by ANOVA among the three groups and p′ value is calculated using independent t-test between patients with limited and extensive mitral valve disease.