
Forests play important roles for humans and the environment. The conservation of forests is an important global imperative, given the myriad environmental, social, and economic benefits that forests provide. From serving as vital carbon sinks and biodiversity reservoirs to offering livelihoods for millions, the health of forest ecosystems is intricately linked to the well-being of our planet and its inhabitants. However, forests face unprecedented threat from deforestation, illegal logging, climate change, and unsustainable land use practices. These challenges require comprehensive and systematic data collection to inform effective conservation strategies. Information on forest status is seamlessly useful for sustainable forest management. Forests, especially tropical forests, are being the main carbon sinks and play a vital role in climate change analysis. Deforestation is responsible for about 10% of total global warming (Achard et al., 2002). The assessments of forest traits using allometric equations have gain momentum among ecologists. Natural variations can be found in the appearance and structure of plants. As plants grow, different forms of plants emerge. Monitoring and analyzing of forests has become easier with the development of remote sensing data with fine resolutions. Crown, volume, morphology and biomass of trees can be effectively identified and measured using satellite imagery (Barret, 2014; Barrett & Christensen, 2011; Kumar et al., 2012, 2014, 2016, 2018a, 2018b, 2022; Singh et al., 2021). It has made it possible to identify and measure the crown dimension, volume, morphology and biomass of individual trees from satellite imagery (Popescu et al., 2003). Advances in the field of the optical remote sensing has made the assessing and monitoring of changes in forest cover easier. There are various applications of remote sensing for monitoring the earth’s surface, forest changes and the greenness level of vegetation cover. With the advances in remote sensing technology, the tedious process of collecting data through field survey, which requires a lot of time, labor and huge costs, has been simplified as the required data can be collected by establishing a clear relationship between the field measurements and spectral data.
The concentration of carbon dioxide in the atmosphere is very low (0.03%). However, this meager amount can play an important role for living organisms on Earth (Beets et al., 2014; Berg & Lindholm, 2005; Blaschke, 2010; Boudreau et al., 2008). This gas is converted into carbohydrates by plants during the process of photosynthesis. The carbon is released into the atmosphere after the plants die. Forest ecosystems are the driving force of the carbon sink due to their age, ecological conditions and possible disturbance. The carbon emission into the atmosphere is the main cause of global warming, which was duly considered in the Kyoto Protocol of the 1997 Earth Summit (Oberthür Ott, 1999). Later, it has attracted the attention of the scientific community to stop the rising carbon dioxide concentration from forests in the global carbon cycle. Thus, biomass has been considered a significant variable for assessing the environmental implications, climate change and food security (Otukei & Emanuel, 2015). Both below- and above-ground biomass are used to estimate carbon stock.
Therefore, monitoring above-ground biomass (AGB) is essential for forest carbon at different spatial scales (Mitchard et al., 2011). However, assessment of biomass is a major challenge, especially in areas characterized by complex forest structures. In areas affected by deforestation and forest degradation, there is therefore little information on carbon estimates. If carbon is not sequestered form the atmosphere and stored in soils, forests and oceans, the rate of heating the earth surface global warming would increase rapidly. The sequestration of carbon from the atmosphere helps to balance carbon dioxide levels and maintain the carbon cycle. On the contrary anthropogenic activities, especially land use change and the burning of fossil fuels, have significantly disturbed the balance.
Various researchers have estimated AGB in different forest ecosystems using allometric regression equations as a function of morphological traits (Brown et al., 1989; Glenn et al., 2008; Chave et al., 2005; Hossain et al., 2016; Segura & Kanninen, 2005; Vashum & Jayakumar, 2012). Quantification of forest biomass and estimation of carbon stocks are of great importance for forest management. Mapping the spatial pattern of forest biomass can help in assessing the carbon stock within a region for scientific management of the forest (Vargas-Larreta et al., 2017).
Kumar et al. (2018) analyzed the suitability of allometric models to assess plant morphology using parameters such as diameter, height and stem volume of Anogeissus pendula Edgew. The suitability of allometric models for analyzing morphological traits and predicting the volume of an individual tree was investigated. The allometric relationship between volume and different degrees of stem’s diameter and height was determined using linear, logarithmic, quadratic and cubic equations. The regression analysis revealed that the product of diameter and height [(D]^(2) H) in the linear regression equation has a strong relationship with tree volume (R2=0.9996). The linear regression equation model proved to be a useful model for analyzing morphological traits and predicting stem volume using the product of diameter and height [(D]^(2) H). In their work, Clerici et al. (2016) calculated the biomass and carbon stock in the Andean forest.
Field measurements, GeoEye-I and Pleiades-1A images were used to estimate above-ground biomass and total carbon stock. Six vegetation indices, namely ratio vegetation index (RVI), normalized difference vegetation index (NDVI), normalized difference greenness index (NDGI), vegetation index number (VIN) and transformed vegetation index (TVI) were used to estimate the carbon stock and biomass of the forest. Log-log, linear and semi log models were used to determine the appropriate indices for biomass estimation. They found that the applied methodology is suitable for accurate AGB estimation in a small region. Previous work on carbon assessment is based on elementary statistical studies and is less precise. Multi-temporal and spatial satellite databases with improved analytical algorithms have led to a reliable assessment of carbon and land use. Assessing the biomass of tree species is important to determine the structural aspect and conditions for their growth. The sustainability of forests also depends on the estimation of biomass. Therefore, allometric equations that consider morphological traits of forest species (tree height, crown diameter and DBH) are constructive in estimating forest biomass (Kebede & Soromessa, 2018). In this study, an attempt is made to collect data collection methods to assess forest management in Mahavir Swami Wildlife Sanctuary (MSWS), Lalitpur, UP, India using Sentinel-2A sensor data.
The Mahavir Swami Wildlife Sanctuary (MSWS) in Lalitpur is located in the state of Uttar Pradesh. Its latitudinal and longitudinal extent is 24°29′ N to 24°32′ N and 78°14′ E to 78°17′ E (Figure 1) and is situated at an elevation of 300 feet above the Betwa river, near the Vindyan Range. It is 125 km away from Jhansi. It spreads over an area of 5.4 km2. The annual dry months can range from 3 mm to 7 mm. Summer temperatures range from 27°C to 45°C and can exceed 49°C and winter temperatures range from 6°C to 26°C. The Sanctuary is less known for its wildlife, but it is an important site for the critically endangered vulture species and focuses on their populations and conservation strategy. It is an important breeding site for the Long-billed vultures (Gyps indicus) and has been reularly monitored since 2007. The high cliffs are an ideal habitat for the vultures, owls, eagles and other bird species. The forest is comprised of Sagwan (Tectona grandis) butother tree species like Arjun (Terminalia arjuna), Tendu (Diospyros melanoxylon), Gunja (Abrus precatorius) etc., are also found.
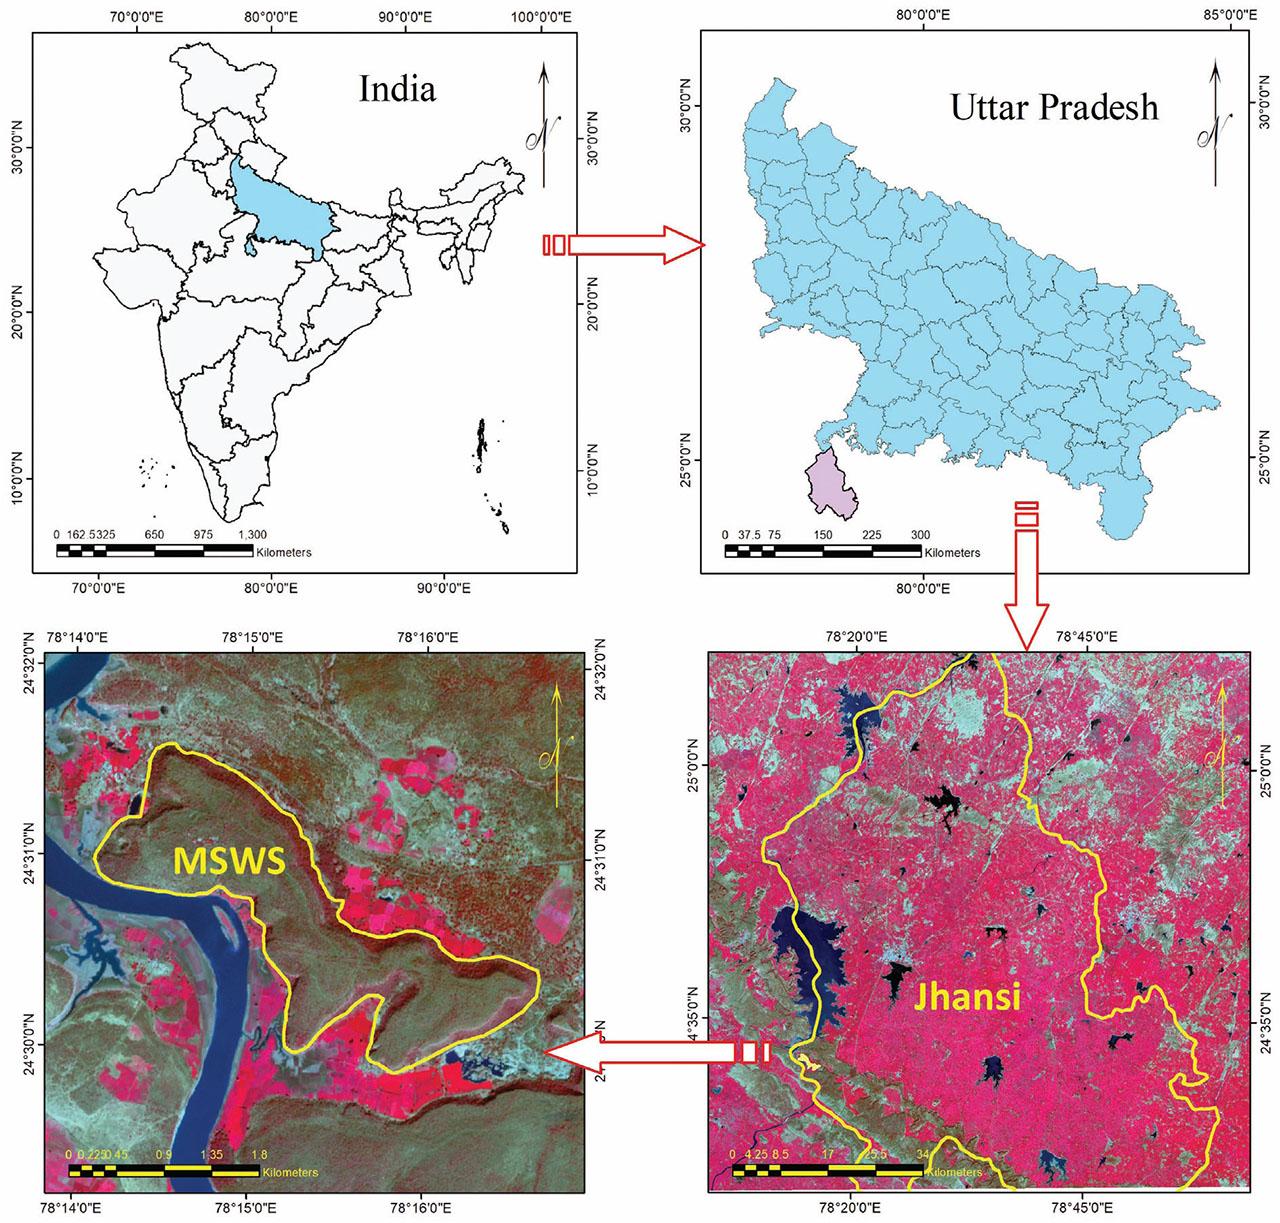
Location map of study area.
Slika 1: Lokacija preučevanega območja
Dimension of samples and unpredictability in species affect the accuracy of their estimation. Population is divided into homogenous groups and samples are selected randomly from such group independently for reducing sampling discrepancy (Chako, 1965). Effectiveness of stratification can be assessed through variance analysis. Stratified random sampling technique was utilized for collecting samples from the homogeneous groups having high normalized difference vegetation index (NDVI) values. Size of the sample was determined as:
Number of samples needed Student’s ‘t’ at a given level of probability (2 for 95% confidence limit) Desired sampling error expressed as % of mean co-efficient of variation (%)
The total required samples were determined to be 37 assuming that E% is equal to 10%. Four samples were located in inaccessible areas. Hence, 32 samples were collected from the study area. Topographic sheet on a scale of 1 : 50,000 were used for preparing base map and designing plot. For this, the topographic map was divided into number of grids of 2½′ × 2½′. Four sub grids of 1¼′ × 1¼′ size were made within each such grid of topographic map. Sufficient care is taken in laying of plots. The aspect of all the plots should be the same. The plot should be laid in a frame of 31.62*31.62 meter on one side of the stream avoiding any stream. Uniform direction either left or right should be followed throughout the plots. All the materials should be kept outside the plot to avoid trampling of the flora. A square plot of 0.1 ha was selected from grid center in two sub grids randomly selected from each grid. Within each quadrant, girth at breast height (1.37 m above ground) was measured and using measuring tape. All the measurements like tree height, DBH and branch length were properly recorded in the individual field performa prepared before field work. Similarly, the mean stand height was obtained by measuring the individual height of various trees in each quadrant using Hypsometer. The field work was carried out in the month of July, 2021.
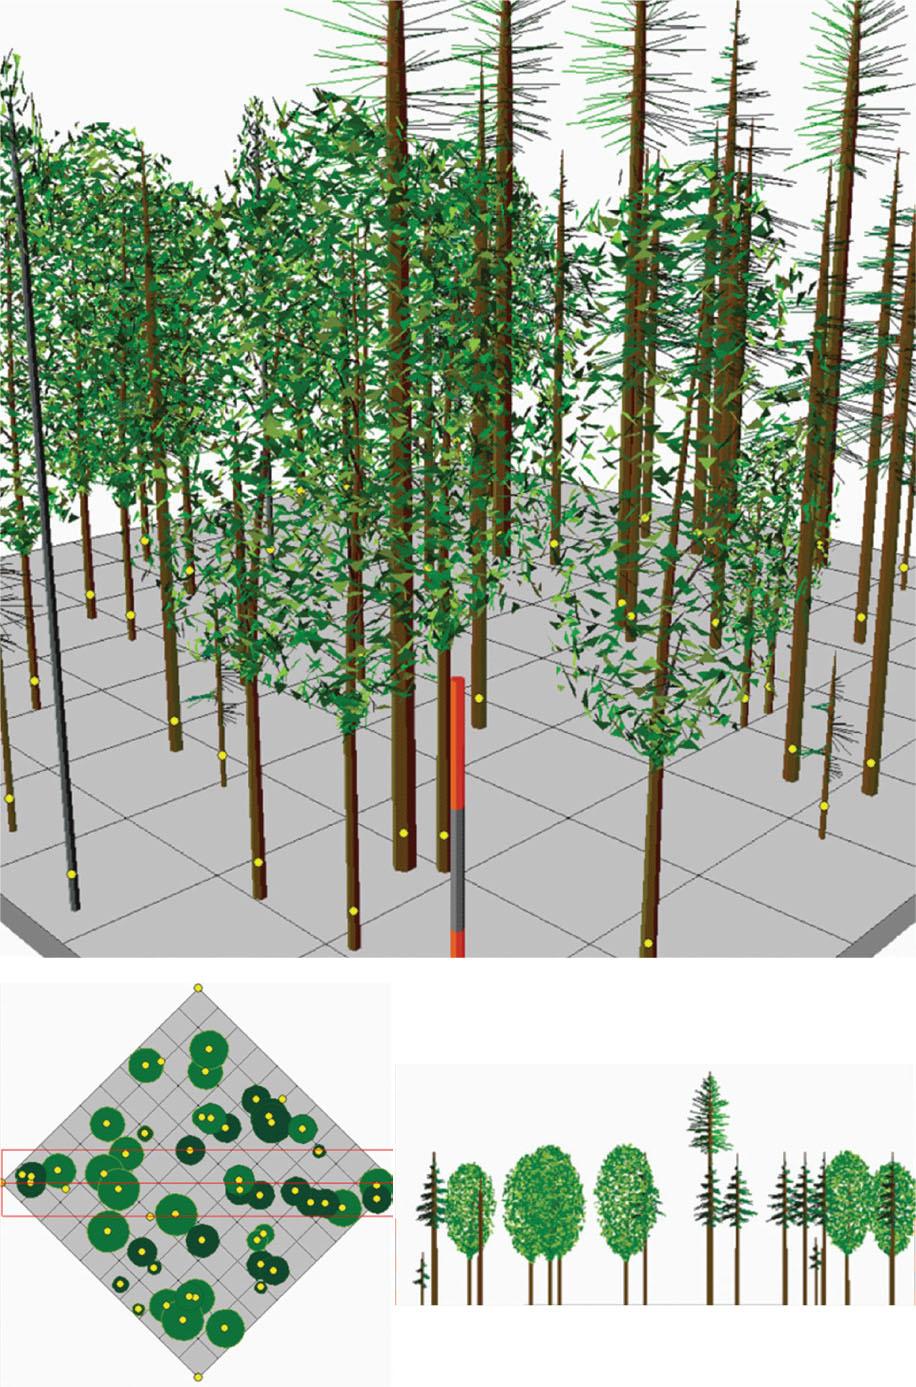
Plot layout design.
Slika 2: Zasnova postavitve raziskovalne ploskve.
The basal area/genera and species/hectare were analyzed for each plot. Diversity indices of all the sampled species in STR were calculated and their significance was determined using the analysis of variance (ANOVA). Basal area (BA) was calculated as:
Basal area of the tree (m2) Radius (cm)
Tree species were collected from each sampled transect plot. For each species total numbers of individual species were determined. Natural log of species was calculated using total number of individual species. Mean number of genera/ha was calculated from total no. of species.
Masking of non-forest areas (built up areas, agriculture, plantations and water bodies) is essential before field sampling. This is done by detecting pixels of small near infrared radiances than in the visible radiances (Blaschke, 2010). The near infrared band is sensitive to illumination variation and responds well to vegetation (Kumar, 2013). The near infrared and visible channels were normalized by non-vegetation comparison. Of the delineated tree crowns, 70% crowns were used as training sets and the 30% for data validation. A knowledge base was built for making class hierarchy (Baatz, 2004). The dominant species were separated using reflectance curve in the study area. Texture analysis (3*3 window) in ERDAS Imagine (version 2014) was used for smoothening of multispectral imagery. The tree crown edges were demarcated by zooming in at a scale of 1 : 250. The pan sharpened images allow a fine visual interpretation of overlapped tree crowns. Green, white and blue colors in the filtered image show the non-forest areas. Healthy vegetation types can also be identified in the smoothed image.
The geostatistics (spatial statistics) tool was used for autocorrelation sampling. It determines the degree to which the spatial features are either clustered or dispersed in space. This tool in ESRI’s ARC/INFO (v.10.2) software contains various indices like Moran’s I index, variance, Z-score and p-value (Figure 3). The positive and negative Moran’s I values represent cluster of data and disperse patterns respectively. The p-value is calculated from the Z-score and determines the statistical significance between the data sets and the acceptance/rejection of the null hypothesis (). Here, refers that the trees in the study area are randomly distributed.
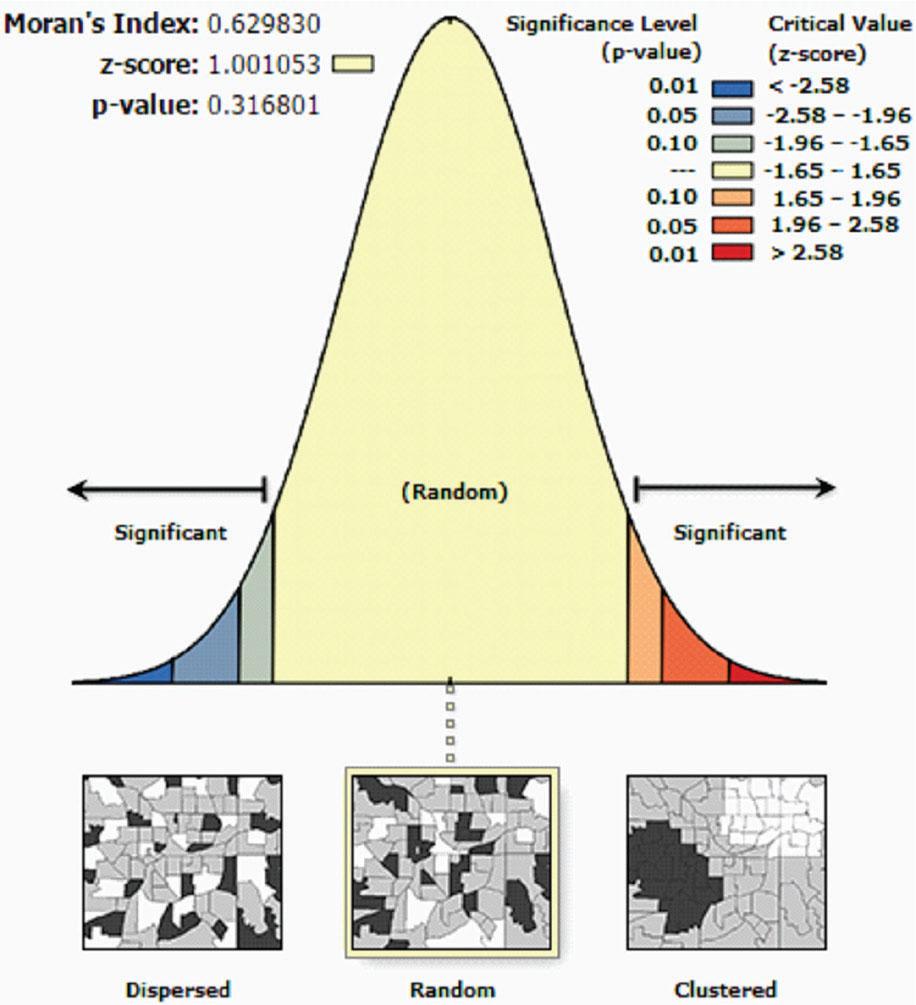
Output of Global Moran’s I.
Slika 3: Rezultat Global Moran’s I.
The graphical exploration of the data enables to get an idea about the suitable type of model to be used and to analyze the relationship between the variables. Allometric equations were developed for data fitting of the sample trees. Thirty representative tree-groups (Table 1) of six major types of tree species in MSWS consist of Sagwan (Tectona grandis) and other tree species like Arjun (Terminalia arjuna), Tendu (Diospyros melanoxylon), Gunja (Abrus precatorius
Description of sample trees species: Tree height; stem diameter at a height of; stem diameter at 1.3 m height (DBH); stem volume.
Tabela 1: Opis vzorčenih dreves: višina drevesa; premer debla na višini; premer stebla na višini 1,3 m (DBH); prostornina debla.
| Tree No. | (m) | (m) | (cm3) | NDVI |
|---|---|---|---|---|
| 1 | 0.21021 | 7.0104 | 337320.8 | 0.401 |
| 2 | 0.2183 | 7.3152 | 585221.9 | 0.333 |
| 3 | 0.22638 | 6.4008 | 687294.9 | 0.314 |
| 4 | 0.26681 | 6.096 | 452061.3 | 0.324 |
| 5 | 0.25872 | 7.62 | 486964.5 | 0.345 |
| 6 | 0.39779 | 4.572 | 581750.2 | 0.355 |
| 7 | 0.4463 | 4.8768 | 593550.4 | 0.364 |
| 8 | 0.30076 | 4.572 | 603916.1 | 0.348 |
| 9 | 0.32017 | 5.1816 | 643651.8 | 0.365 |
| 10 | 0.17787 | 9.4488 | 661400.3 | 0.365 |
| 11 | 0.18596 | 9.7536 | 671479.8 | 0.379 |
| 12 | 0.20213 | 10.0584 | 696268.8 | 0.381 |
| 13 | 0.2501 | 10.9728 | 719971.6 | 0.388 |
| 14 | 0.2838 | 10.3632 | 798965.9 | 0.385 |
| 15 | 0.254 | 10.668 | 896763.6 | 0.392 |
| 16 | 0.18596 | 9.7536 | 938555.9 | 0.389 |
| 17 | 0.20213 | 10.0584 | 977464.2 | 0.399 |
| 18 | 0.21021 | 10.9728 | 1007197 | 0.401 |
| 19 | 0.2183 | 10.3632 | 1041474 | 0.415 |
| 20 | 0.22638 | 10.668 | 1035246 | 0.418 |
| 21 | 0.26681 | 9.7536 | 1177554 | 0.441 |
| 22 | 0.25872 | 11.2776 | 1233747 | 0.465 |
| 23 | 0.27489 | 11.5824 | 1283568 | 0.475 |
| 24 | 0.28298 | 10.0584 | 1274948 | 0.469 |
| 25 | 0.25872 | 9.4488 | 1365358 | 0.457 |
| 26 | 0.18596 | 9.7536 | 1453835 | 0.478 |
| 27 | 0.25872 | 11.2776 | 1444289 | 0.498 |
| 28 | 0.27489 | 11.5824 | 1589435 | 0.512 |
| 29 | 0.28298 | 10.0584 | 1794537 | 0.524 |
| 30 | 0.25872 | 9.4488 | 2398411 | 0.621 |
Source: Based on filed survey, 2021
The field work was carried out in July 2021, as the canopy was completely closed at the beginning of the monsoon for the measurement of plant morphology. Five mean values were randomly taken from each type of tree species. Table 1 shows the description of the sample tree species.
Allometry in forestry as a statistical relationship between the dimensions of trees and their other properties is a useful tool to obtain information about the species in relation to the forest (Figure 4).
Relationship among various morphological traits.
Slika 4: Korelacija med različnimi morfološkimi znaki.
With the advances in remote sensing technology, the tedious process of data collection through field surveys, which consumes time, labour and huge costs, has been simplified as remote sensing technology allows the required data to be collected by establishing explicit relationship between the field measurements and the spectral data. Various morphological traits such as the like number of trees, tree height, diameter at breast height, stem volume and height, and the ecological index NDVI were recorded during the field sampling to analyse the relationship between them (Figure 5).
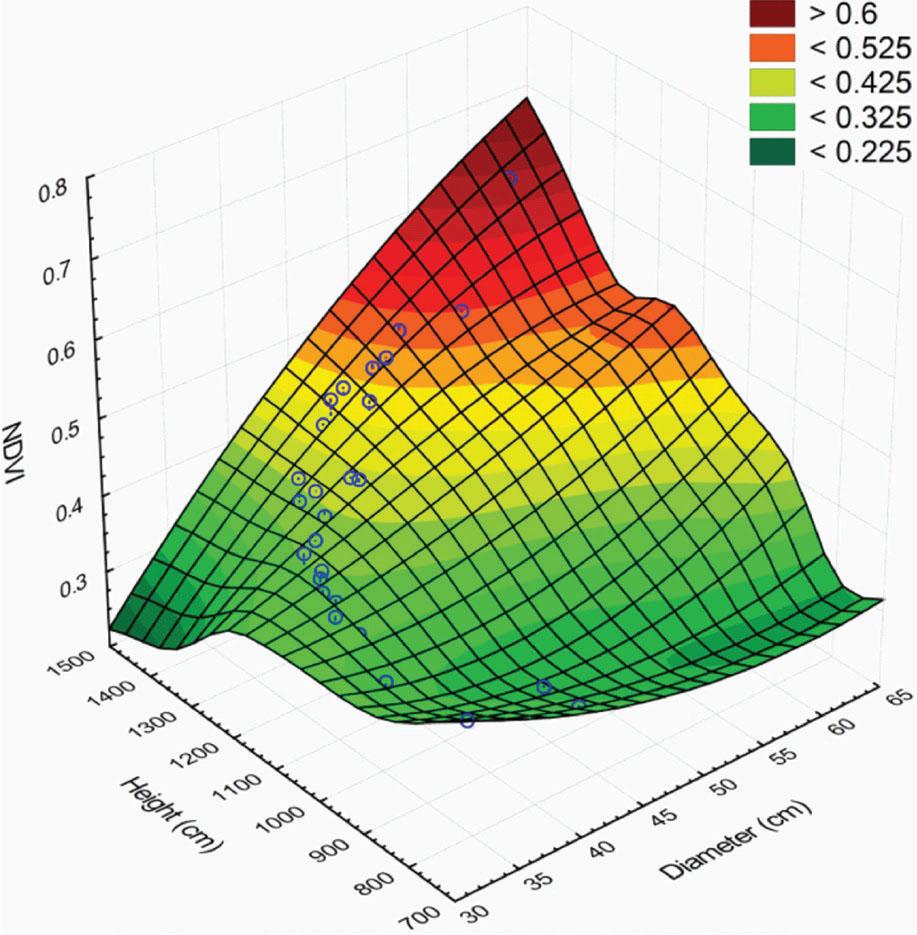
3D surface plot of NDVI against height and DBH.
Slika 5: 3D površinski grafikon NDVI, višine dreves in prsnega premera (DBH).
The findings indicate that mixed-species diversity contributes more to diversity in MSWS than that of mono-culture plantations. The present study makes an attempt to identify the species concentration among tree diversity in MSWS. This survey also provides a comprehensive overview of the current forest conservation landscape and identifies critical areas for improvement. The findings and recommendations of this study will serve as a foundation for policymakers, conservationists and stakeholders working to preserve our forests for future generations. By addressing the identified challenges and building on the successes, we can ensure a sustainable and resilient forest ecosystem.