
Table 1
Hardware and configuration parameters of the examined ECG acquisition paths
| Parameter | AD8232 path | MAX30003 path |
|---|---|---|
| Reference/input biasing | Active RLD/ driven-right-leg (DRL) path with connected RL electrode | internal input-biasing mechanisms |
| Nominal voltage gain | Approximately 1,100 V/V | 20 V/V |
| High-pass filtering | Approximately 0.5 Hz analog high-pass characteristic | Digital high-pass filter (DHPF) = 1; internal DHPF at 0.5 Hz |
| Low-pass filtering | Approximately 40 Hz analog low-pass characteristic | Digital low-pass filter (DLPF)[1:0] = 01; effective low-pass cutoff approximately 28.35 Hz at 128 sps |
| Dedicated anti-aliasing filter before analog-to-digital converter (ADC) | No additional dedicated analog anti-aliasing filter between the AD8232 output and the ESP32 ADC | Internal MAX30003 digitization and filtering |
| Digitization method | External sampling of the analog signal by the ESP32-WROOM-32E microcontroller ADC | Internal digitization in the MAX30003 device |
| ADC input/data source | GPIO36/ADC1_0 | Data read from ECG first-in, first-out |
| ADC resolution | 12 bit | 18 bit |
| ADC voltage range/reference | ESP32 ADC1 with 11 dB attenuation; effective input range approximately 0–3.3 V | Internal MAX30003 ECG ADC |
| Effective input-referred amplitude resolution | Approximately 0.65 µV/LSB | Approximately 0.381 µV/LSB |
| Nominal hardware acquisition frequency | 128 Hz | 128 sps |
| Data interface | Voltage readout through the microcontroller ADC | Digital data read via serial peripheral interface (SPI) |
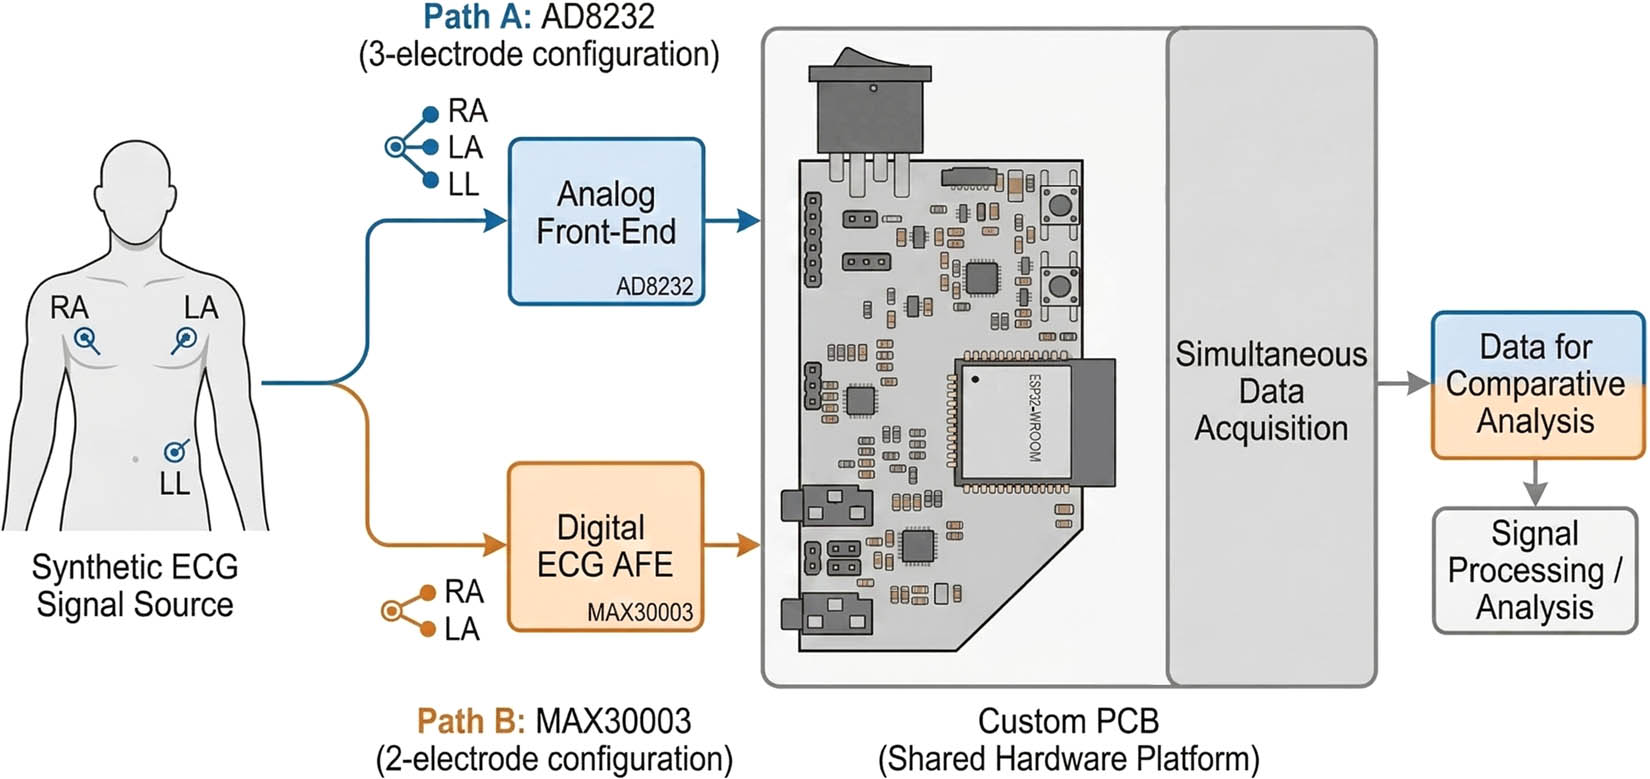
Figure 1
Measurement chain used in the study, showing a common synthetic ECG source connected to two parallel acquisition paths based on AD8232 and MAX30003 and implemented on a shared custom PCB platform.
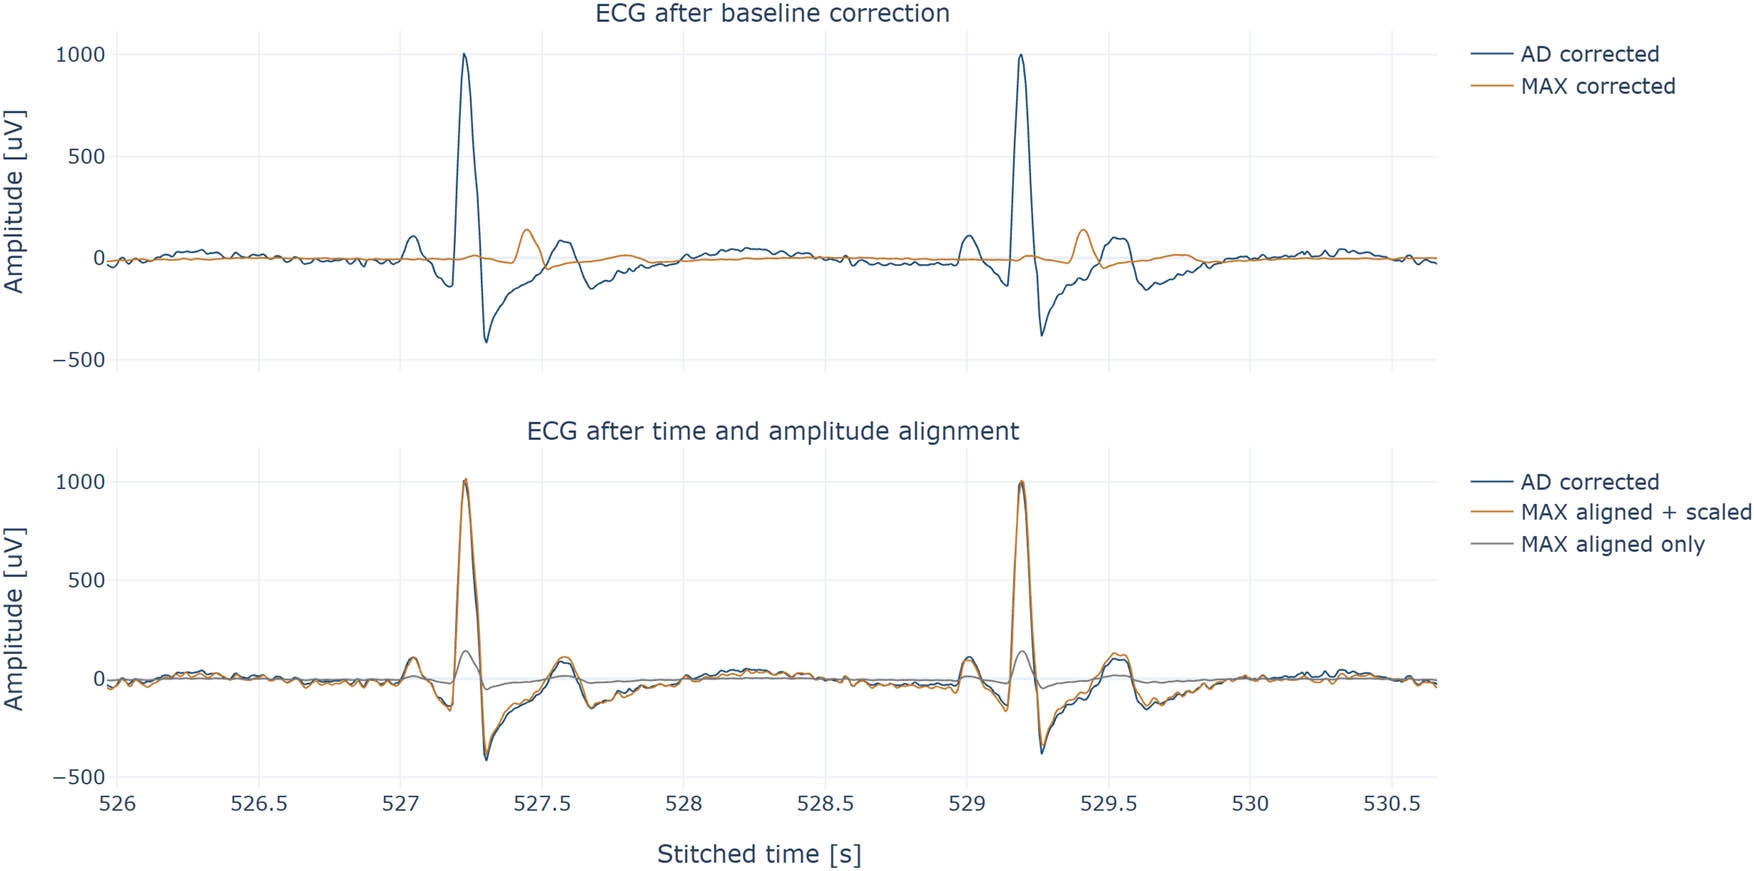
Figure 2
Representative ECG signals acquired from the AD8232- and MAX30003-based paths before and after time alignment and amplitude correction.
Table 2
Segment-level agreement metrics for normalized signals across heart-rate settings
| BPM | N segments | Pearson r median (Q1–Q3) | MAE median (Q1–Q3) | RMSE median (Q1–Q3) | NRMSE median (Q1–Q3) |
|---|---|---|---|---|---|
| 30 | 161 | 0.9924 (0.9893–0.9940) | 0.0893 (0.0839–0.0966) | 0.1306 (0.1178–0.1521) | 0.0156 (0.0140–0.0181) |
| 60 | 177 | 0.9933 (0.9890–0.9957) | 0.0826 (0.0729–0.0933) | 0.1180 (0.0953–0.1503) | 0.0185 (0.0149–0.0234) |
| 80 | 177 | 0.9933 (0.9882–0.9966) | 0.0698 (0.0554–0.0856) | 0.1163 (0.0826–0.1535) | 0.0199 (0.0139–0.0261) |
| 100 | 177 | 0.9925 (0.9861–0.9963) | 0.0704 (0.0552–0.0900) | 0.1203 (0.0869–0.1666) | 0.0218 (0.0156–0.0299) |
Table 3
QRS detection and RR-interval consistency across heart-rate settings
| BPM | QC-valid duration (s) | Expected beats | AD8232 detected | AD8232 RR (ms) | MAX30003 detected | MAX30003 RR (ms) | Nominal RR (ms) |
|---|---|---|---|---|---|---|---|
| 30 | 1609.88 | 804.9 | 806 | 1998.35 ± 30.81 | 806 | 1998.26 ± 30.95 | 2,000 |
| 60 | 1769.88 | 1769.9 | 1,768 | 1001.28 ± 16.70 | 1,769 | 1001.24 ± 16.60 | 1,000 |
| 80 | 1764.88 | 2353.2 | 2,351 | 750.14 ± 14.03 | 2,350 | 750.10 ± 14.05 | 750 |
| 100 | 1769.88 | 2949.8 | 2,954 | 598.92 ± 11.49 | 2,956 | 598.90 ± 11.46 | 600 |
Table 4
Summary similarity metrics of normalized signals for individual recordings and mean value ± SD across BPM values
| Metric | 30 BPM | 60 BPM | 80 BPM | 100 BPM | Mean value ± SD |
|---|---|---|---|---|---|
| Pearson r | 0.991 | 0.992 | 0.992 | 0.990 | 0.991 ± 0.001 |
| MAE | 0.091 | 0.084 | 0.071 | 0.075 | 0.080 ± 0.009 |
| RMSE | 0.140 | 0.129 | 0.127 | 0.138 | 0.134 ± 0.006 |
| NRMSE | 0.016 | 0.019 | 0.020 | 0.023 | 0.020 ± 0.003 |
Table 5
Quality-control summary and number of Welch segments retained for spectral analysis
| BPM | Total 10 s segments | AD retained/rejected | MAX retained/rejected | Combined retained/rejected | Retained (%) | Effective duration (s) | Welch segments AD/MAX |
|---|---|---|---|---|---|---|---|
| 30 | 161 | 161/0 | 161/0 | 161/0 | 100.0 | 1603.57 | 92/92 |
| 60 | 177 | 177/0 | 177/0 | 177/0 | 100.0 | 1768.94 | 105/105 |
| 80 | 177 | 176/1 | 176/1 | 176/1 | 99.4 | 1756.04 | 104/104 |
| 100 | 177 | 177/0 | 177/0 | 177/0 | 100.0 | 1768.49 | 105/105 |
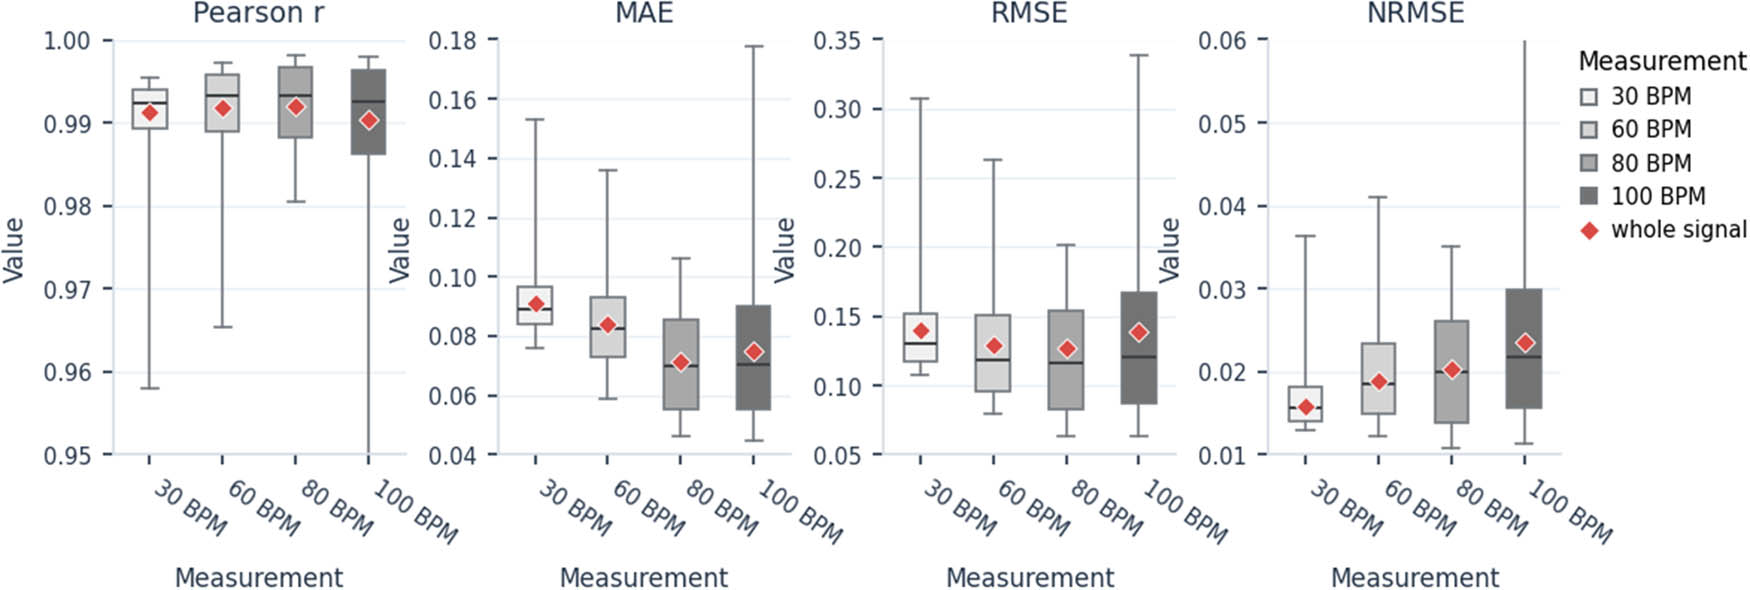
Figure 3
Segment-level distributions of Pearson correlation, MAE, RMSE, and NRMSE calculated for QC-accepted 10 s segments for the AD8232–MAX30003 comparison at each BPM setting.
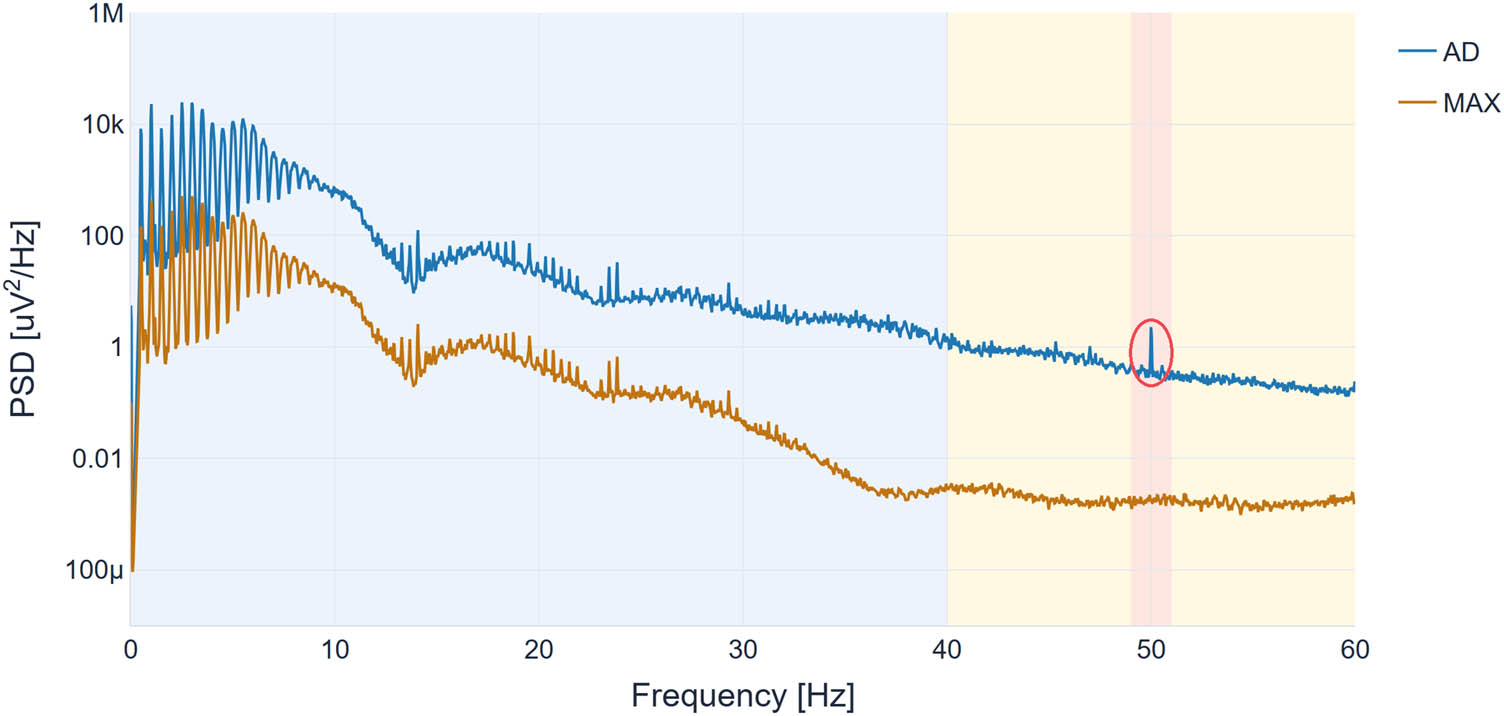
Figure 4
Welch PSD estimated for signals acquired at 30 BPM from the AD8232- and MAX30003-based acquisition paths after baseline correction and before amplitude normalization. The arrow marks a local increase in power near 50 Hz, consistent with power-line interference.
Table 6
Absolute and relative bandpower values for the AD8232 and MAX30003 acquisition paths
| BPM | Path | P LF (µV²) | P ECG (µV²) | P 50Hz (µV²) | P HF (µV²) | LFratio (%) | PLIratio (%) | HFratio (%) |
|---|---|---|---|---|---|---|---|---|
| 30 | AD8232 | 0.17300 | 29000 | 0.79900 | 9.67000 | 0.000595 | 0.00275 | 0.03330 |
| 30 | MAX30003 | 0.00387 | 591 | 0.00355 | 0.03710 | 0.000656 | 0.000600 | 0.00627 |
| 60 | AD8232 | 0.21600 | 49500 | 1.40000 | 20.6000 | 0.000436 | 0.00282 | 0.04170 |
| 60 | MAX30003 | 0.00495 | 1020 | 0.00461 | 0.05530 | 0.000487 | 0.000454 | 0.00545 |
| 80 | AD8232 | 0.20900 | 58900 | 2.69000 | 27.8000 | 0.000354 | 0.00457 | 0.04710 |
| 80 | MAX30003 | 0.00423 | 1170 | 0.00545 | 0.06120 | 0.000360 | 0.000465 | 0.00522 |
| 100 | AD8232 | 0.12800 | 65200 | 2.99000 | 41.5000 | 0.000196 | 0.00458 | 0.06370 |
| 100 | MAX30003 | 0.00406 | 1320 | 0.00648 | 0.07650 | 0.000307 | 0.000491 | 0.00579 |
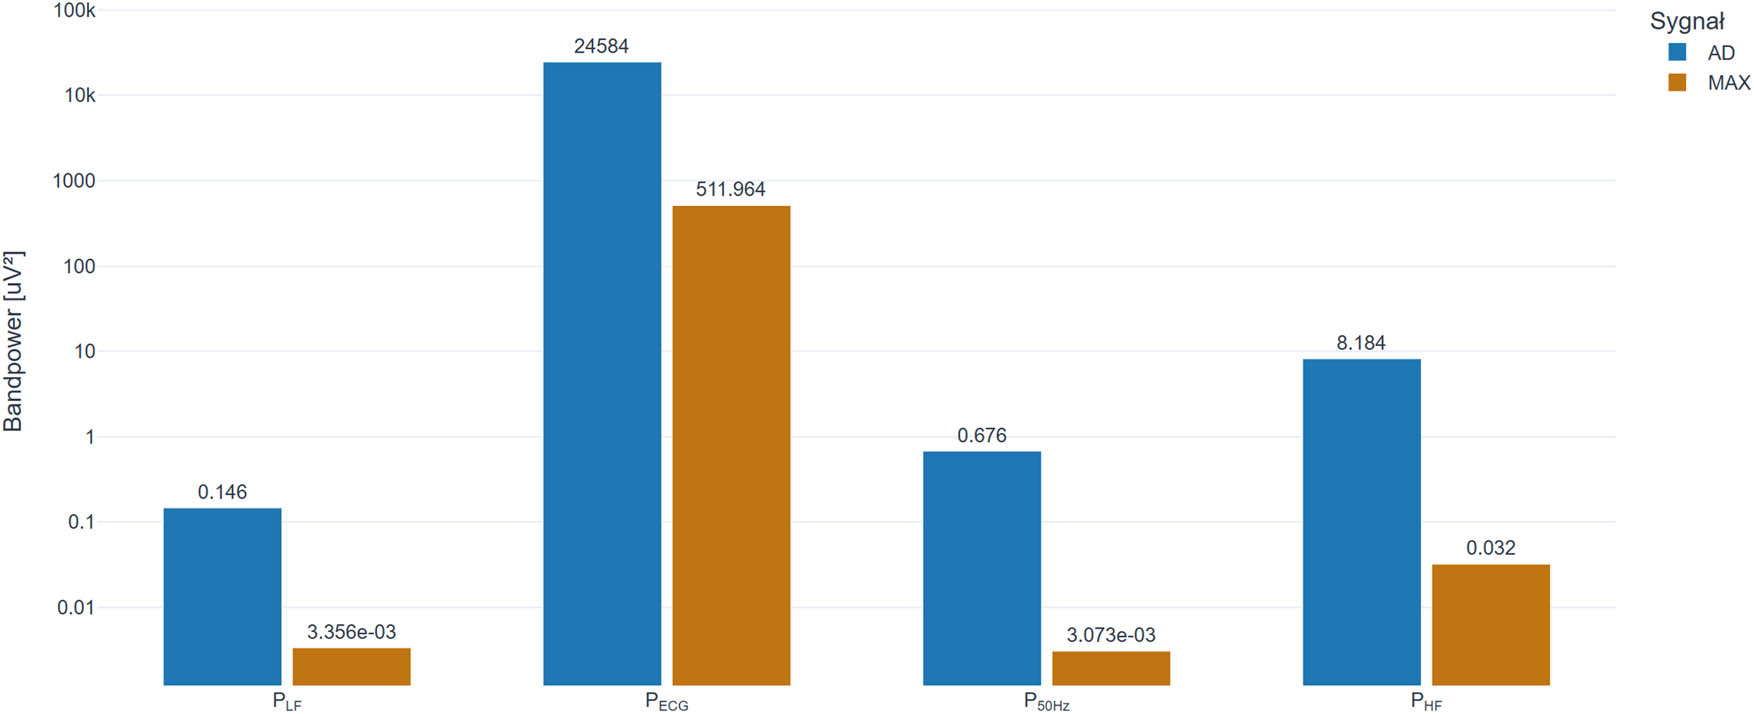
Figure 5
Absolute bandpower components for the AD8232- and MAX30003-based acquisition paths at 30 BPM.
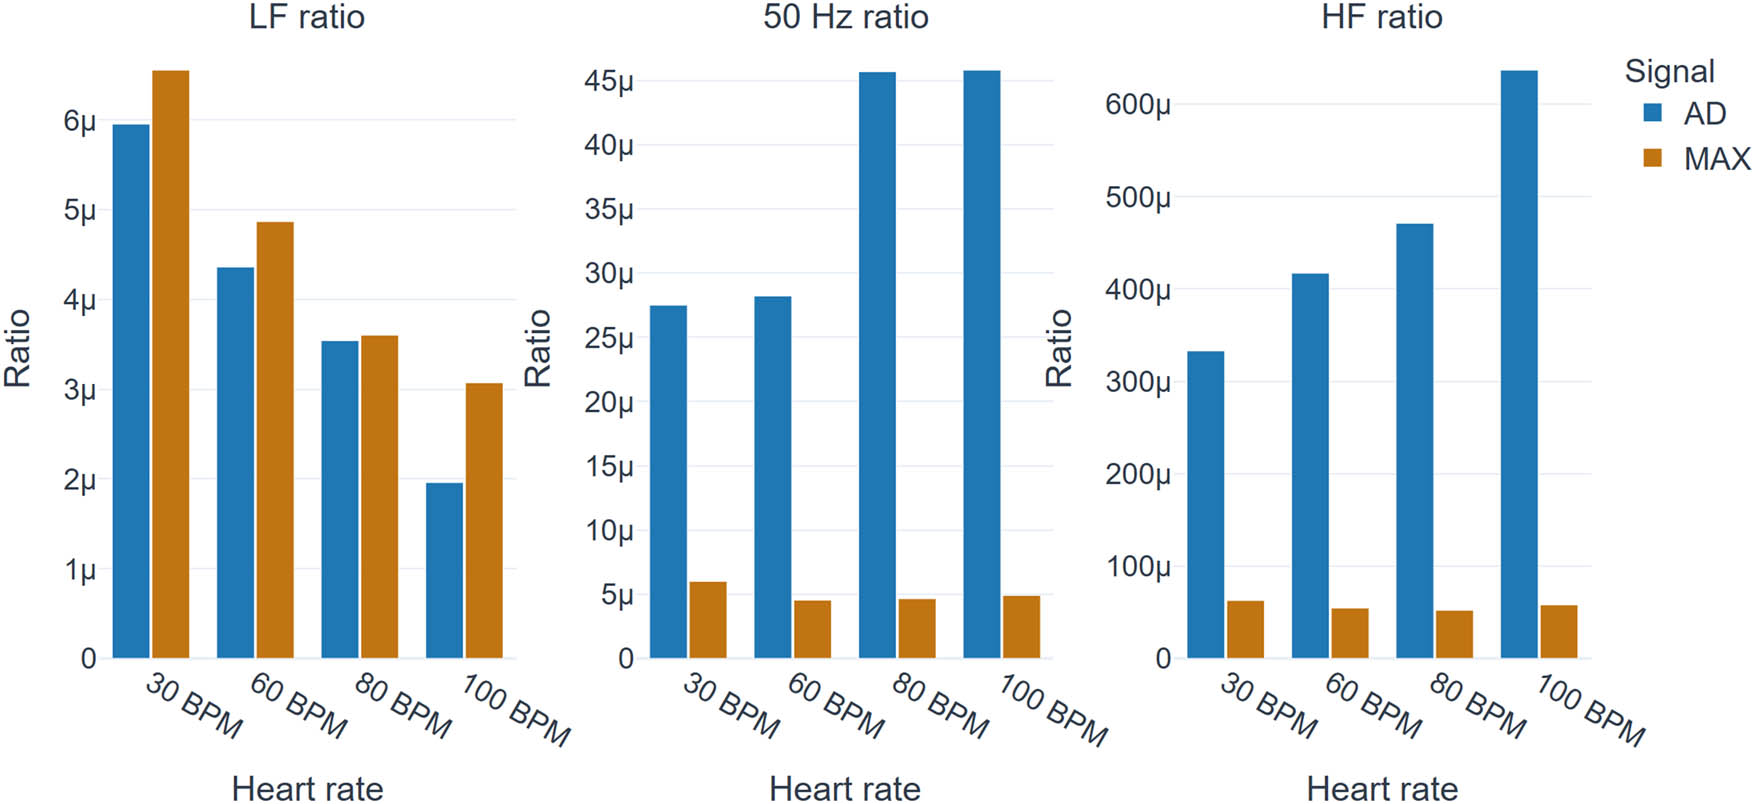
Figure 6
Comparison of relative spectral indices for the analyzed signals, including LFratio, 50 Hz ratio, and HFratio.
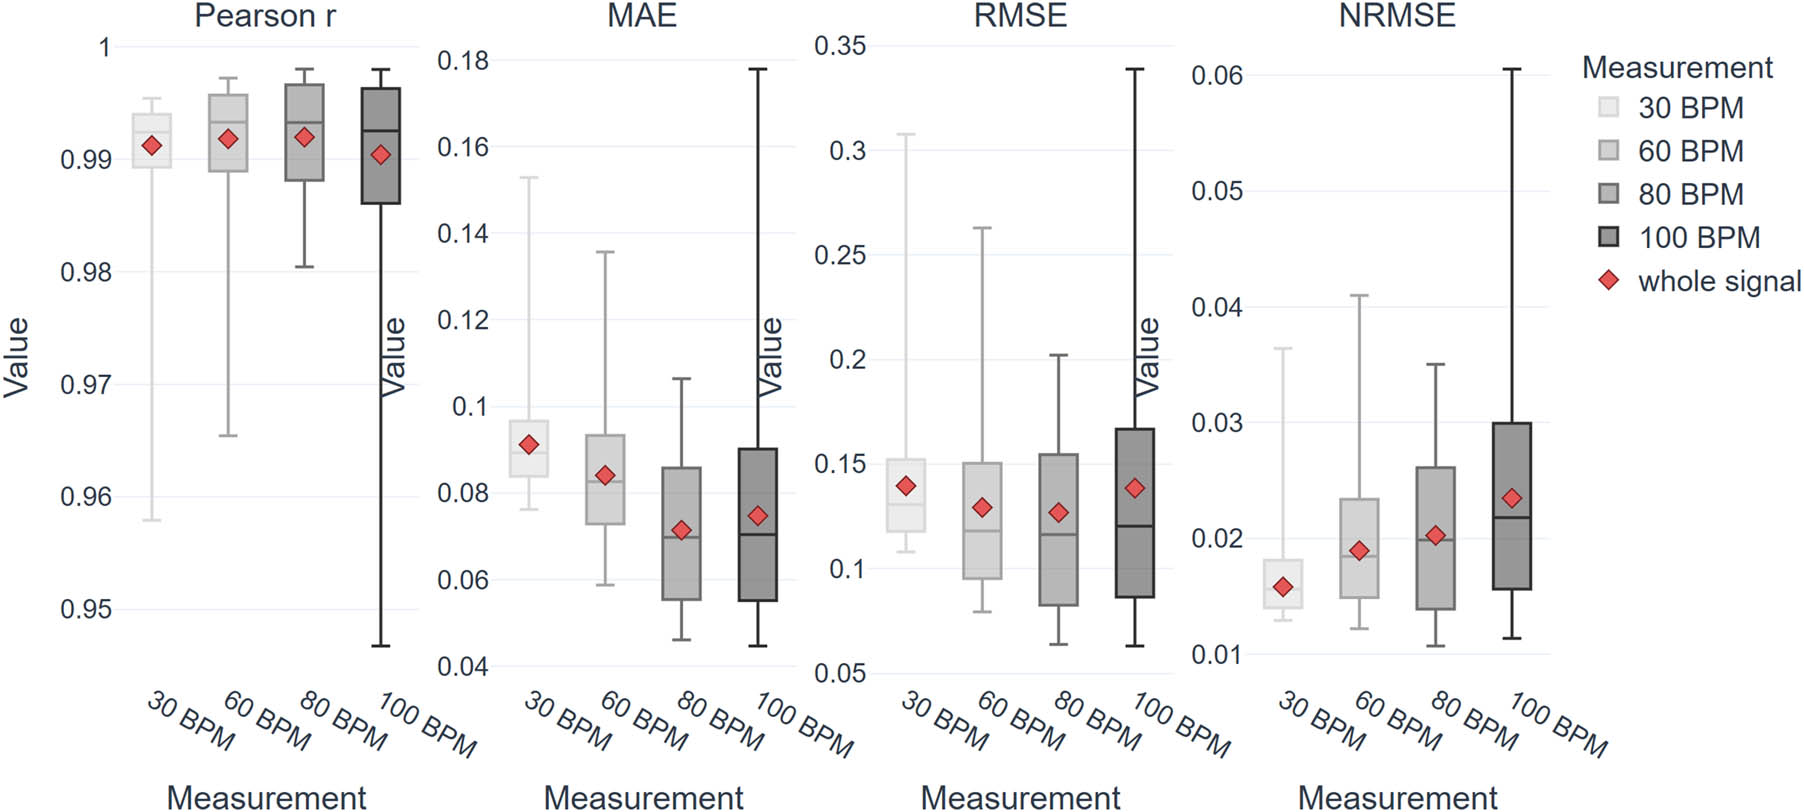
Figure 7
Comparison of Pearson correlation, MAE, RMSE, and NRMSE for time-aligned and normalized signals across all analyzed heart-rate settings.
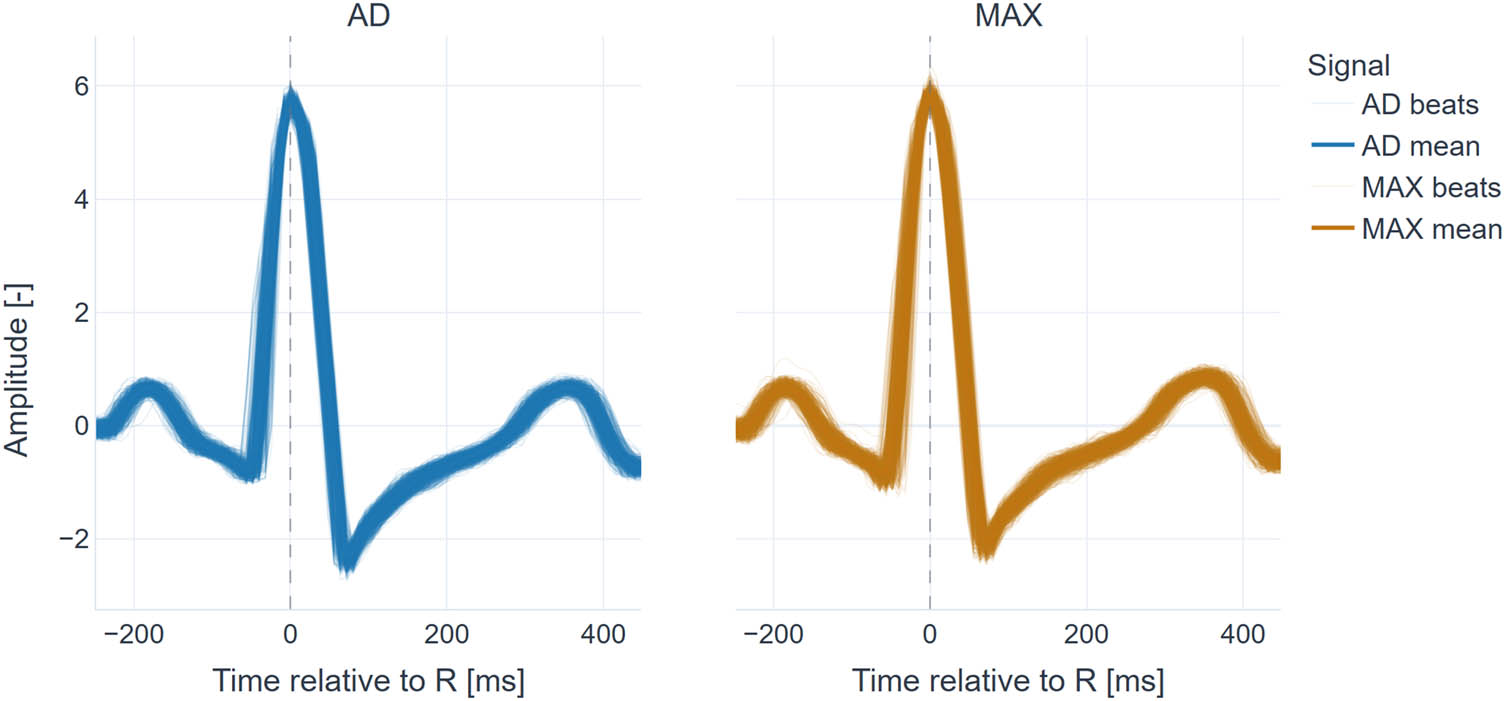
Figure 8
Overlay of individual R-aligned beats and the corresponding mean beat for the AD8232-based path (left) and the MAX30003-based path (right) for the 30 BPM recording.
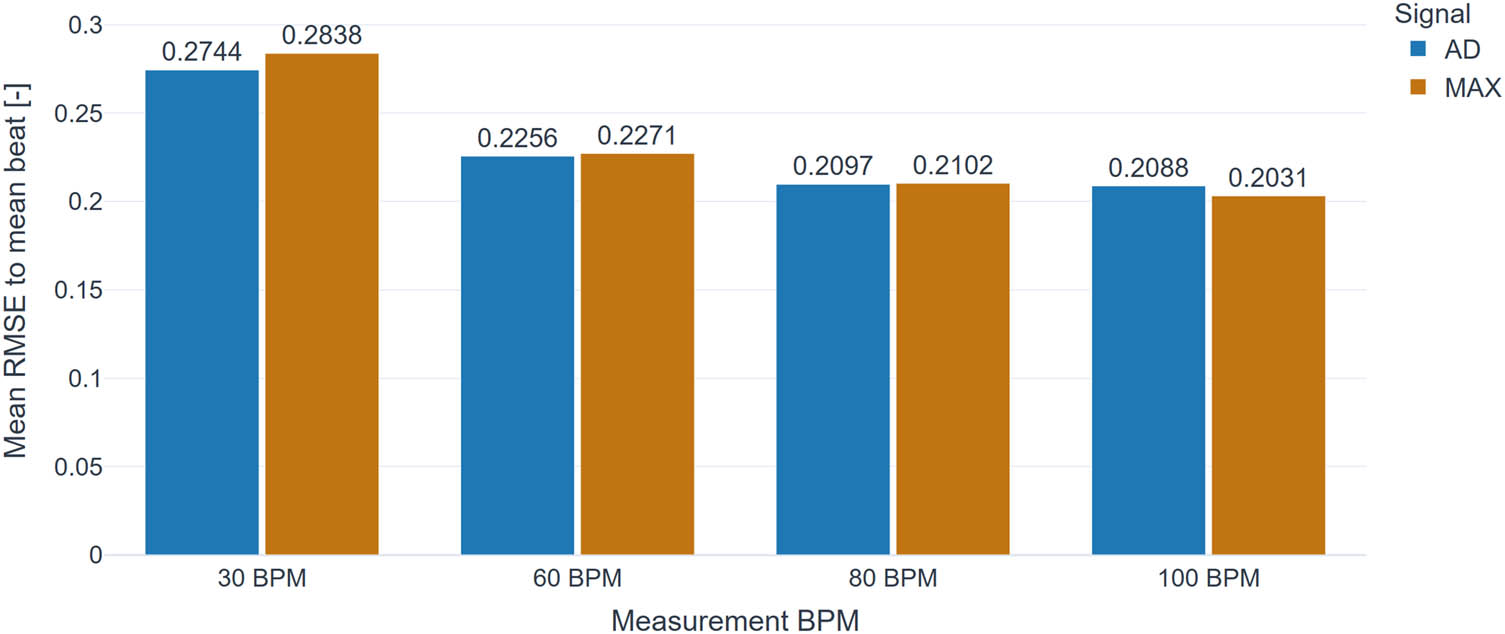
Figure 9
Beat-to-beat repeatability expressed as mean RMSE between individual beats and the corresponding mean beat for both acquisition paths.