
1. Introduction
Portable and wearable biosignal monitoring systems intended for use outside the conventional hospital environment have undergone rapid development in recent years. This trend has been driven by advances in electronics miniaturization, the widespread availability of low-power microcontrollers, and the integration of biosignal acquisition with wireless transmission and telemedicine solutions [1,2]. In such systems, signal quality, robustness to interference, and acquisition-path stability are of particular importance, as hardware specifications may directly influence the analytical value of the collected data, while adequate interference reduction constitutes one of the fundamental stages in preparing biosignals for reliable quantitative analysis [3–5].
From the perspective of biomedical system design, the problem extends beyond the acquisition of the electrocardiogram (ECG) signal itself to the characterization of the complete acquisition chain, including the input stage, the digitization method, and downstream signal processing. This is particularly relevant with regard to interference suppression, noise reduction, and preservation of signal quality sufficient for further analysis [3,4,6]. In the present study, two implemented ECG acquisition paths based on the AD8232 and MAX30003CTI + integrated circuits were compared. These devices represent distinct implementation approaches in terms of architecture and anticipated application scenarios [7,8].
A reliable comparison of ECG acquisition paths requires the minimization of confounding factors unrelated to the electronics under survey. Human recordings are affected by intersubject variability, changes in electrode–skin contact impedance, motion artifacts, and instability of electrode placement [3–5]. For this reason, the use of a controlled synthetic source is justified in comparative studies, as it enables the generation of repeatable waveforms with predefined temporal and morphological characteristics [9–11].
A synthetic signal is not a clinical reference standard because it does not capture the full complexity of a real patient recording. It nevertheless constitutes a useful model signal for technical analysis, validation of signal-processing procedures, and comparison of acquisition-path properties [10–12]. This approach is well established both in classical models of synthetic ECG generation and in the PhysioNet ecosystem, which remains one of the principal reference environments for testing algorithms and analyzing physiological signals [9–11].
The aim of this study is to compare two implemented ECG acquisition paths based on AD8232 and MAX30003 under controlled laboratory conditions using a common synthetic ECG source. The comparison focused on post-processed morphological agreement and relative spectral-noise characteristics, while explicitly acknowledging that the evaluated systems differed not only in the front-end circuitry itself but also in the signal digitization pathway.
2. Materials and methods
The study was conducted using an experimental setup that enabled the parallel acquisition of a synthetic ECG signal in two independent acquisition paths.
Both acquisition paths were implemented on a custom printed circuit board (PCB) designed specifically to compare two complete ECG measurement paths based on the AD8232 and MAX30003 devices. The input stages were designed in accordance with the recommendations provided in the manufacturers’ documentation for these devices [7,8].
The AD8232 path operated in a three-electrode right arm/left arm/right leg configuration, in which the RL electrode was driven by the active right-leg-drive (RLD) circuit to provide common-mode feedback. The MAX30003 path operated as a two-electrode differential positive ECG input (ECGP)/negative ECG input (ECGN) path without an external RLD electrode. In this measurement path, internal input-biasing mechanisms as well as internal signal digitization and filtering were used. The detailed hardware and configuration parameters of both paths are summarized in Table 1. Therefore, the study should be interpreted as a comparison of two complete implemented ECG acquisition paths operating with the same synthetic signal source. A schematic of the measurement chain is shown in Figure 1.
Table 1
Hardware and configuration parameters of the examined ECG acquisition paths
| Parameter | AD8232 path | MAX30003 path |
|---|---|---|
| Reference/input biasing | Active RLD/ driven-right-leg (DRL) path with connected RL electrode | internal input-biasing mechanisms |
| Nominal voltage gain | Approximately 1,100 V/V | 20 V/V |
| High-pass filtering | Approximately 0.5 Hz analog high-pass characteristic | Digital high-pass filter (DHPF) = 1; internal DHPF at 0.5 Hz |
| Low-pass filtering | Approximately 40 Hz analog low-pass characteristic | Digital low-pass filter (DLPF)[1:0] = 01; effective low-pass cutoff approximately 28.35 Hz at 128 sps |
| Dedicated anti-aliasing filter before analog-to-digital converter (ADC) | No additional dedicated analog anti-aliasing filter between the AD8232 output and the ESP32 ADC | Internal MAX30003 digitization and filtering |
| Digitization method | External sampling of the analog signal by the ESP32-WROOM-32E microcontroller ADC | Internal digitization in the MAX30003 device |
| ADC input/data source | GPIO36/ADC1_0 | Data read from ECG first-in, first-out |
| ADC resolution | 12 bit | 18 bit |
| ADC voltage range/reference | ESP32 ADC1 with 11 dB attenuation; effective input range approximately 0–3.3 V | Internal MAX30003 ECG ADC |
| Effective input-referred amplitude resolution | Approximately 0.65 µV/LSB | Approximately 0.381 µV/LSB |
| Nominal hardware acquisition frequency | 128 Hz | 128 sps |
| Data interface | Voltage readout through the microcontroller ADC | Digital data read via serial peripheral interface (SPI) |
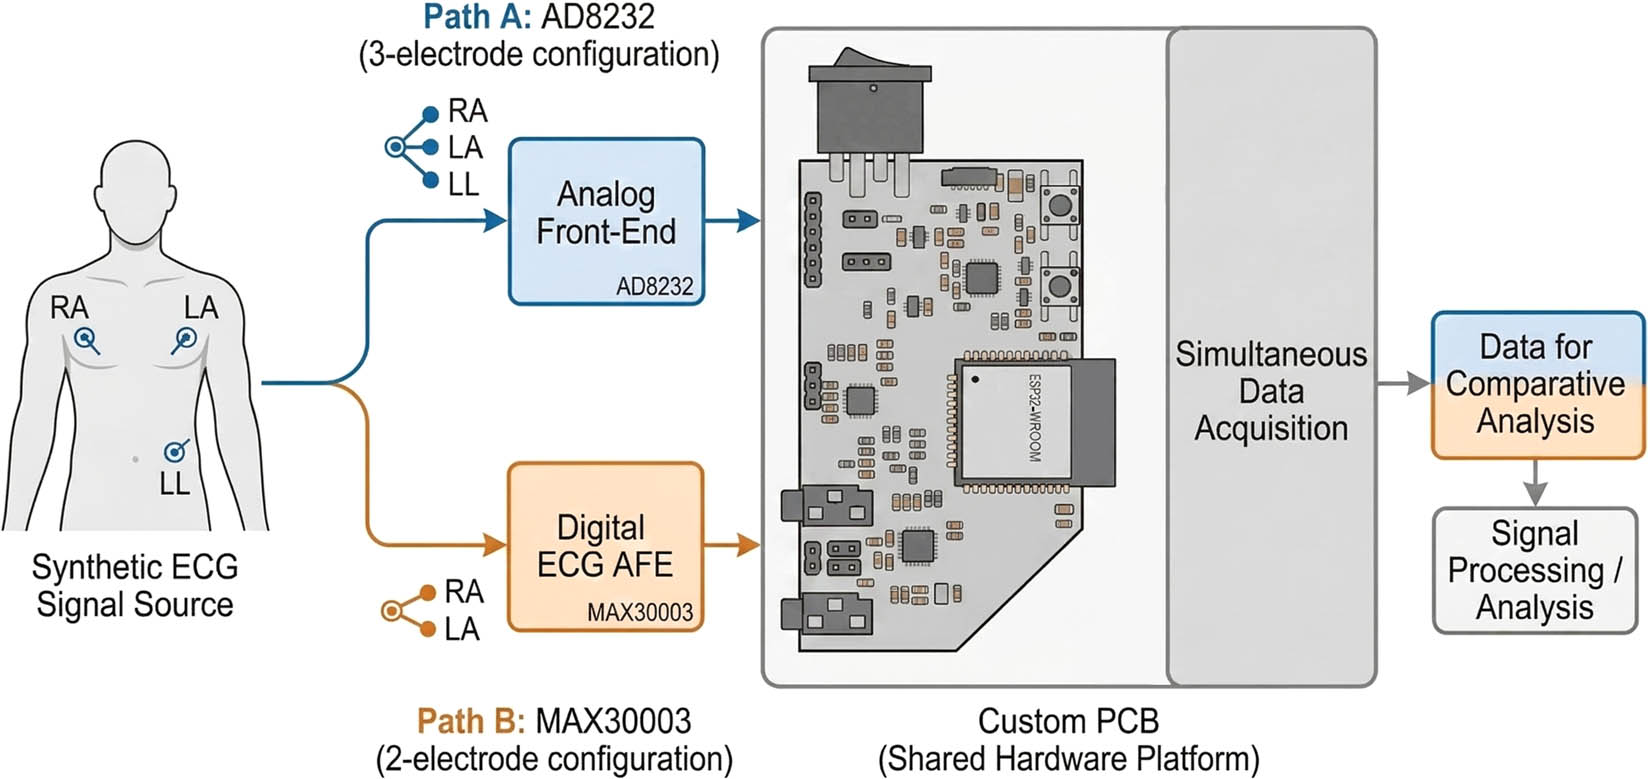
Figure 1
Measurement chain used in the study, showing a common synthetic ECG source connected to two parallel acquisition paths based on AD8232 and MAX30003 and implemented on a shared custom PCB platform.
The input signal source was shared by both paths, ensuring that each circuit recorded the same waveform during the same measurement session. A patient simulator, SimMan 3G PLUS, from Laerdal Medical, controlled by SimMan 3G software from Laerdal, was used as the signal source and generated synthetic ECG waveforms for predefined heart-rate settings. Recordings were acquired for successive simulator settings while the remaining elements of the setup were kept unchanged.
Data were acquired at a sampling frequency of 128 Hz. The study was performed for four heart-rate settings: 30, 60, 80, and 100 beats per minute (BPM). For each BPM value, a single 30 min simultaneous recording was obtained and subsequently processed using an identical analysis pipeline. Data from both paths were read using a common acquisition unit, transmitted to a computer via a serial interface, and stored digitally for further analysis [13]. It should be emphasized that the two paths differed not only in the applied analog front-end (AFE) device but also in the signal digitization method. In the AD8232 path, the recorded signal remained analog and was sampled by the analog-to-digital converter of the ESP32-WROOM-32E microcontroller. In the MAX30003 path, the signal was digitized internally by the AFE and made available in digital form via the SPI bus.
2.1. Data preprocessing
The collected and processed signals are presented in Figure 2. Each recording contained a common time axis and the corresponding amplitude values for both paths. Data were processed independently for each recording.
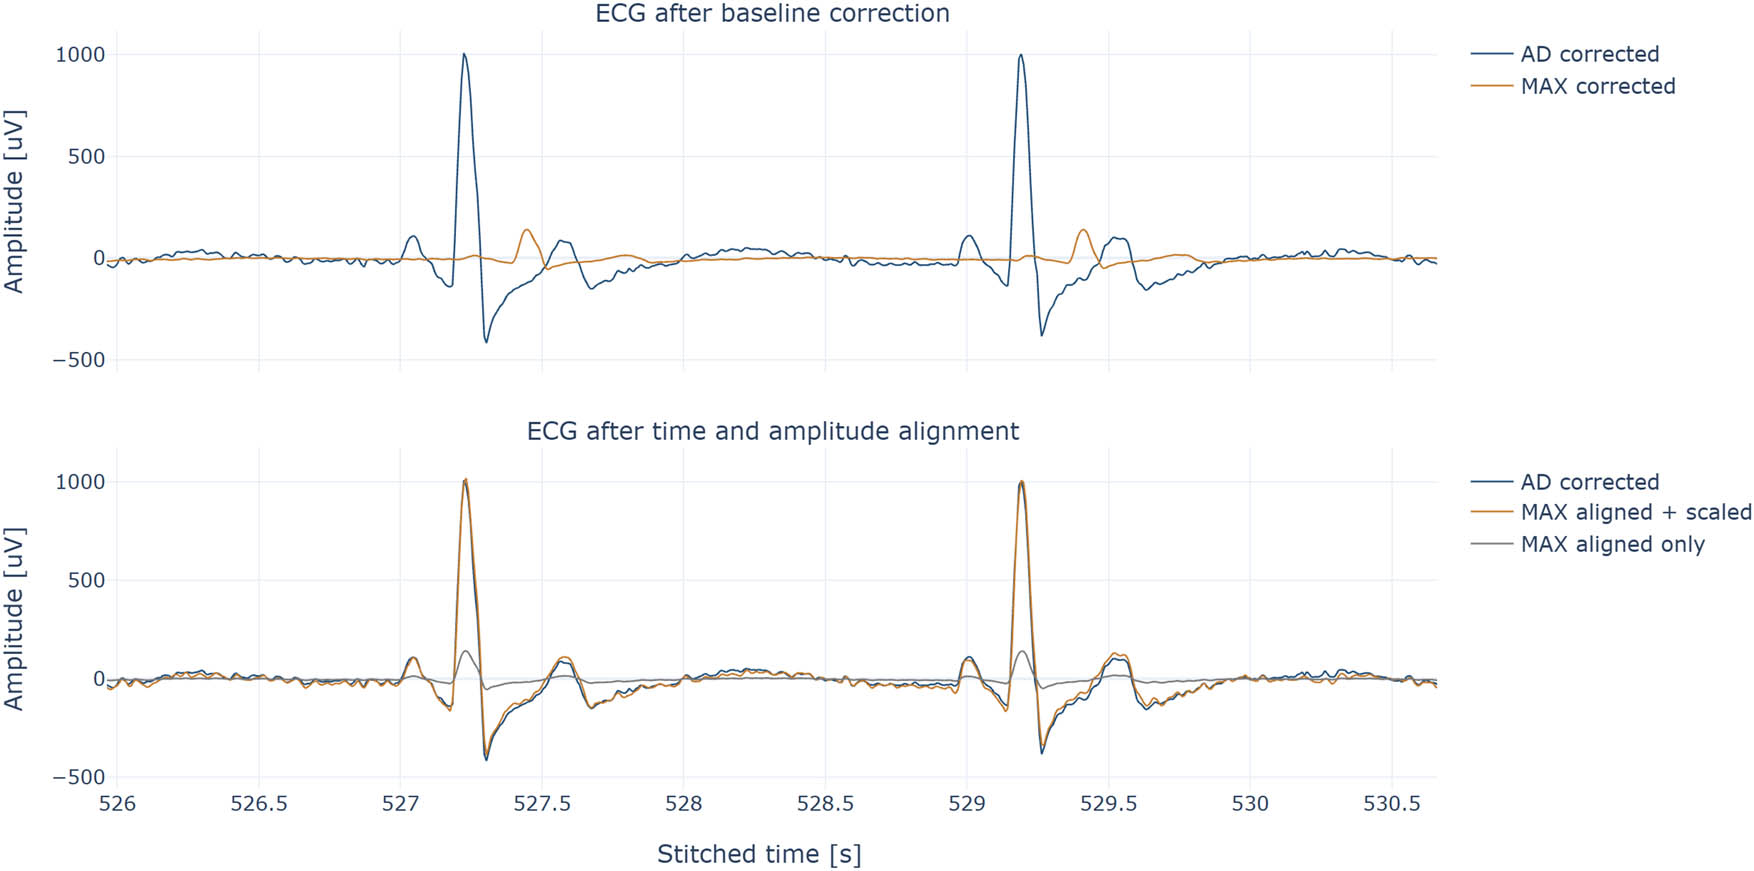
Figure 2
Representative ECG signals acquired from the AD8232- and MAX30003-based paths before and after time alignment and amplitude correction.
In the first stage, time-axis standardization was performed. Samples were sorted chronologically, duplicate timestamps were removed, and records containing missing values in the analyzed channels were discarded. Timestamps were interpreted as values expressed in milliseconds and converted to seconds. Subsequently, the median of the positive differences between consecutive timestamps was calculated, and on this basis, the effective sampling interval used in the downstream processing pipeline was estimated.
The nominal acquisition frequency configured in the hardware/firmware was 128 Hz, corresponding to a theoretical sampling interval of 7.8125 ms. After timestamp standardization, duplicate removal, and use of millisecond-resolution timestamps, the effective median sampling interval in the processed time axis was 0.008 s. Therefore, analyses requiring a uniform sampling frequency were performed using an effective analysis frequency of 125 Hz. Thus, 128 Hz refers to the nominal acquisition setting, whereas 125 Hz refers to the standardized time axis used for signal processing and Power spectral density (PSD) analysis.
2.2. Baseline correction and quality control
For both signal paths, baseline drift was estimated using a second-order low-pass Butterworth filter with a cutoff frequency of 0.5 Hz applied in zero-phase mode. Filtering was performed separately within each continuous signal block. The median and estimated baseline component were then subtracted from the signal, yielding a waveform after isoelectric-line correction.
Quality control was performed at the sample level and subsequently aggregated into 10 s segments, in line with general approaches used in ECG signal-quality assessment [14]. Invalid samples included missing data, low-energy signal fragments, and flatline segments. Low energy was defined on the basis of a centered moving root mean square (RMS) calculated in a 1.0 s window. Samples were marked as invalid if the RMS value fell below 25% of the median moving RMS and this condition persisted for at least 1.0 s. The combined artifact mask was additionally extended by 0.5 s on both sides to reduce the influence of disturbed-segment boundaries on downstream analysis. A 10 s segment was rejected if the proportion of samples marked as invalid exceeded 30% in either of the two paths. Only segments meeting this quality criterion were included in further analysis.
The adopted window lengths and decision thresholds were determined empirically based on signal inspection and the behavior of the processing pipeline in the analyzed recordings while following general ECG signal-quality assessment principles described in the literature [14].
The number of retained and rejected 10 s segments was reported for each BPM setting. Segment rejection was evaluated separately for each acquisition path and also using the combined criterion applied in the analysis, where a segment was retained only if neither path exceeded the 30% invalid-sample threshold.
2.3. Time synchronization
Signal synchronization between the two paths was performed locally within valid 10 s segments. For this purpose, the cross-correlation function was used:
where x(n) and y(n) denote the signals from the AD8232 and MAX30003 paths after baseline correction, n is the sample index, τ denotes the lag expressed in samples, and is the number of sample pairs available for comparison at a given shift.Before the calculation of the correlation, both signals were robustly standardized by subtracting the median and dividing by the median absolute deviation, thereby reducing the influence of local amplitude changes and outliers [15].
For each segment, the lag corresponding to the maximum correlation within a limited range of ±0.5 s was determined. The optimal time shift τ* was defined as
The resulting local lag was used to align the MAX30003 signal with respect to the AD8232 reference signal. The final global shift for the entire recording was defined as the median of local lags obtained from valid segments, rounded to the nearest integer number of samples. This approach improved robustness to local synchronization disturbances and short-term interference.
The cross-correlation search range was set to ±0.5 s. At the highest tested rate of 100 BPM, this corresponds to ±0.83 of the nominal RR interval and may therefore include secondary correlation maxima associated with adjacent beats. To reduce the influence of such local maxima, local lag estimates were summarized using the median across QC-accepted 10 s segments. The resulting global lag was additionally checked against the nominal RR interval for each BPM setting.
The maximum absolute global lag was 200 ms for all BPM settings. Even at 100 BPM, this corresponded to 0.33 RR, below the adjacent-beat displacement. Two local 10 s windows at 100 BPM showed positive lag estimates of 376 ms and 432 ms, consistent with possible secondary cross-correlation maxima; however, these values did not affect the median-based global lag, which remained −200 ms.
2.4. Amplitude alignment
After time alignment, linear amplitude fitting of the MAX30003 signal to the AD8232 signal was performed separately for each valid 10 s segment. A linear model of the form.
was assumed, where x(n) denotes the AD8232 signal and y(n) denotes the MAX30003 signal after time alignment. The coefficients a and b were estimated using the least-squares method and were used to express the locally aligned MAX30003 waveform in the amplitude scale of the AD8232 reference path. This amplitude-aligned representation was retained as an intermediate signal for visualization, local consistency checks, beat extraction, and unnormalized diagnostic comparisons. It should be noted, however, that the subsequent normalized agreement metrics were not intended to assess absolute amplitude equivalence between the two acquisition paths.2.5. R-wave detection and beat-to-beat analysis
R-wave detection was performed independently for both paths using a procedure inspired by the Pan–Tompkins algorithm [16]. In particular, the classical sequence involving filtering, differentiation, squaring, and moving-window averaging was retained, whereas the specific decision thresholds and temporal constraints were adapted to the characteristics of the analyzed synthetic recordings.
Detection thresholds, prominence criteria, the minimum distance between consecutive peaks, and the fiducial-point refinement window were established empirically based on stable algorithm performance in the analyzed recordings.
After subtracting the median within each continuous signal block, the signal was bandpass filtered using a second-order Butterworth filter in the range of 5–18 Hz applied in zero-phase mode. The first difference was then calculated, the resulting signal was squared, and moving averaging was performed in a 150 ms window, corresponding to the classical procedure used to enhance QRS complexes.
Candidate QRS complexes were detected using a threshold-based method. The detection threshold was defined as the sum of the median of the integrated signal and 0.7 standard deviation (SD), whereas the minimum prominence was set to 0.2 SD. The minimum distance between consecutive peaks was 0.35 s. After initial detection, the fiducial point was refined within a ±80 ms window by selecting the point with the maximum absolute amplitude value, allowing for more precise localization of the QRS complex.
For beat-to-beat analysis, signal fragments were extracted in windows from −250 ms to +450 ms relative to the R-wave fiducial point. Edge beats and fragments containing undefined values were excluded. In addition, beats from both paths were paired using a temporal tolerance of ±80 ms. The mean beat was determined as the point-by-point average of all accepted beats within a given path, and the root mean square error (RMSE) between each individual beat and its corresponding mean waveform was then calculated, yielding a measure of morphological repeatability.
Because no independent manual R-wave annotations were available, the QRS detector was validated by comparing the number of detected beats with the expected number derived from the nominal simulator heart rate and the QC-accepted recording duration. In addition, RR intervals were summarized as mean value ± SD and compared with the nominal RR interval for each BPM setting. Intervals crossing rejected QC segments were excluded.
2.6. Signal agreement metrics
Signal agreement was assessed both at the level of complete recordings and locally within valid 10 s segments. In the comparative analysis reported in Table 2 and in the segment-level metric distributions, the signals were evaluated after both preprocessing steps: local time alignment with segment-wise amplitude fitting of the MAX30003 waveform to the AD8232 reference, followed by median/standard-deviation normalization. Thus, the reported Pearson r, mean absolute error (MAE), RMSE, and normalized RMSE (NRMSE) values primarily quantify normalized waveform-shape agreement rather than absolute amplitude agreement. Because the normalization step removes most residual offset and scale differences, the direct contribution of the preceding linear amplitude-fitting step to these normalized metrics is limited.
where med(x) denotes the signal median and denotes its SD within the analyzed segment.Table 2
Segment-level agreement metrics for normalized signals across heart-rate settings
| BPM | N segments | Pearson r median (Q1–Q3) | MAE median (Q1–Q3) | RMSE median (Q1–Q3) | NRMSE median (Q1–Q3) |
|---|---|---|---|---|---|
| 30 | 161 | 0.9924 (0.9893–0.9940) | 0.0893 (0.0839–0.0966) | 0.1306 (0.1178–0.1521) | 0.0156 (0.0140–0.0181) |
| 60 | 177 | 0.9933 (0.9890–0.9957) | 0.0826 (0.0729–0.0933) | 0.1180 (0.0953–0.1503) | 0.0185 (0.0149–0.0234) |
| 80 | 177 | 0.9933 (0.9882–0.9966) | 0.0698 (0.0554–0.0856) | 0.1163 (0.0826–0.1535) | 0.0199 (0.0139–0.0261) |
| 100 | 177 | 0.9925 (0.9861–0.9963) | 0.0704 (0.0552–0.0900) | 0.1203 (0.0869–0.1666) | 0.0218 (0.0156–0.0299) |
The amplitude-fitting step was nevertheless retained to provide a consistent intermediate representation of the MAX30003 signal in the AD8232 reference scale before the final morphology-focused normalization.
The metrics used to assess the agreement were the Pearson correlation coefficient (r), MAE, RMSE, and NRMSE. NRMSE was defined as the ratio of RMSE to the amplitude range of the AD8232 reference signal.
The distributions of segment-level metrics were described using the median and the interquartile range (IQR), reducing the influence of outliers and enabling the assessment of temporal variability in signal quality [17].
At the stage of constructing the final time-domain representation for comparative analyzes, discarded fragments were additionally extended to the nearest boundaries defined by consecutive R waves. This preserved the morphological integrity of individual beats and avoided cutting QRS complexes at the boundaries of removed sections.
2.7. PSD and bandpower analysis
PSD was estimated using a procedure equivalent to Welch’s method [18]. PSD and bandpower analyses were performed on the final processed time axis, for which the interval between consecutive samples was 0.008 s, corresponding to an analysis frequency of fs = 125 Hz. This value should be distinguished from the nominal hardware acquisition frequency of 128 Hz. PSD and bandpower analyses were performed on the standardized processed time axis, for which the effective sampling interval was 0.008 s, corresponding to fs = 125 Hz. This value differs from the nominal firmware acquisition setting of 128 Hz and was used consistently in all frequency-domain analyses.
PSD estimation was performed on QC-accepted continuous signal blocks. Segments rejected by the QC procedure were not interpolated, instead, they were omitted by dividing the signal into accepted continuous blocks. Segments of 4,096 samples, 50% overlap, a Hann window [19], mean removal from each segment, nfft = 4,096, and one-sided power-density scaling were used. A single segment therefore corresponded to 32.768 s, and the frequency resolution was 0.03052 Hz. The 4,096-sample segment length was adopted as a compromise between frequency resolution and the number of windows available for averaging after quality control. The resolution of 0.03052 Hz enabled stable power integration in narrow and low-frequency bands, particularly 0.00–0.30 Hz and 49.00–51.00 Hz. At 30 BPM, a single Welch segment included approximately 16.38 cardiac cycles, whereas at 100 BPM, it included approximately 54.61 cycles. Thus, for the lowest rhythm setting, the number of cardiac cycles within a single window was lower than in the other conditions, which should be treated as a limitation of the spectral interpretation for 30 BPM.
The Welch estimator can be expressed as
where Ŝxx(f) denotes the estimated PSD of signal x(n), Pk (f) is the periodogram calculated for the kth segment, and K denotes the number of segments included in the averaging process [18].Signal power in a given frequency band [f 1, f 2] was determined by numerical integration of the estimated PSD:
where [f 1, f 2] denotes the signal power in the frequency band from f 1 to f 2.Because of the substantial difference in amplitude scale between the two measurement paths, the analysis was not limited to a comparison of absolute power alone. In addition to the values of PLF, power in the useful ECG band (0.50–40.00 Hz) (PECG), P50Hz, and PHF, which denote the power of the low-frequency components, useful ECG-related spectral content, the spectral component associated with power-line interference, and high-frequency components, respectively, relative indices normalized to the power in the useful ECG band were also determined.
where denotes the power in the 0.00–0.30 Hz band, denotes the power in the useful ECG band of 0.50–40.00 Hz, P50 Hz denotes the power in the 49.00–51.00 Hz band corresponding to power-line interference, and P HF denotes the power in the 40.00–60.00 Hz band. In the present study, P HF was treated as a descriptive measure of energy in the upper part of the analyzed spectrum rather than as a direct measure of the intrinsic high-frequency noise of the AFE devices. Because the two acquisition paths were not matched in terms of filtering, HFratio was treated only as an auxiliary descriptive index of residual upper-band spectral energy in the implemented acquisition chains. It was not used to infer intrinsic high-frequency noise of the AFE devices or to support device-level superiority.The 0.50–40.00 Hz band was adopted as the useful ECG signal range for comparing the spectral quality of the two paths. This range includes the dominant part of the PQRST morphology energy, although it should not be equated with the full diagnostic bandwidth recommended for standard clinical ECG systems [4]. The 0.00–0.30 Hz range was treated as an indicator of low-frequency components and baseline drift. The 49.00–51.00 Hz band was adopted as an indicator of power-line interference, which constitutes one of the principal problems in ECG signal acquisition [20,21]. The 40.00–60.00 Hz band was retained as a descriptive index of energy in the upper part of the analyzed spectrum. Because its upper boundary is close to the Nyquist frequency of the PSD analysis, this index was interpreted descriptively rather than as a direct measure of intrinsic high-frequency noise [22].
The detected beat counts were highly consistent with the values expected from the nominal simulator rates over QC-accepted signal duration. The relative deviation between detected and expected beat counts ranged from −0.13% to +0.21% across all BPM settings and both acquisition paths. The mean RR intervals also closely matched the nominal RR intervals, confirming that missed or additional detections did not materially affect the beat-to-beat morphology and mean-beat analyses (Table 3).
Table 3
QRS detection and RR-interval consistency across heart-rate settings
| BPM | QC-valid duration (s) | Expected beats | AD8232 detected | AD8232 RR (ms) | MAX30003 detected | MAX30003 RR (ms) | Nominal RR (ms) |
|---|---|---|---|---|---|---|---|
| 30 | 1609.88 | 804.9 | 806 | 1998.35 ± 30.81 | 806 | 1998.26 ± 30.95 | 2,000 |
| 60 | 1769.88 | 1769.9 | 1,768 | 1001.28 ± 16.70 | 1,769 | 1001.24 ± 16.60 | 1,000 |
| 80 | 1764.88 | 2353.2 | 2,351 | 750.14 ± 14.03 | 2,350 | 750.10 ± 14.05 | 750 |
| 100 | 1769.88 | 2949.8 | 2,954 | 598.92 ± 11.49 | 2,956 | 598.90 ± 11.46 | 600 |
3. Results
Across all four heart-rate settings, the time-domain metrics indicated a very high similarity between the preprocessed signals recorded from the two acquisition paths (Table 4). Pearson correlation ranged from 0.990 to 0.992, with a mean value of 0.991 ± 0.001. The corresponding MAE, RMSE, and NRMSE values remained low across all recordings.
Table 4
Summary similarity metrics of normalized signals for individual recordings and mean value ± SD across BPM values
| Metric | 30 BPM | 60 BPM | 80 BPM | 100 BPM | Mean value ± SD |
|---|---|---|---|---|---|
| Pearson r | 0.991 | 0.992 | 0.992 | 0.990 | 0.991 ± 0.001 |
| MAE | 0.091 | 0.084 | 0.071 | 0.075 | 0.080 ± 0.009 |
| RMSE | 0.140 | 0.129 | 0.127 | 0.138 | 0.134 ± 0.006 |
| NRMSE | 0.016 | 0.019 | 0.020 | 0.023 | 0.020 ± 0.003 |
To complement the time-domain analysis and assess signal quality in the frequency domain, PSD and bandpower analyses were performed on signals after isoelectric-line correction and before amplitude normalization.
The QC procedure retained 161 segments for the 30 BPM recording, 177 segments for 60 BPM, 176 segments for 80 BPM, and 177 segments for 100 BPM. Only one segment was rejected in the 80 BPM recording because it was too short. After QC and block-wise Welch estimation, the effective number of Welch averages was 92 for 30 BPM, 105 for 60 BPM, 104 for 80 BPM, and 105 for 100 BPM in both acquisition paths, indicating comparable spectral-estimation support across conditions after QC (Table 5).
Table 5
Quality-control summary and number of Welch segments retained for spectral analysis
| BPM | Total 10 s segments | AD retained/rejected | MAX retained/rejected | Combined retained/rejected | Retained (%) | Effective duration (s) | Welch segments AD/MAX |
|---|---|---|---|---|---|---|---|
| 30 | 161 | 161/0 | 161/0 | 161/0 | 100.0 | 1603.57 | 92/92 |
| 60 | 177 | 177/0 | 177/0 | 177/0 | 100.0 | 1768.94 | 105/105 |
| 80 | 177 | 176/1 | 176/1 | 176/1 | 99.4 | 1756.04 | 104/104 |
| 100 | 177 | 177/0 | 177/0 | 177/0 | 100.0 | 1768.49 | 105/105 |
Segment-level distributions of agreement metrics are presented in Figure 3 and summarized in Table 2. Across QC-accepted 10 s segments, Pearson correlation remained consistently high, with median values from 0.9924 to 0.9933. The segment-level error metrics showed limited temporal variability, although the IQR increased slightly at higher BPM settings, particularly for RMSE and NRMSE. These results indicate that the high full-recording agreement reported in Table 4 was not driven by isolated portions of the recordings but was maintained across the analyzed segments.
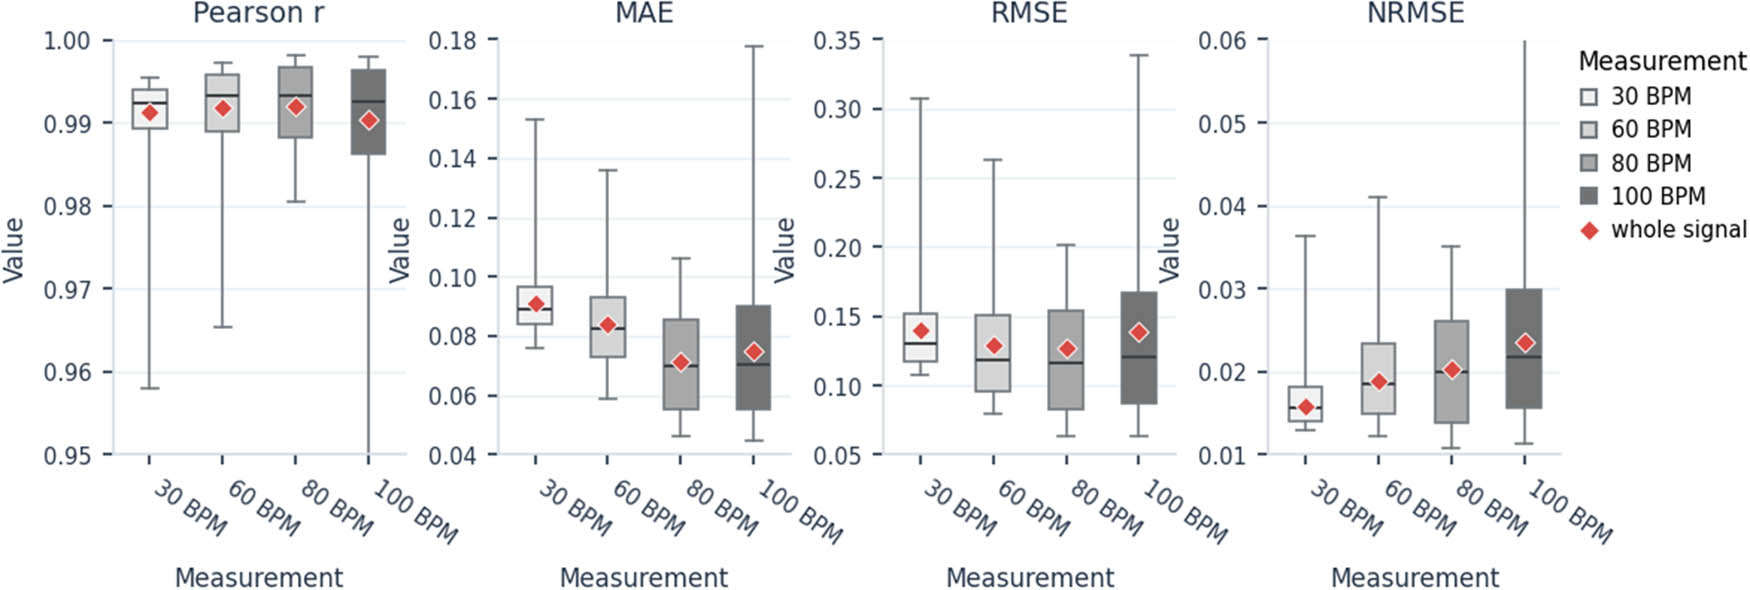
Figure 3
Segment-level distributions of Pearson correlation, MAE, RMSE, and NRMSE calculated for QC-accepted 10 s segments for the AD8232–MAX30003 comparison at each BPM setting.
Representative power spectra estimated using Welch’s method for both acquisition paths are shown in Figure 4. The presented spectrum indicates a distinct local increase in power near 50 Hz for the AD8232 path, which was interpreted as a power-line interference component. In the MAX30003-based path, the analogous component was lower under the applied implementation conditions, consistent with the lower values of the PLIratio index.
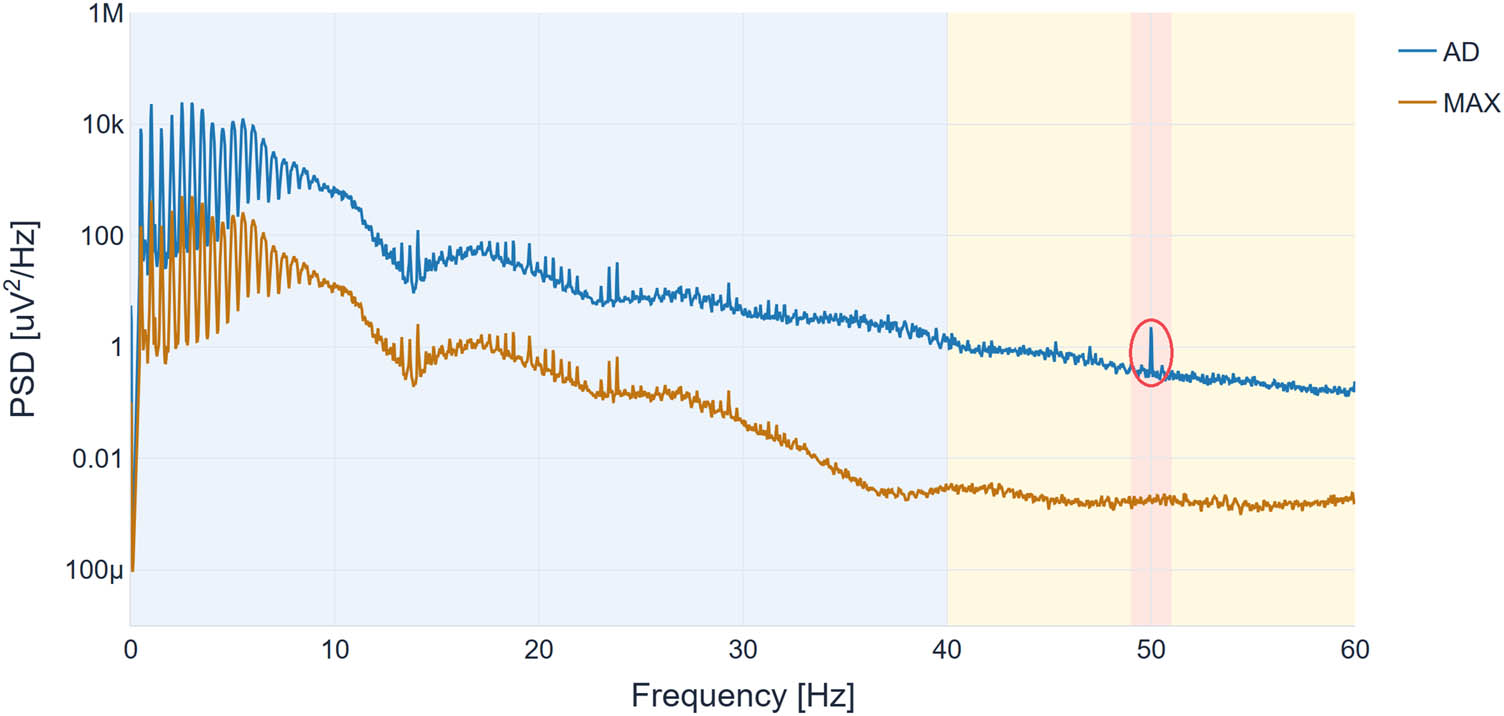
Figure 4
Welch PSD estimated for signals acquired at 30 BPM from the AD8232- and MAX30003-based acquisition paths after baseline correction and before amplitude normalization. The arrow marks a local increase in power near 50 Hz, consistent with power-line interference.
The indices defined in this manner enabled comparison of the spectral-energy distribution of both paths independent of absolute signal amplitude.
Absolute bandpower values for all analyzed heart-rate settings, i.e., 30, 60, 80, and 100 BPM, are summarized in Table 6. For illustrative purposes, absolute bandpower components for the 30 BPM recording are shown in Figure 5. A comparison of the relative PLIratio and auxiliary HFratio indices is shown in Figure 6.
Table 6
Absolute and relative bandpower values for the AD8232 and MAX30003 acquisition paths
| BPM | Path | P LF (µV²) | P ECG (µV²) | P 50Hz (µV²) | P HF (µV²) | LFratio (%) | PLIratio (%) | HFratio (%) |
|---|---|---|---|---|---|---|---|---|
| 30 | AD8232 | 0.17300 | 29000 | 0.79900 | 9.67000 | 0.000595 | 0.00275 | 0.03330 |
| 30 | MAX30003 | 0.00387 | 591 | 0.00355 | 0.03710 | 0.000656 | 0.000600 | 0.00627 |
| 60 | AD8232 | 0.21600 | 49500 | 1.40000 | 20.6000 | 0.000436 | 0.00282 | 0.04170 |
| 60 | MAX30003 | 0.00495 | 1020 | 0.00461 | 0.05530 | 0.000487 | 0.000454 | 0.00545 |
| 80 | AD8232 | 0.20900 | 58900 | 2.69000 | 27.8000 | 0.000354 | 0.00457 | 0.04710 |
| 80 | MAX30003 | 0.00423 | 1170 | 0.00545 | 0.06120 | 0.000360 | 0.000465 | 0.00522 |
| 100 | AD8232 | 0.12800 | 65200 | 2.99000 | 41.5000 | 0.000196 | 0.00458 | 0.06370 |
| 100 | MAX30003 | 0.00406 | 1320 | 0.00648 | 0.07650 | 0.000307 | 0.000491 | 0.00579 |
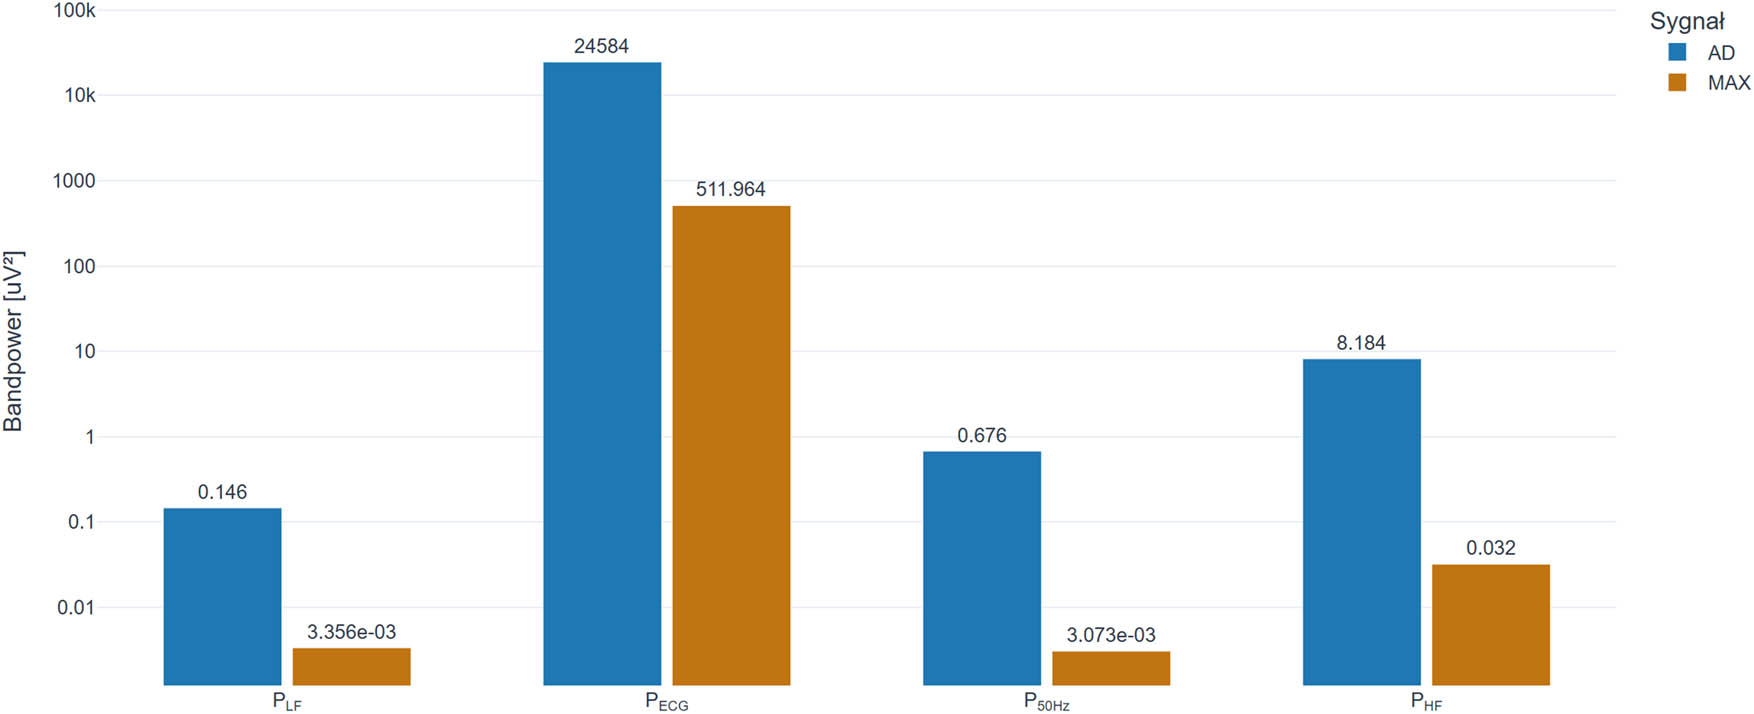
Figure 5
Absolute bandpower components for the AD8232- and MAX30003-based acquisition paths at 30 BPM.
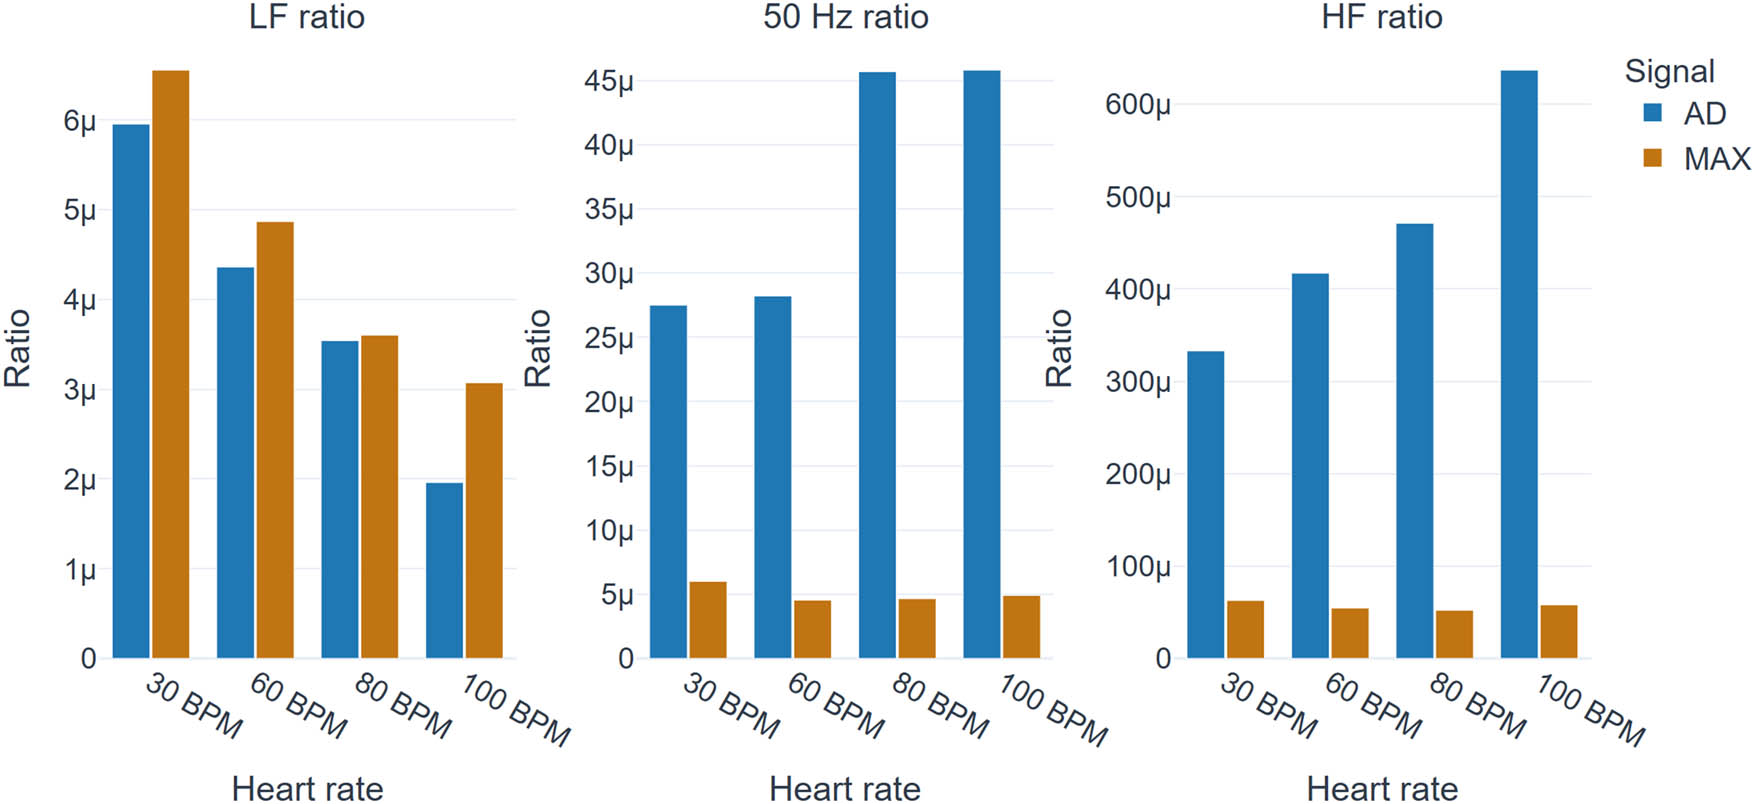
Figure 6
Comparison of relative spectral indices for the analyzed signals, including LFratio, 50 Hz ratio, and HFratio.
The values of remained very low in both paths. For AD8232, they ranged from 0.000196% to 0.000595%, whereas for MAX30003 they ranged from 0.000307% to 0.000656% of the power in the useful ECG band.
More pronounced differentiation was observed for the index, which describes the relative contribution of the 50 Hz power-line component. For AD8232, its values ranged from 0.0028% to 0.0046%, whereas for MAX30003, they ranged from 0.0005% to 0.0006% of the power in the useful ECG band.
Differences were also observed for the auxiliary HFratio index. For the AD8232 path, its values increased from 0.0334% at 30 BPM to 0.0637% at 100 BPM, whereas for the MAX30003 path, they remained within the range of 0.0052–0.0063% of the power in the useful ECG band. Because this index refers to the 40–60 Hz band, which lies close to the Nyquist frequency of the final PSD analysis and is affected by different filtering and digitization architectures, it was interpreted only as a descriptive implementation-level indicator of residual upper-band energy.
After time synchronization, linear amplitude alignment, and median-centered amplitude standardization, morphological agreement between the two signals was assessed using the Pearson correlation coefficient (r), which quantifies waveform-shape similarity, as well as the error metrics MAE, RMSE, and NRMSE.
The MAE was calculated as a measure of the average absolute difference between corresponding samples of the two signals. As a complementary metric, RMSE was used, as it is more sensitive to larger local deviations between the waveforms. To enable comparison between measurements with different amplitude ranges, NRMSE was also calculated by relating RMSE to the amplitude range of the AD8232 reference signal. For each recording, the metrics were calculated independently and then aggregated into a summary comparison covering all analyzed heart-rate values, as presented in Figure 7.
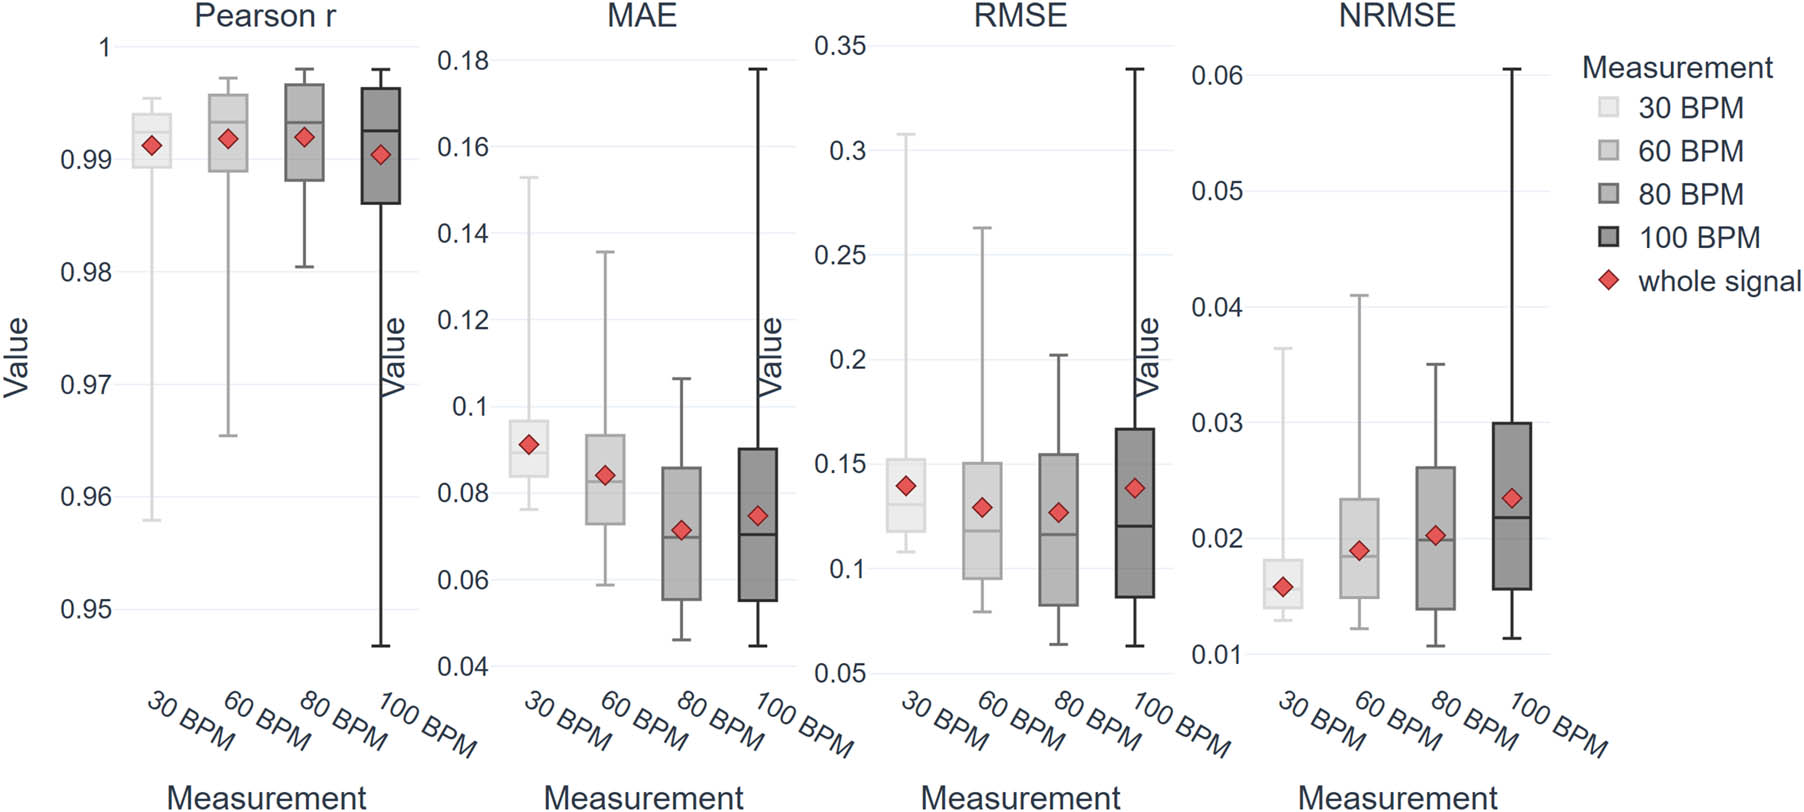
Figure 7
Comparison of Pearson correlation, MAE, RMSE, and NRMSE for time-aligned and normalized signals across all analyzed heart-rate settings.
Figure 8 shows an overlay of individual beats and the corresponding mean beat for both normalized signals from the acquisition paths. In both cases, the beats were aligned with respect to the R wave and spanned the interval from approximately −250 ms to +450 ms relative to the reference point [23]. The mean PQRST complex, determined as the point-by-point average, is superimposed on the semi-transparent waveforms.
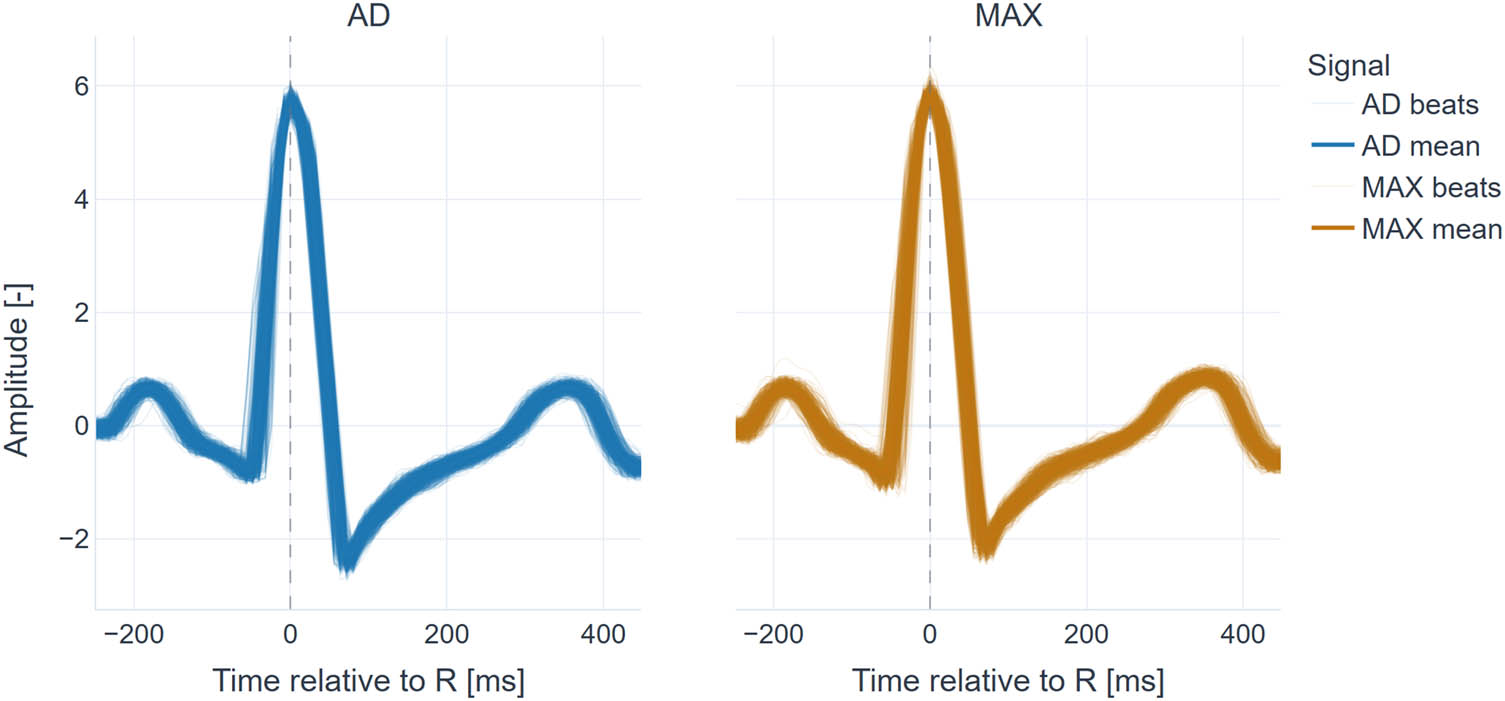
Figure 8
Overlay of individual R-aligned beats and the corresponding mean beat for the AD8232-based path (left) and the MAX30003-based path (right) for the 30 BPM recording.
The distribution of beats around the mean waveform indicates limited variability in both amplitude and duration of the individual components of the PQRST complex. Based on the deviations of individual beats from the mean waveform (Figure 8), mean RMSE values between individual beats and the mean beat were calculated and are presented in Figure 9. These values were determined separately for both acquisition paths and heart-rate settings, yielding descriptive statistics of signal repeatability within a single cardiac cycle.
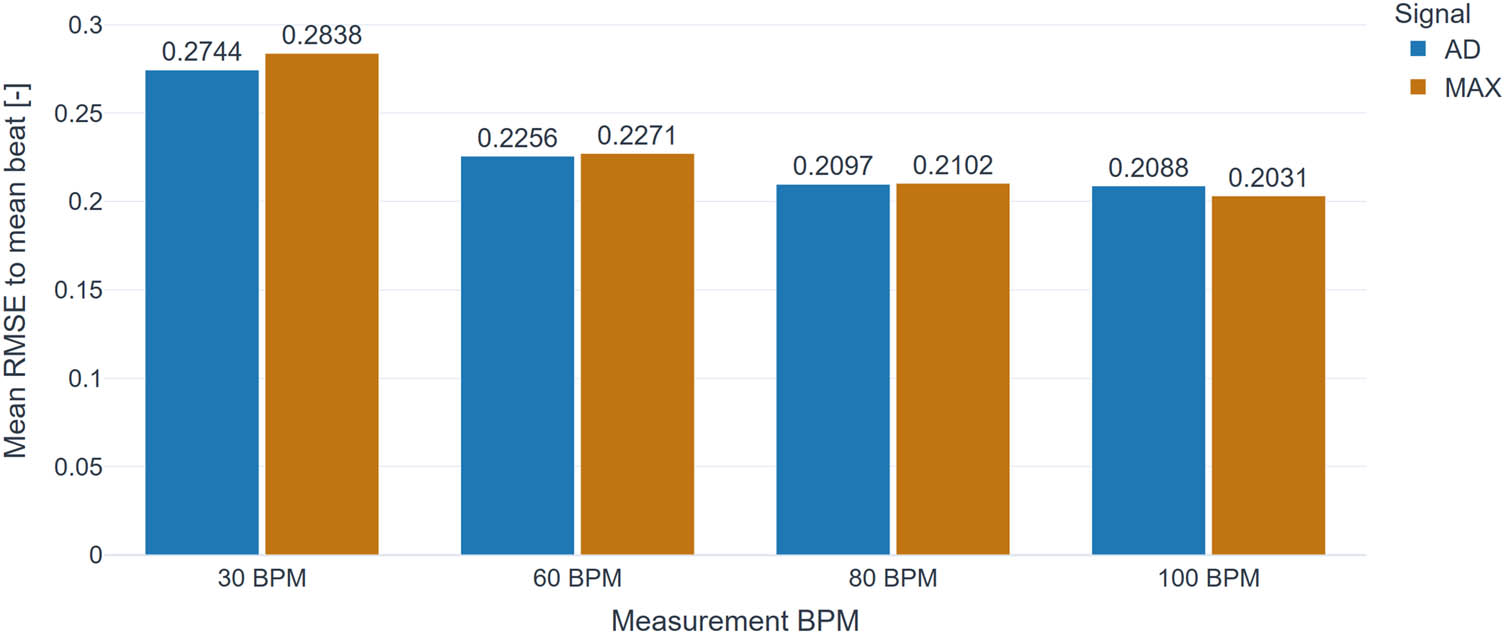
Figure 9
Beat-to-beat repeatability expressed as mean RMSE between individual beats and the corresponding mean beat for both acquisition paths.
4. Discussion
The obtained Pearson correlation coefficients exceeding 0.99 indicate very high morphological agreement between the two signals after preprocessing (Figure 7). However, these values should be interpreted in the context of the experimental and analytical design. Both acquisition paths recorded the same synthetic ECG waveform from a common physical source, and the signals were subsequently baseline-corrected, synchronized, amplitude-aligned, and normalized. Therefore, a high value of Pearson r is partly expected after the applied processing pipeline and should not be interpreted as evidence of raw-signal equivalence, absolute amplitude agreement, or full interchangeability of the two hardware paths.
The MAE and RMSE values similarly describe residual differences between post-processed normalized waveforms. Because the normalization step reduces the influence of absolute scale and offset, these metrics primarily reflect waveform-shape agreement rather than absolute voltage agreement. They support high morphological agreement under controlled synthetic conditions, but they do not quantify measurement uncertainty or between-session reproducibility.
At the level of individual beats, the overlaid waveforms shown in Figure 8 demonstrate a high degree of consistency in PQRST morphology and limited dispersion around the mean complex [23]. The observed beat-to-beat variability was low in both paths. The mean RMSE values of 0.2744 for AD8232 and 0.2838 for MAX30003 were calculated after median/standard-deviation normalization of the extracted beats, therefore, they are dimensionless and expressed in normalized SD units rather than in µV. In practical terms, these values indicate that individual beats deviated from the corresponding mean beat by approximately 0.27–0.28 normalized SDs on average. This level of variability supports technical repeatability of the recorded morphology under the tested simulator conditions, but it should not be interpreted as a clinical diagnostic threshold. This interpretation is consistent with the quantitative repeatability analysis shown in Figure 9, where the RMSE between individual beats and the mean beat remained comparable for both paths [17].
Direct numerical comparison with the literature is limited because beat-to-template variability metrics depend strongly on preprocessing, normalization, window length, and the selected ECG lead. Nevertheless, template- or mean-beat-based morphology comparison is commonly used in ECG signal-quality and beat-classification studies, where high similarity between individual beats and an average/template beat is treated as evidence of stable morphology. In this context, the low normalized RMSE values observed here are consistent with technically stable ECG recordings of comparable quality.
Spectral analysis based on Welch PSD estimation revealed differences between the compared paths both in terms of absolute power level and in the frequency-domain distribution of signal energy. In the useful ECG band, the PECG values for the AD8232 path ranged from 29054.26 to 65229.55 µV², whereas for the MAX30003 path, they ranged from 591.15 to 1320.68 µV². Thus, across the entire analyzed heart-rate range, the power in the useful ECG band was approximately 48.7–50.2 times higher for AD8232 than for MAX30003. However, this difference alone does not provide a sufficient basis for signal-quality assessment because the comparison involved complete acquisition paths differing not only in the front-end circuit but also in the digitization method.
Consequently, absolute power values primarily reflect the properties of the entire measurement chain, including its amplitude scaling. For this reason, no additional amplitude scaling was introduced before spectral analysis, since the aim was to preserve information about the actual signal-energy level generated by each path. Linear normalization of the entire waveform would not alter relative indices such as LFratio, PLIratio, or HFratio, but it would preclude interpretation of absolute power as a system-level property of the complete acquisition path. Local normalization performed independently for shorter segments, in turn, could artificially equalize the energy of signals with different amplitudes and thereby partially obscure the actual differences between the compared paths.
Accordingly, the main interpretation was based on relative indices. Even so, these metrics should be interpreted with caution because they depend both on the energy present in the analyzed band and on the distribution of energy in the reference band [24]. The values of LFratio remained very low in both paths. This indicates that after isoelectric-line correction, low-frequency components did not constitute a dominant part of the spectrum. This observation is consistent with the assumptions of the experiment, which was conducted under controlled conditions using a synthetic signal source, as described in Section 2.
PLIratio indicated differences between the examined paths in the relative contribution of the 50 Hz component. Depending on the BPM setting, the relative contribution of this component was 78.6–89.1% lower in the MAX30003 path than in the AD8232 path. This result is relevant for the technical characterization of the implemented acquisition paths, since power-line interference is a well-documented source of ECG signal degradation [20].
However, this finding must be interpreted in the context of the different electrode configurations and common-mode rejection mechanisms used in the two paths. The AD8232 path operated in a three-electrode RA/LA/RL configuration with an active RLD circuit, whereas the MAX30003 path operated in a two-electrode ECGP/ECGN configuration without an external RLD electrode. The AD8232 documentation describes the RLD amplifier as a circuit that senses the common-mode voltage at the instrumentation-amplifier inputs and drives an opposing signal back to the subject, thereby improving system-level common-mode rejection. For the typical RLD configuration, the AD8232 datasheet reports approximately 26 dB of loop gain available in the 50–60 Hz range for common-mode line rejection [7]. Therefore, the AD8232 path cannot be treated as architecturally equivalent to a two-electrode acquisition path without active common-mode feedback.
The role of RLD feedback in reducing common-mode voltage is also consistent with classical ECG front-end design literature, where DRL circuits are used to reduce common-mode interference in biopotential differential amplifiers [25]. Application-level ECG front-end studies further show that RLD feedback can substantially affect the 50/60 Hz component and the effective common-mode rejection of the complete measurement system [26].
Consequently, the lower PLIratio observed in the MAX30003 path should not be interpreted as direct evidence that the MAX30003 integrated circuit is intrinsically more resistant to power-line interference than the AD8232. The result should instead be interpreted as an implementation-level observation for two complete acquisition paths that differed in electrode configuration, signal referencing, input biasing, filtering, ADC architecture, and digital readout. Because both paths were not tested under an identical electrode/reference configuration, the present experiment does not allow the contribution of the AFE device itself to be separated from the contribution of the electrode configuration and common-mode rejection strategy. A dedicated follow-up experiment using matched electrode configurations would be required to isolate these effects.
Interpretation of HFratio requires particular caution. In the final PSD analysis, the sampling frequency was 125 Hz, corresponding to a Nyquist frequency of 62.5 Hz. Although the 40.00–60.00 Hz band formally lies below this limit, its upper part is close to the Nyquist frequency. In addition, the two acquisition paths differed in filtering and digitization architecture. The AD8232 path used an analog low-pass characteristic of approximately 40 Hz, after which the signal was sampled by the ESP32 microcontroller ADC. The MAX30003 path used internal digitization and digital filtering. In the applied MAX30003 configuration, CNFG_ECG = 0 × 805000 and DLPF[1:0] = 01 correspond to an effective low-pass cutoff frequency of approximately 28.35 Hz at 128 sps. Consequently, the lower HFratio observed in the MAX30003 path should be interpreted as an implementation-level difference in upper-band spectral energy between complete acquisition paths, not as a direct measure of intrinsic high-frequency noise or as evidence of general superiority of the MAX30003 device [20,22]. For this reason, HFratio was not used as a primary endpoint of the study and was not used to formulate conclusions regarding intrinsic high-frequency noise performance.
It should also be emphasized that the 0.50–40.00 Hz range was adopted here as a practical and useful band for spectral-quality comparison, rather than as the full diagnostic bandwidth of standard clinical ECG [4]. Nevertheless, this type of spectral partitioning is commonly used in ECG signal-quality studies, where the 0.5–40 Hz range is treated as containing the dominant signal energy, whereas the ranges below and above it serve as indicators of baseline drift and high-frequency components, respectively [22]. Accordingly, the present findings should be interpreted as a system-level evaluation of two specific ECG acquisition-path implementations rather than as a universal characterization of the AD8232 and MAX30003 circuits themselves.
A limitation of this study is that only one 30 min simultaneous recording was acquired for each heart-rate setting. Therefore, the results do not allow assessment of variability between independent repeated recordings performed under the same nominal simulator conditions. The segment-level IQR values reported in Table 2 and Figure 3 should be interpreted only as within-recording variability across QC-accepted 10 s segments, not as measurement uncertainty.
The present results provide a basis for further, more comprehensive studies on the properties of the compared ECG acquisition paths. A natural next step would be to extend the analysis to conditions more closely resembling real-world use, particularly to measurements involving human subjects. This would allow factors absent in phantom-based studies to be considered, including long-term signal-quality variability, motion artifacts, and changes in the skin–electrode interface [3,27,28]. Such validation would make it possible to determine whether the observed agreement between the two paths is maintained outside the controlled environment.
Another important direction would be to broaden the range of analyzed signal scenarios. In particular, it would be valuable to include synthetic waveforms with more diverse morphology, with selected arrhythmias, changes in waveform-component amplitude and duration, and modeled interference [10,11,29,30]. This would enable a more detailed assessment of the robustness of both paths to changes in signal characteristics and would help determine to what extent structural differences between them affect recording quality under non-ideal conditions.
A further methodological extension would be to separate the influence of the front-end itself from that of the remaining elements of the complete acquisition path. In the present study, complete measurement paths were compared in their implemented form, including the input circuit, digitization method, and data-readout strategy. Future work should therefore consider an experiment designed to isolate more precisely the contributions of the AFE, analog-to-digital converter, transmission interface, and software layer [7,8,31,32]. Such an approach would allow for more specific attribution of the observed temporal and spectral differences.
From the standpoint of practical deployment, it would also be worthwhile to complement the analysis with evaluation of system-level parameters such as power consumption, long-term stability, susceptibility to sample loss, hardware integration complexity, and computational requirements associated with the operation of the individual circuits [2,32]. In mobile and wearable systems, these factors can be as important as the quality of the recorded waveform itself.
Finally, future studies would benefit from linking signal quality to the performance of higher-level algorithms. This applies in particular to R-wave detection, heart-rate estimation, heart-rate-variability analysis, and automatic extraction of selected morphological features [33–36]. Such an approach would enable a transition from a strictly technical comparison to a functional assessment of the practical usefulness of both paths in ECG monitoring systems.
5. Conclusion
The present study showed that, under controlled laboratory conditions, both implemented ECG acquisition paths based on AD8232 and MAX30003 exhibited very high morphological agreement after preprocessing. After time synchronization, amplitude alignment, and normalization, both paths preserved a highly similar PQRST morphology.
At the same time, spectral analysis showed differences in the energy distribution between the examined measurement paths. The MAX30003 path was characterized by lower relative power in the analyzed 49–51 Hz band under the applied acquisition and filtering configuration. Differences in the 40–60 Hz band were retained only as auxiliary descriptive observations of residual upper-band energy and were not interpreted as direct evidence of lower intrinsic high-frequency noise. These findings should be interpreted as implementation-specific observations dependent on electrode configuration, filtering, ADC architecture, and digitization, rather than as evidence of the general superiority of one AFE device over the other.
The obtained findings should therefore be treated as a technical assessment of two specific ECG acquisition-path implementations under synthetic conditions rather than as a basis for clinical conclusions or broad generalizations regarding practical applications. Further work should include validation using real recordings, incorporation of motion artifacts and physiological variability, and evaluation of the impact of signal quality on the performance of higher-level algorithms.
Acknowledgments
The authors would like to thank Jarosław Sowizdraniuk and Dariusz Hadaś from the Medical Simulation Center, Faculty of Medicine, Wrocław University of Science and Technology, for providing access to the phantom used for the measurements conducted in this study.
Funding information
The authors received no specific funding for this work.
Author contributions
F.G.: Conceptualization, Methodology, Hardware development, Software, Investigation, Formal analysis, Visualization, Writing – original draft. M.K.: Investigation, Hardware development, Software, Validation, Formal analysis, Writing – original draft. P.K.: Methodology, Supervision, Validation, Writing – review and editing. All authors have read and approved the final manuscript.
Conflict of interest statement
Authors state no conflict of interest.
Data availability statement
The source code used for signal preprocessing, synchronization, QRS detection, time-domain analysis, and spectral analysis, together with the data required to reproduce the results, is available in the archived repository: F. Gajdzik, M. Kimbar, and P. Krowicki, Comparative assessment of AD8232- and MAX30003-based ECG acquisition paths using synthetic ECG signals, Zenodo, 2026. https://doi.org/10.5281/zenodo.19616341. The development version of the repository is available at: https://github.com/Gajdzik-F/ecg-compare-MAX-AD.