
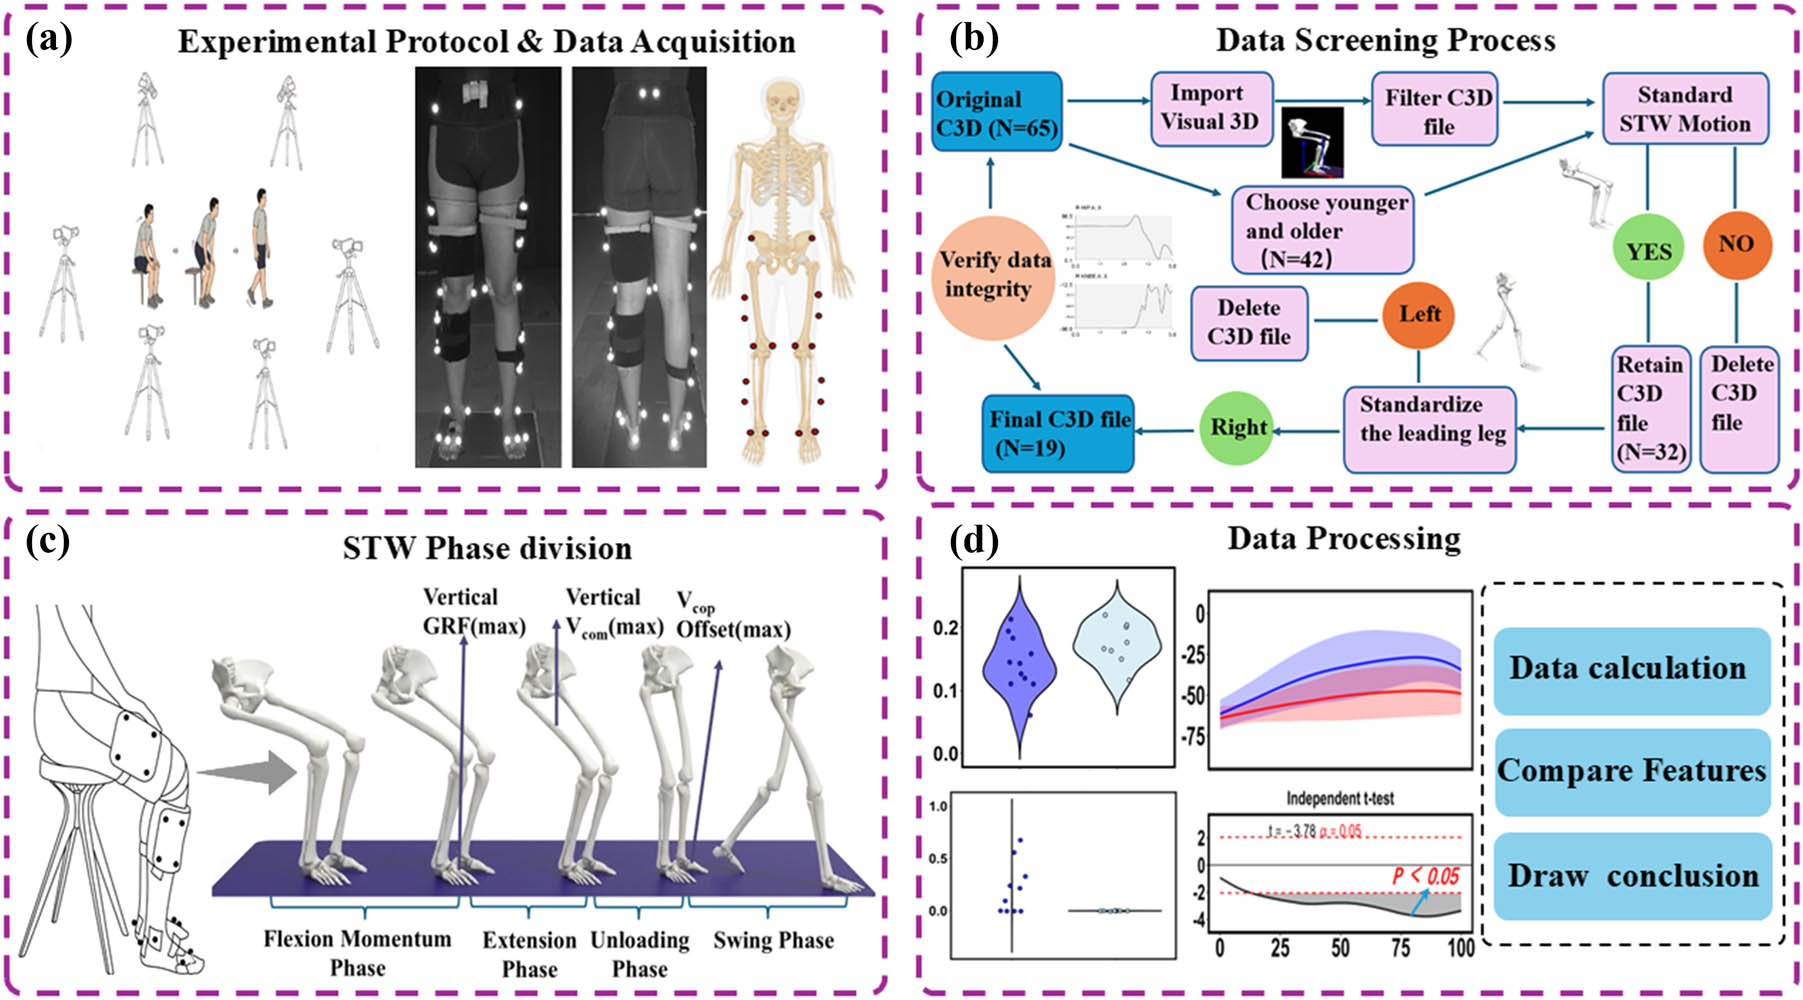
Figure 1
Flowchart of the research protocol. (a) Acquisition of research data; (b) screening of the raw data; (c) segmentation of the STW phases; (d) processing of kinematic and kinetic data.
Table 1
Participant characteristics
| Participant characteristics | Young adults (n = 11) | Older adults (n = 8) |
|---|---|---|
| Sex (male/female) | 8/3 | 6/2 |
| Age (years) | 24.36 ± 4.70 | 62.88 ± 4.94 |
| Height (m) | 1.68 ± 0.09 | 1.59 ± 0.06 |
| Weight (kg) | 68.86 ± 22.97 | 62.36 ± 11.03 |
| BMI (kg/m2) | 23.88 ± 6.48 | 24.65 ± 3.37 |
| Leg length (m) | 0.82 ± 0.04 | 0.76 ± 0.04 |
Note: The values are presented as the mean ± SD.
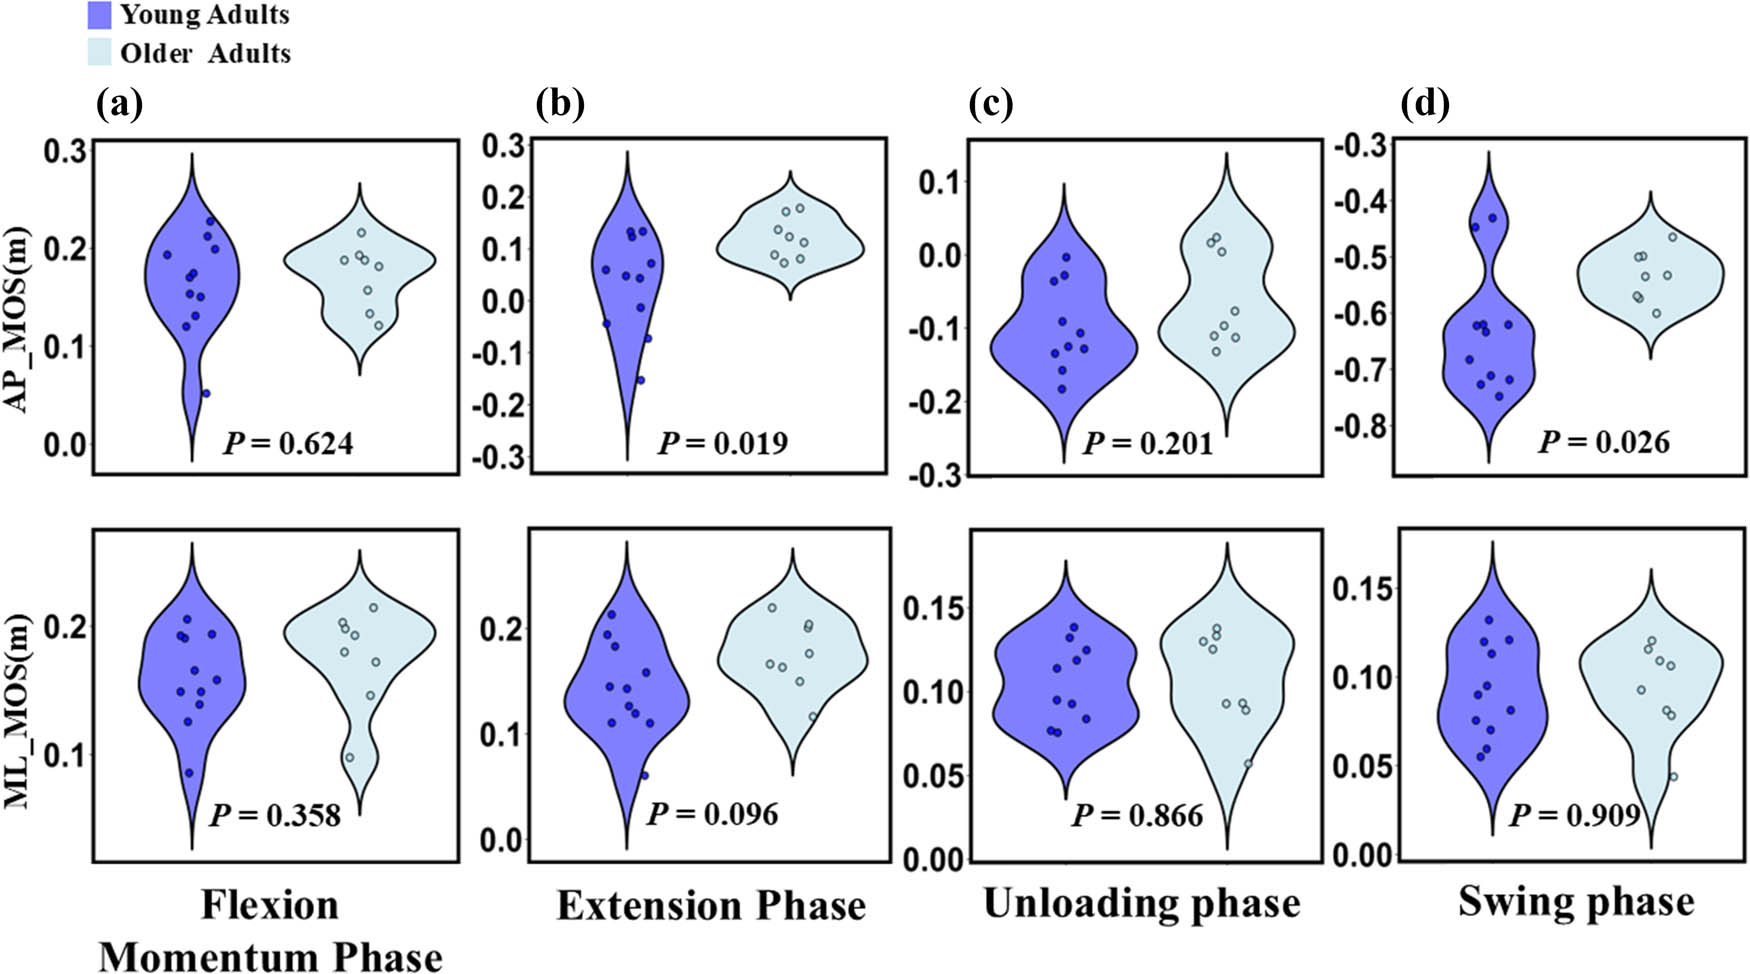
Figure 2
The AP MOS and ML MOS for both cohorts. (a) Flexion momentum phase; (b) extension phase; (c) unloading phase; (d) swing phase.
Table 2
MOS details
| MOS (m) | Phase | Young adults | Older adults |
|---|---|---|---|
| AP MOS | Flexion momentum phase | 0.0160 ± 0.052 | 0.187 ± 0.038 |
| Extension phase | 0.030 ± 0.092 | 0.040 ± 0.014 | |
| Unloading phase | −0.095 ± 0.060 | −0.057 ± 0.025 | |
| Swing phase | −0.63 ± 0.107 | −0.525 ± 0.040 | |
| ML MOS | Flexion momentum phase | 0.157 ± 0.037 | 0.175 ± 0.037 |
| Extension phase | 0.044 ± 0.013 | 0.033 ± 0.011 | |
| Unloading phase | 0.101 ± 0.023 | 0.011 ± 0.029 | |
| Swing phase | 0.092 ± 0.026 | 0.101 ± 0.017 |
Note: The values are presented as the mean ± SD.
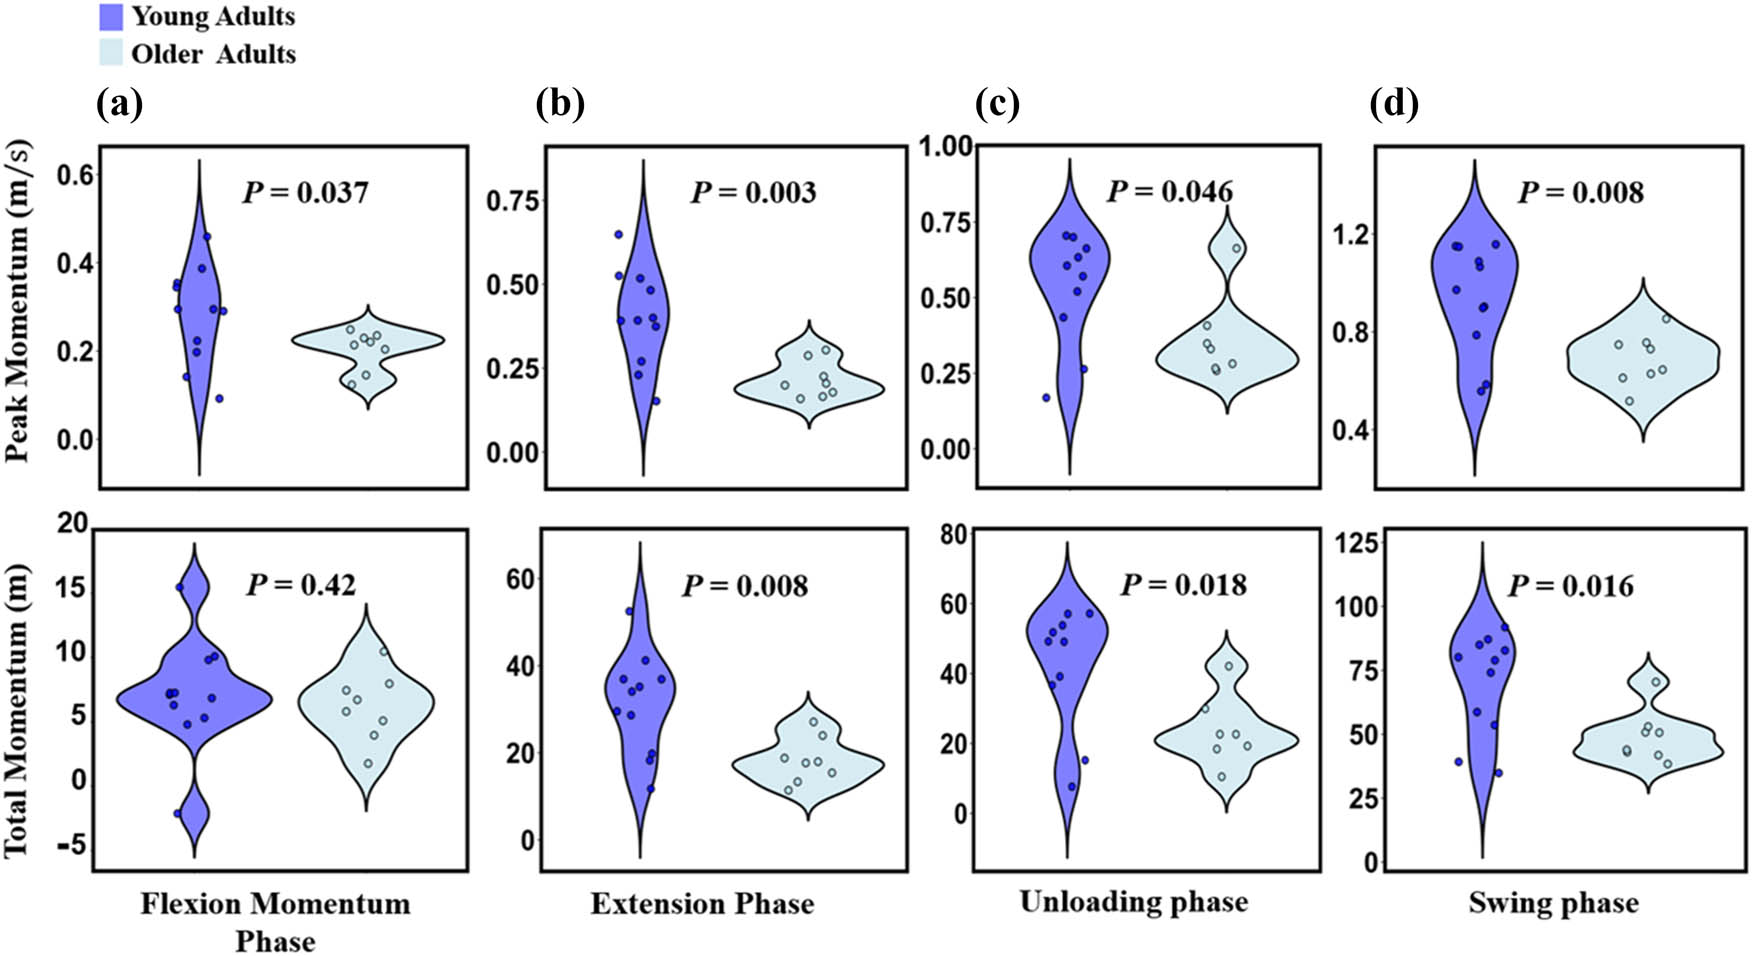
Figure 3
Peak horizontal momentum and total momentum for both cohorts. (a) Flexion momentum phase; (b) extension phase; (c) unloading phase; and (d) swing phase.
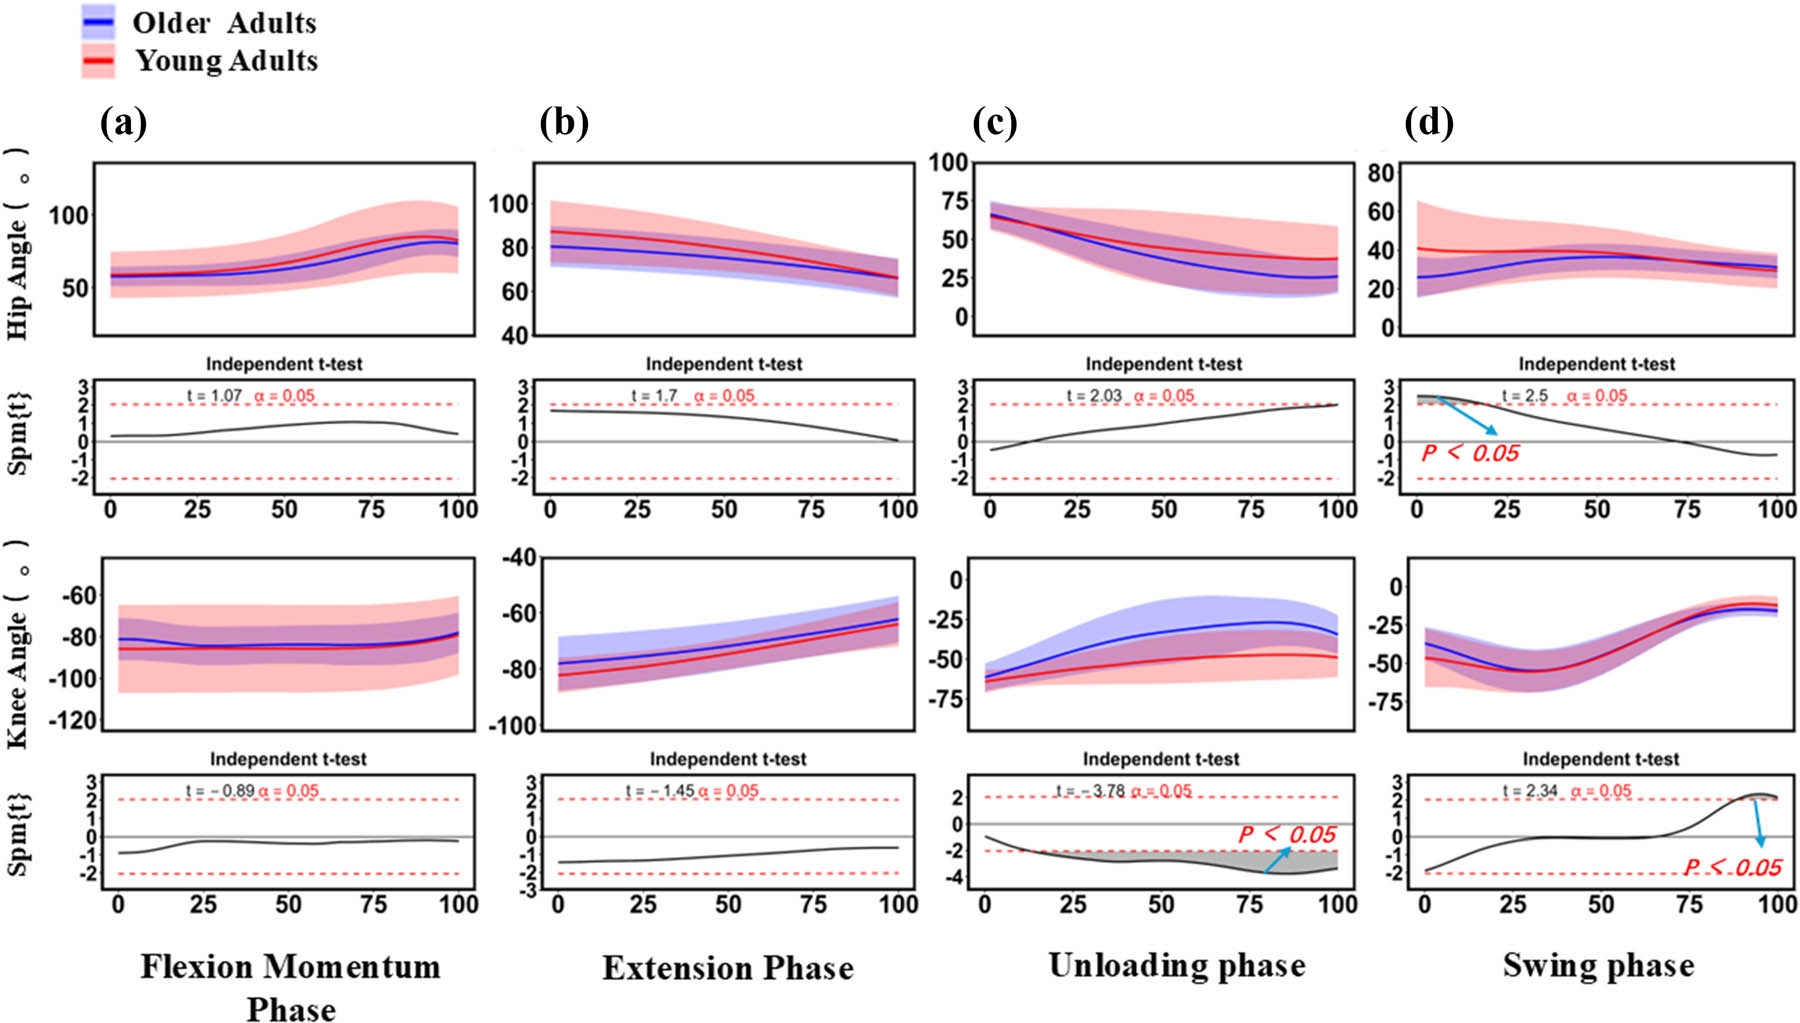
Figure 4
Hip and knee joint ROM for both cohorts. (a) Flexion momentum phase; (b) extension phase; (c) unloading phase; (d) swing phase.
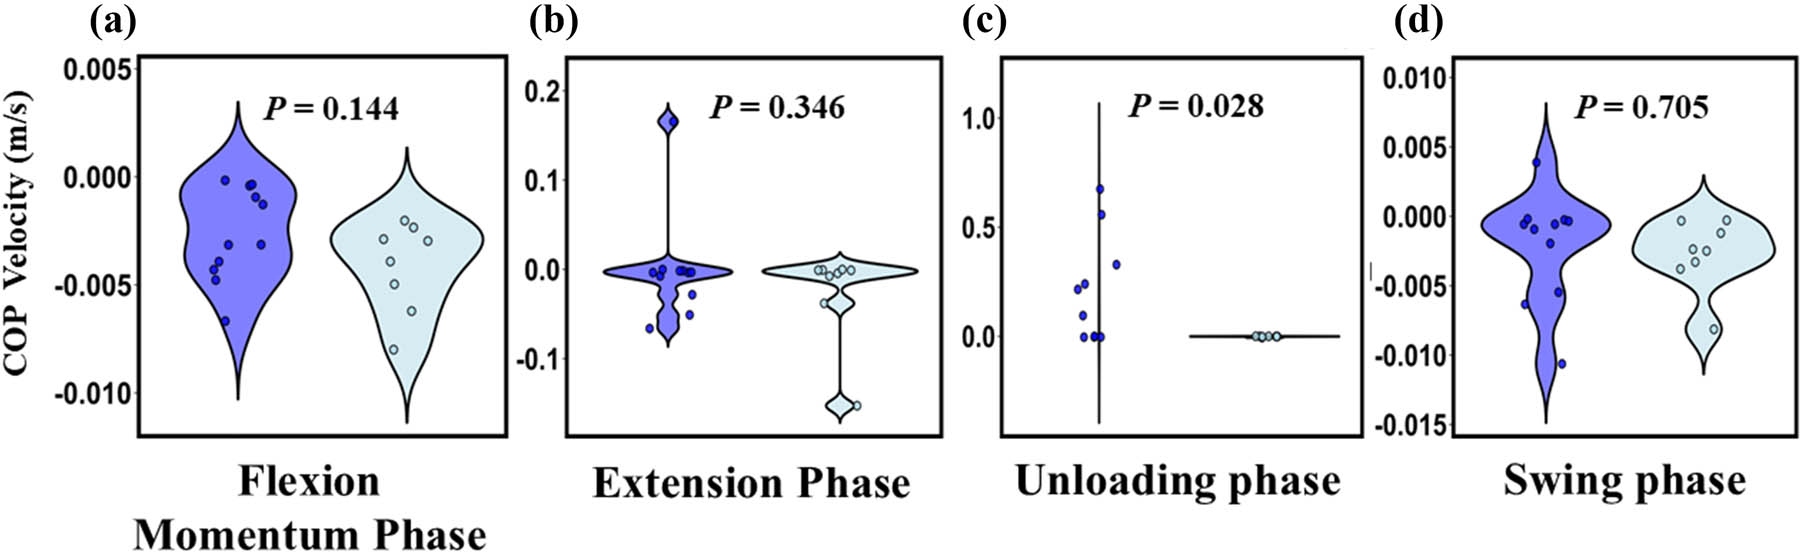
Figure 5
Lateral COP excursion velocity for both cohorts. (a) Flexion momentum phase; (b) extension phase; (c) unloading phase; (d) swing phase.
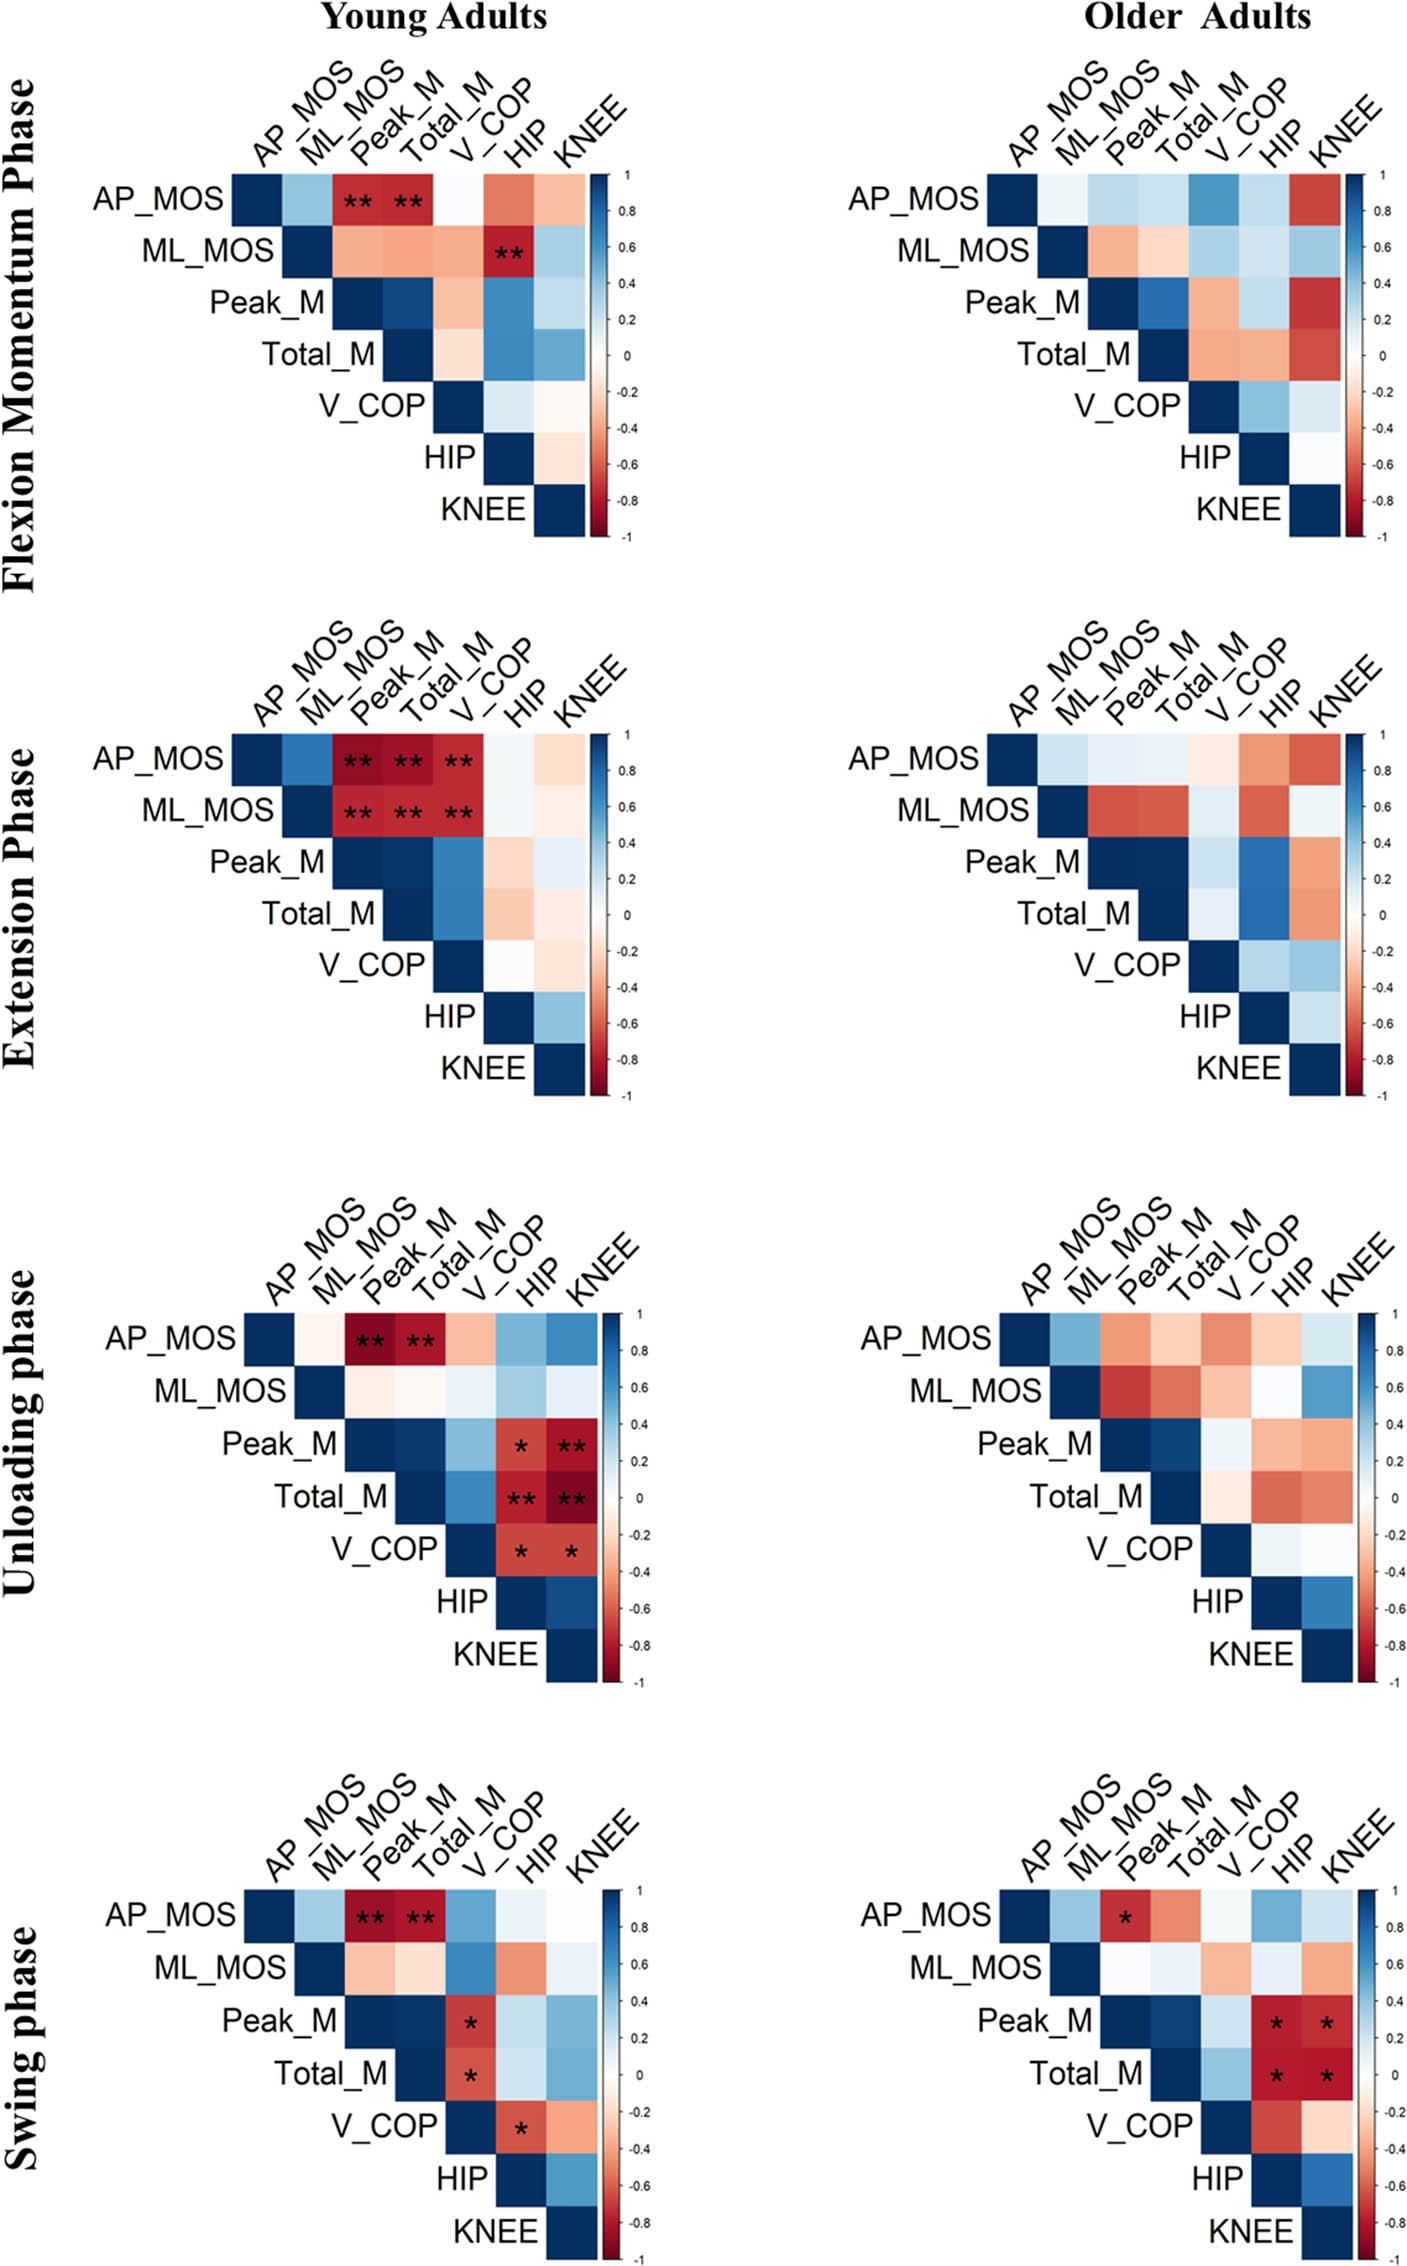
Figure 6
Correlation matrices of biomechanical parameters across STW transition phases in young and older adults. (a) Flexion momentum, (b) extension, (c) unloading, and (d) swing phases. Abbreviations: AP_MOS/ML_MOS, anteroposterior/mediolateral margin of stability; Peak_M/Total_M, peak horizontal/total momentum; V_COP, lateral center of pressure excursion velocity; HIP/KNEE, hip/knee joint range of motion. Color intensity reflects the magnitude of the correlation coefficient (r), with blue and red indicating positive and negative correlations, respectively.