
Table 1
Grouping of repetitive animal experiments
| Group | Impact pressure | Numbers of rats |
|---|---|---|
| Repeated impact | 0.2 + 0.2 MPa | 9 |
| 0.2 + 0.3 MPa | 9 | |
| 0.2 + 0.4 MPa | 9 | |
| 0.3 + 0.2 MPa | 9 | |
| 0.3 + 0.3 MPa | 9 | |
| 0.3 + 0.4 MPa | 9 | |
| 0.4 + 0.2 MPa | 9 | |
| 0.4 + 0.3 MPa | 9 | |
| 0.4 + 0.4 MPa | 9 | |
| Single impact | 0.2 MPa | 9 |
| 0.3 MPa | 9 | |
| 0.4 MPa | 9 | |
| Control | 0 | 9 |
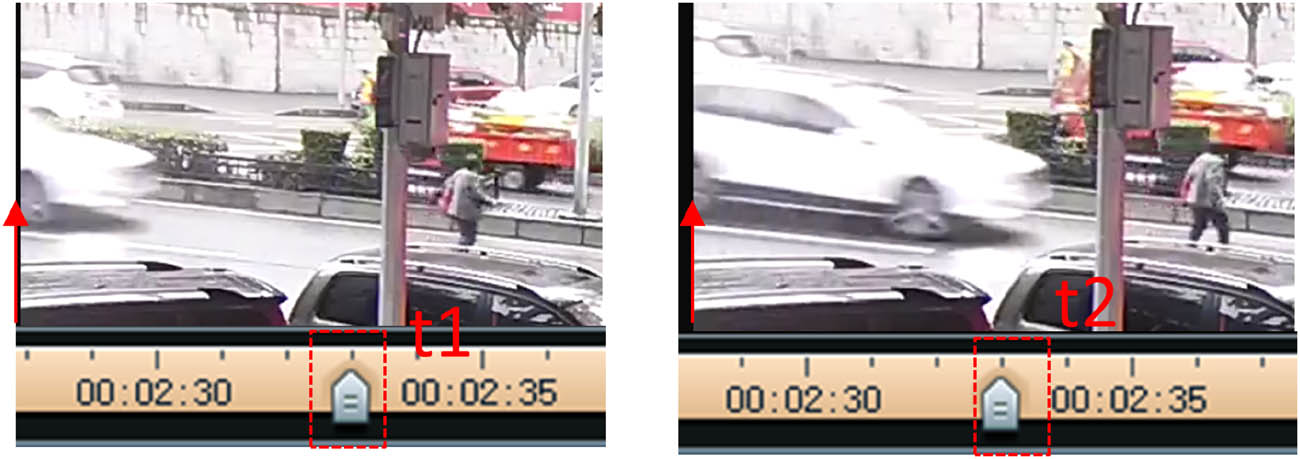
Figure 1
Video taken to estimate vehicle collision speed and pedestrian pose.
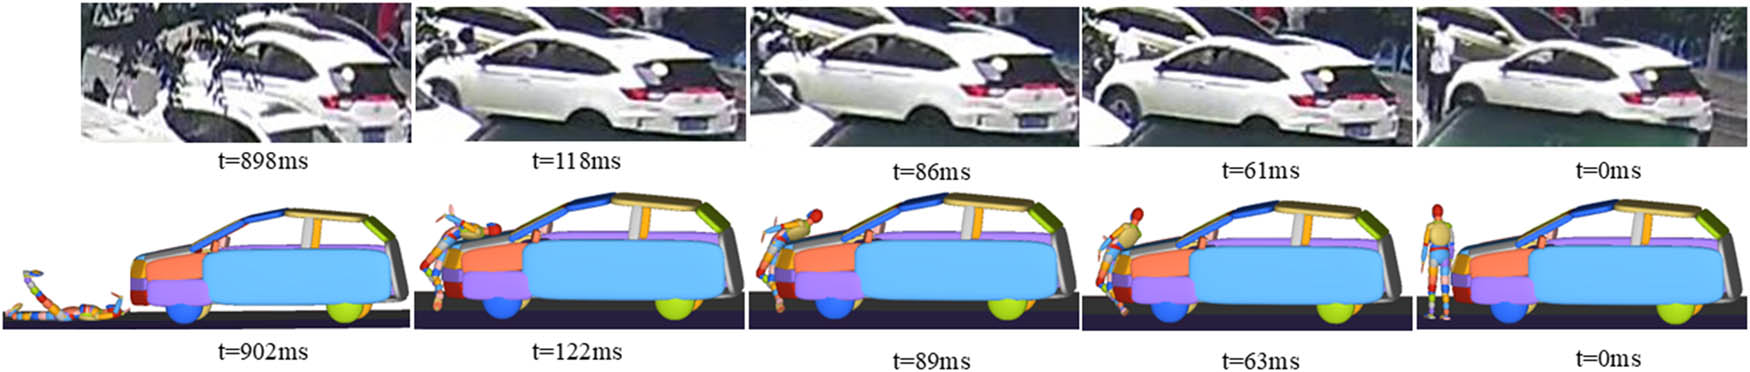
Figure 2
Comparison of pedestrian kinematics between reconstruction and video data.
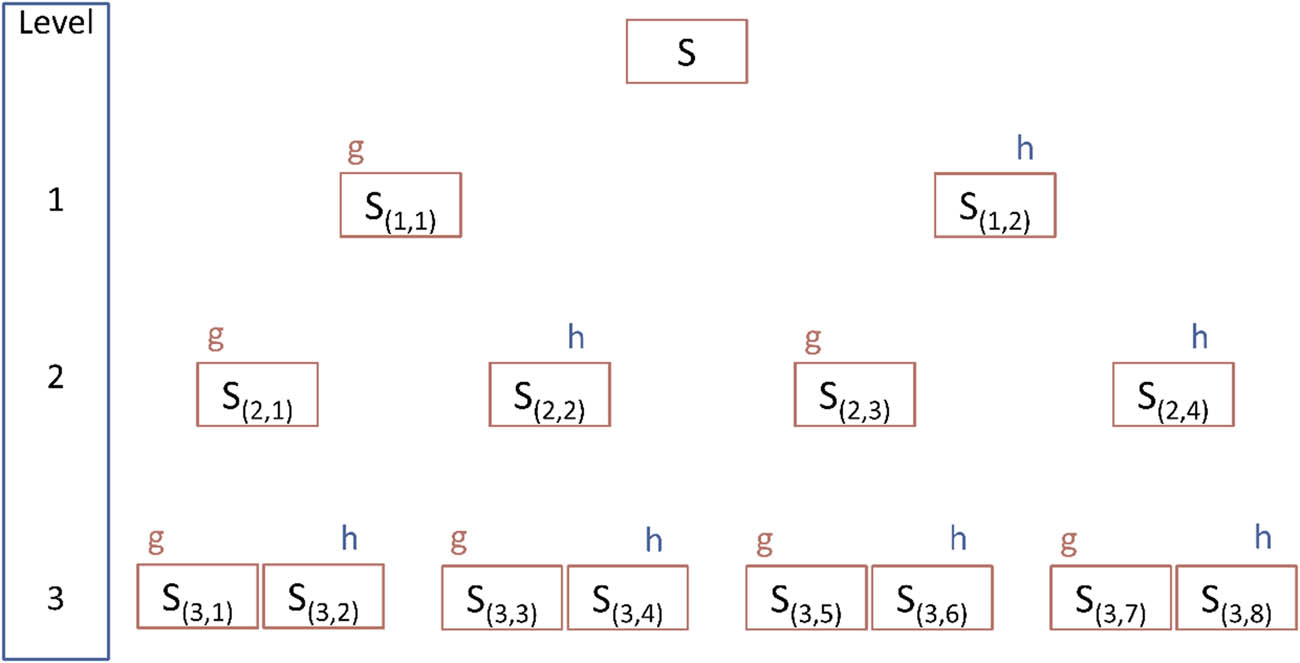
Figure 3
Decomposition tree for wavelet packet analysis.
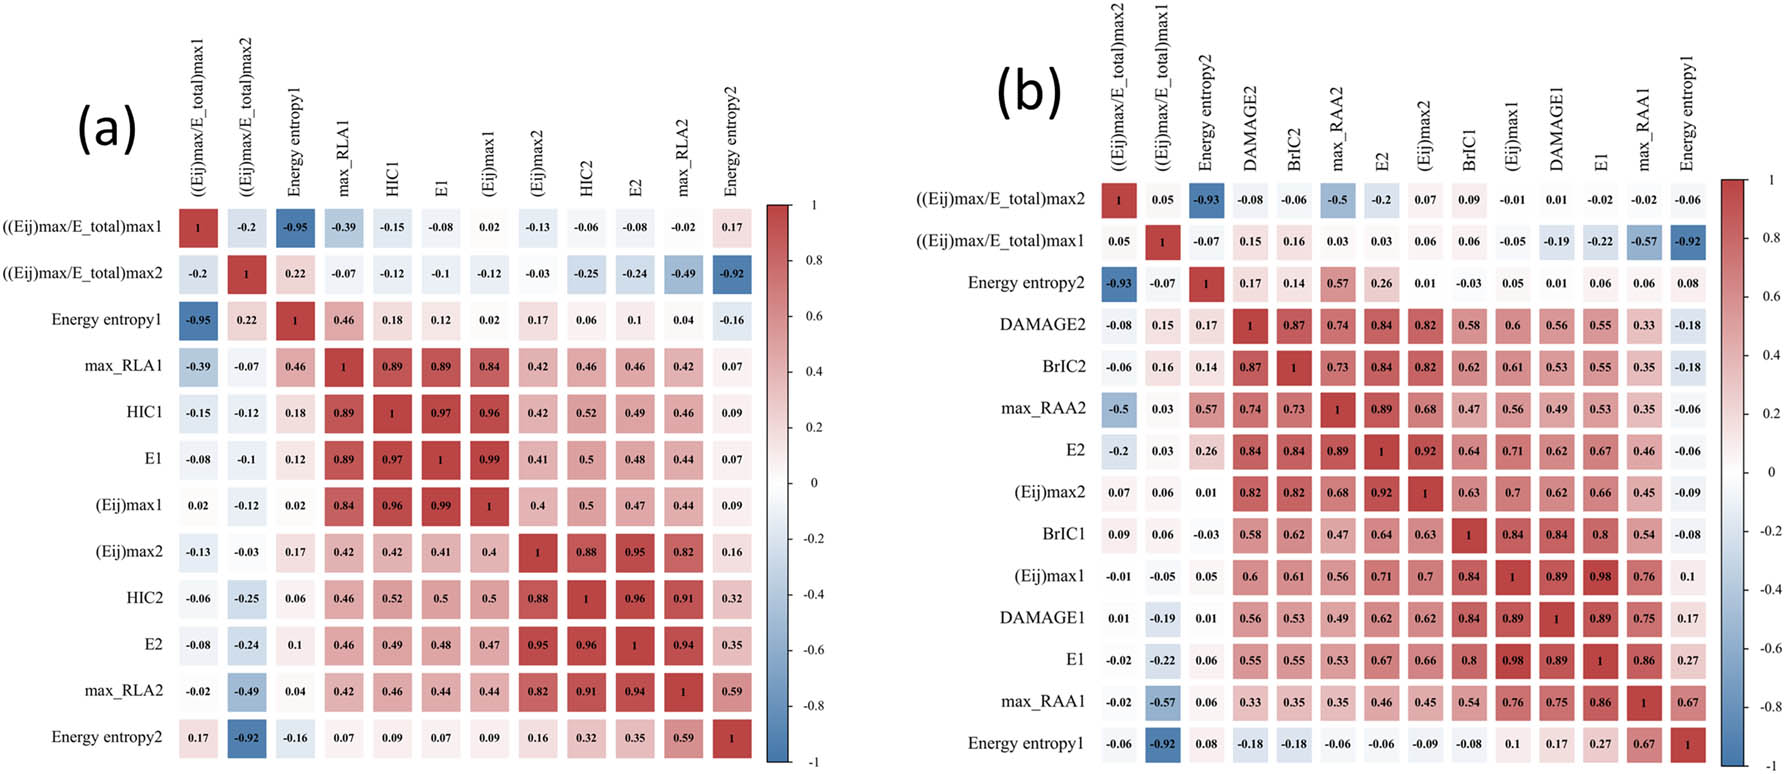
Figure 4
Pearson correlation coefficient (r 2) heat maps with different frequency-domain energy characteristics and brain injury criteria based on different kinematics: (a) time-domain criterion and frequency-domain index correlation based on linear motion, (b) time-domain criterion and frequency-domain index correlation based on rotational motion.
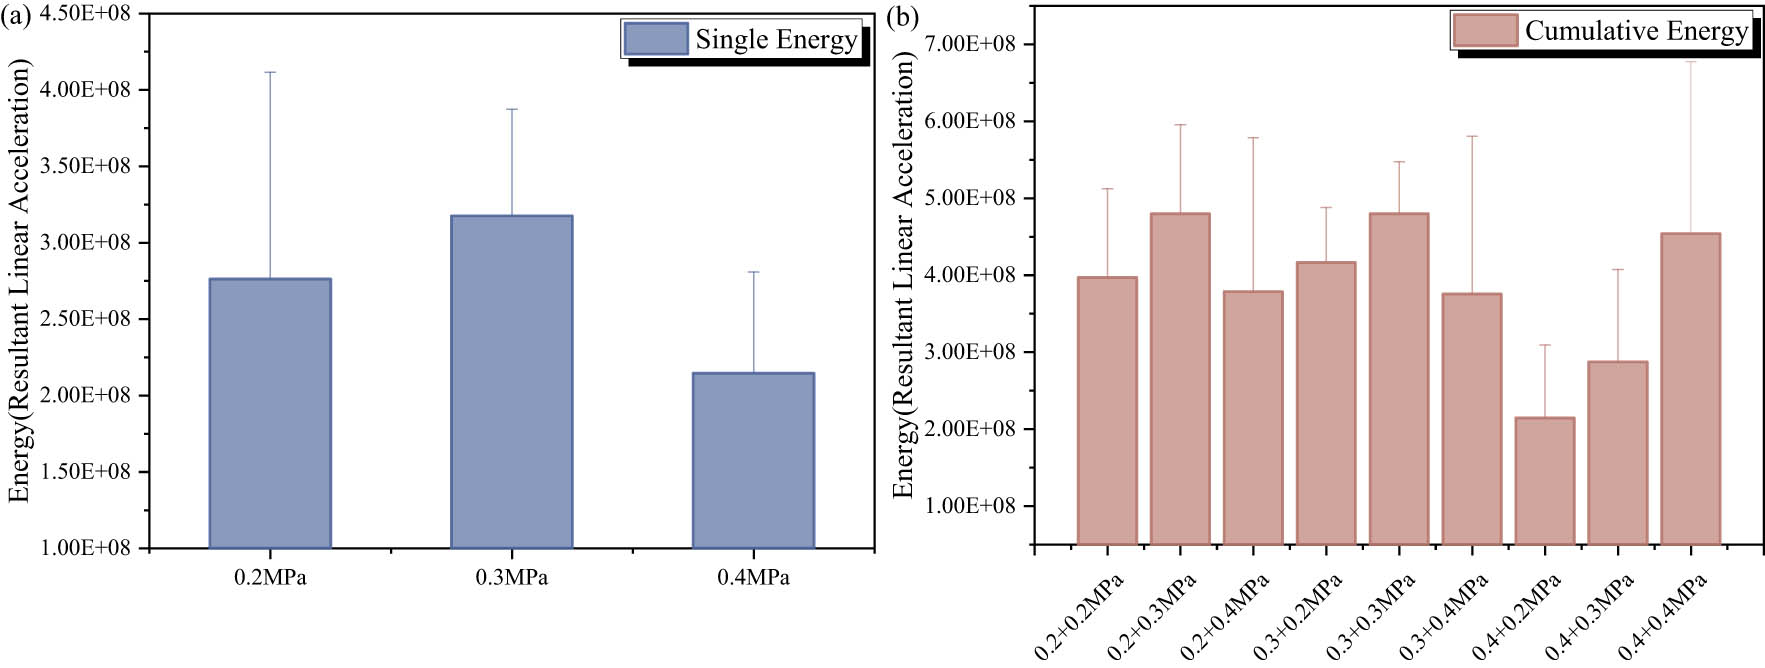
Figure 5
The total energy of the resultant linear acceleration signal. (a) Energy distribution in a single collision; (b) cumulative distribution of energy under repeated collisions.
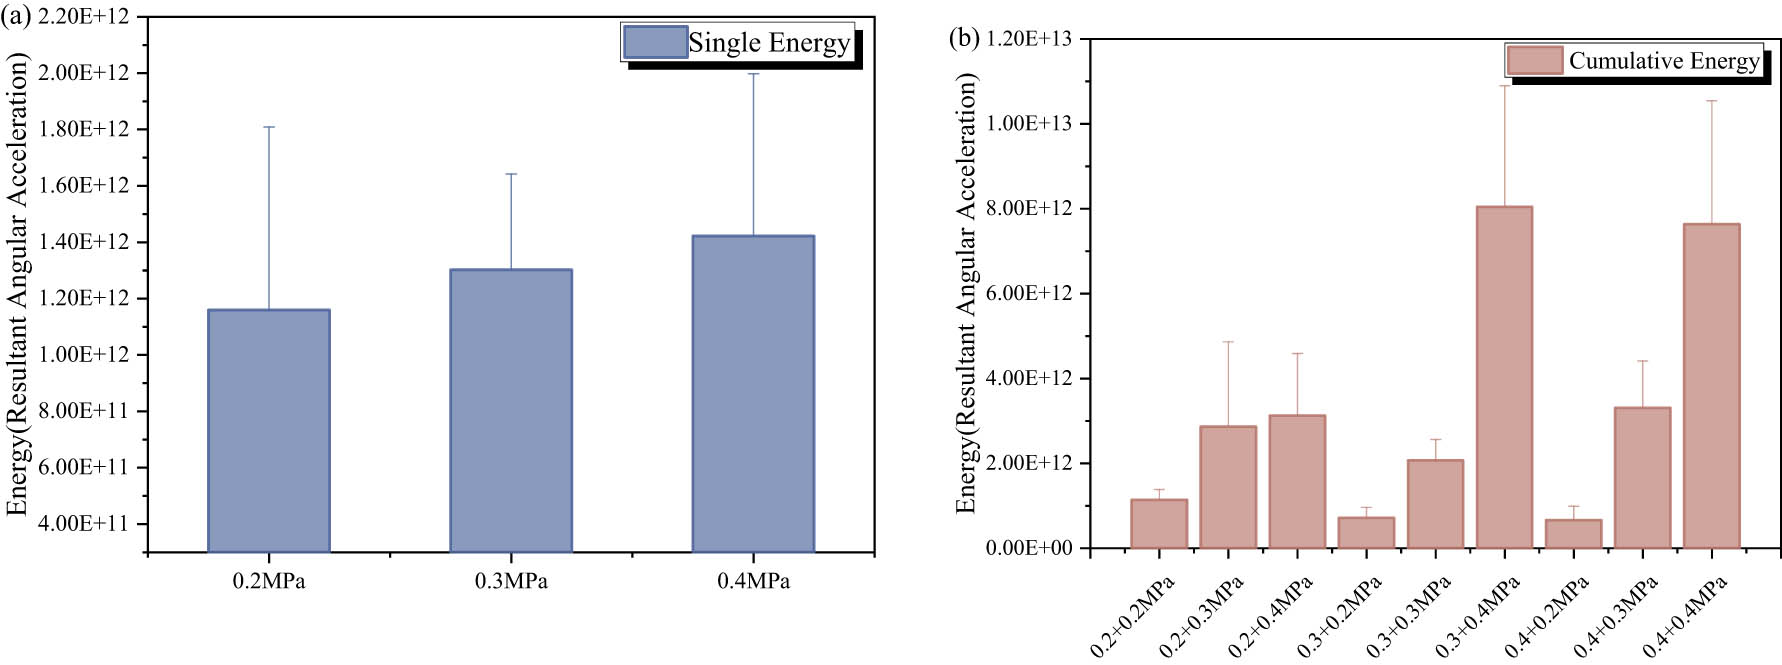
Figure 6
The total energy of the resultant angular acceleration signal. (a) Energy distribution in a single collision; (b) cumulative distribution of energy under repeated collisions.
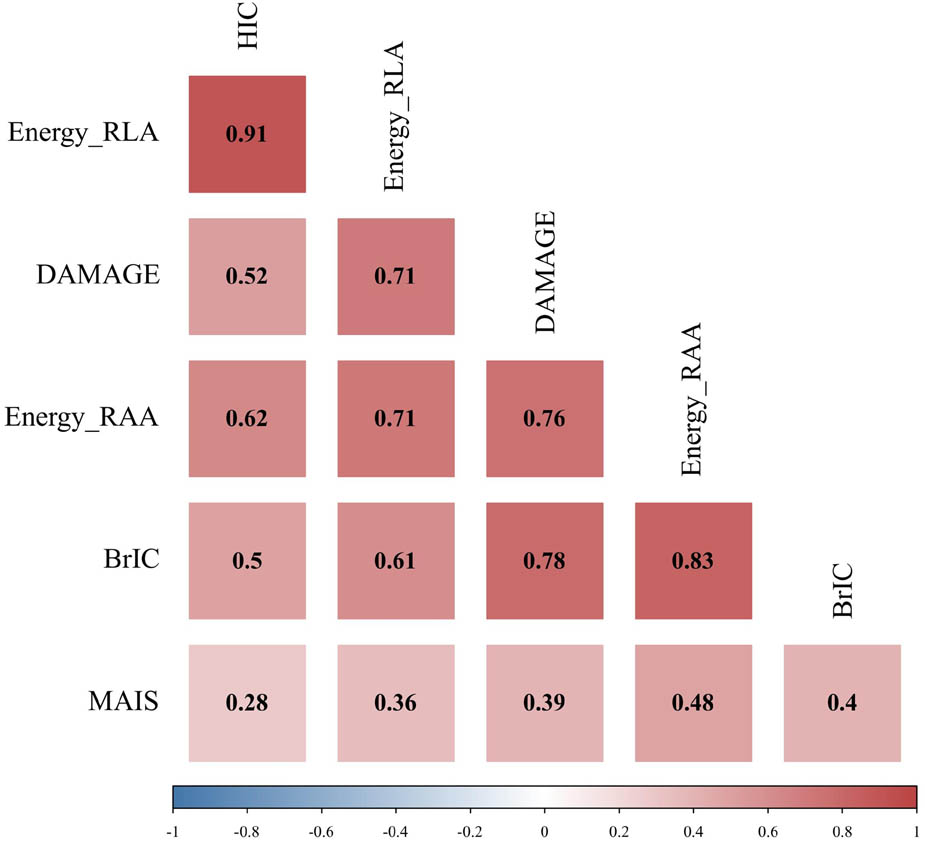
Figure 7
Pearson correlation coefficient (r 2) heatmaps for different time and frequency domain injury metrics.
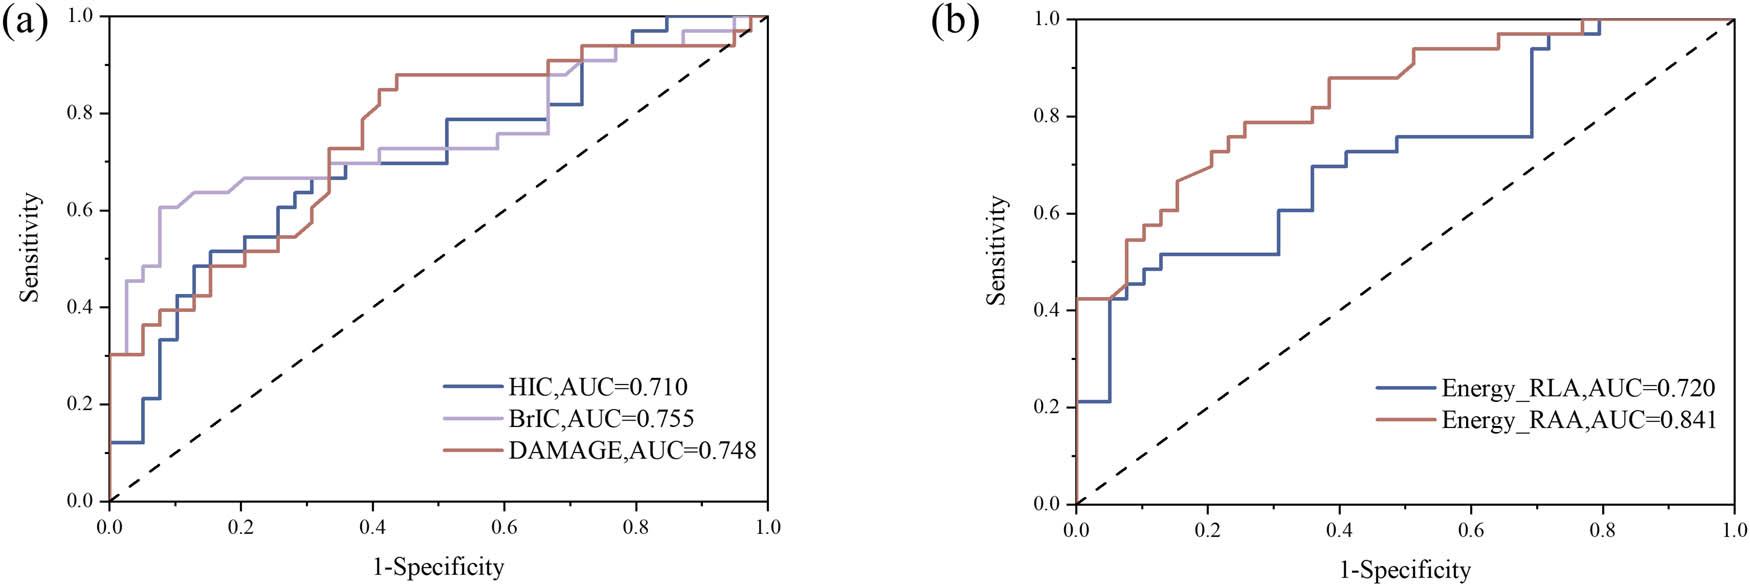
Figure 8
ROC curves of different injury metrics for predicting brain injury risk AIS4+. (a) Standard prediction of head injury based on timedomain Angle; (b) prediction based on Angle characteristic index in frequency domain.