
1. Introduction
Traumatic brain injury (TBI) can result from head impact during sports, traffic accidents, or falls. TBI accounts for 50% of all trauma-related deaths, making head protection a primary concern [1]. In pedestrian collisions, the impact of multiple impacts on the risk of brain injury is often involved. Specifically, the pedestrian’s head collides with the vehicle first and then hits the ground, causing secondary cumulative injury [2,3]. According to data from the German In-depth Accident Study (GIDAS) between 1985 and 1999, 65% of pedestrian injuries are caused by ground contact [4]. When a vehicle impacts pedestrians at speeds below 40 km/h, secondary injury from ground contact is more severe [5]. Therefore, it is essential to consider primary injury caused by initial contact with the vehicle and secondary injury from re-ground contact. It should be recognized that such multiple collisions may have a cumulative effect on the original injury [6,7].
The research on brain injury criteria mainly focuses on assessing the initial impact injury during the pedestrian–vehicle collision, and less attention is paid to the repetitive injury caused by the secondary contact between the pedestrian and the ground. The Wayne State Tolerance Curve (WSTC) was proposed as an initial quantification method for head injury in the 1960s after the first cadaveric experiments to investigate concussion mechanisms, linear skull fractures, and intracranial pressure mechanical injuries [8]. With the continuous development of multi-body and finite element digital models and the in-depth study of craniocerebral injury accidents and simulation reconstruction methods [9], many indices have been established to evaluate the mechanical response of head injuries [10,11]. These include Maximum Principal Strain (MPS), Cumulative Strain Damage Measurement (CSDM [12]), Head Injury Criteria (HIC [13]), Brain Injury Criteria (BrIC [14]), and Diffuse Axonal Multi-Axis General Evaluation (DAMAGE [15]). These metrics can assess and predict the mechanical response to dynamic impact loading associated with head injury while providing a biomechanical basis for brain injury assessment.
There is no established method to assess cumulative craniocerebral injury after multiple impacts, but there has been some previous work to assess repetitive injuries in sports. Stemper et al. investigated the role of repeated head impact exposure in concussion biomechanics in football players through head impact counts and risk-weighted exposure [16]. Daneshvar et al. used football collision accelerometer data to establish a cumulative head impact index to quantify the relationship between repetitive head impacts and chronic traumatic encephalopathy [17]. However, it is essential to note that these studies involve linear superposition of shocks in a nonlinear injury framework, and individuals are not well represented by the population mean. The mechanical response signal of head impact is a typical non-stationary random low-frequency transient signal [1]. The existing brain injury criteria mainly rely on calculating head kinematics time-domain information. In contrast, the multiple impact process in a pedestrian collision is complex and variable, involving multiple angles and intensities of impact superimposed on the head, resulting in injury to brain tissue. The applicability of frequency-domain information in nonlinear and transient systems provides conditions for a further comprehensive study of the spatiotemporal characteristics of brain deformation in head collision motion.
Therefore, this study aims to analyze the frequency-domain characteristics of head impact response signals using wavelet packet energy and investigate a repetitive evaluation method for brain injury through kinematics of multiple head impacts in pedestrian collisions and rat experiments. We employed a multi-body modeling approach to achieve this goal that accurately replicates the kinematics and injury outcomes resulting from pedestrian contact with vehicles and ground. We reconstructed 72 pedestrian collisions and extracted six-degree-of-freedom kinematic data from acute repeat collisions in rats. Based on the motion data, the energy characteristics of cumulative effects of brain injury were discussed in the frequency domain by wavelet packet decomposition. According to the characteristics of cumulative energy, different weighting methods were used to combine the frequency domain information with the traditional time domain injury assessment, and the brain injury repetitive index and the energy-based repetitive injury index were established, and the prediction effect was evaluated.
2. Methods
2.1. Collision data and repeated impact signals
In this study, 72 accident cases involving pedestrian collision with a vehicle and ground impact during collision were selected to evaluate the effectiveness of existing brain injury criteria and frequency domain energy property indicators in predicting brain injury. Among them, 38 cases are from video data, and 34 are from the in-depth investigation database of traffic accidents, all focusing on pedestrian collisions. A proficient team comprising accident investigators and medical professionals meticulously reconstructed each case. The accident case selection criteria include (1) Classification of head injuries based on the 2005 Abbreviated Injury Scale (AIS), ranging from AIS1 + to AIS5 + levels; (2) Inclusion of only those cases where pedestrians experienced secondary contact with the ground following initial collision with the front portion of a vehicle; (3) Documentation of information such as vehicle model, age, and description of injury site; (4) Ability to calculate or estimate pertinent collision details including vehicle impact speed, initial contact position, ground contact position, and attitude.
Because animal experiments can truly simulate the dynamic changes of brain tissue during repeated collisions, the head kinematics data of animal experiments were used to analyze the energy properties in the frequency domain, and to explore the correlation between the frequency-energy trend and the mechanism of repetitive brain injury. Regarding the kinematics signal data of animal heads subjected to repeated impacts with varying intensities, our analysis focused solely on the characteristics of energy accumulation while providing a concise overview of the experimental methodology. For detailed methods, readers can refer to a previous publication [7]. This study selected 117 male SD rats weighing 190 ± 20 g as experimental subjects. As shown in Table 1, using a random number table method, these rats were divided into three groups: control group, single impact group, and repeated impact group. The individual impact levels were categorized into three groups based on pressures of 0.2 MPa, 0.3 MPa, and 0.4 MPa, respectively. The repeated impact group was subdivided into nine subgroups according to a single injury parameter. Each repeated injury was administered at one-minute intervals between impacts. The control group underwent anesthesia without any injury. Nine rats from each control group and each injury subgroup participated in the experiment.
2.2. Reconstruction methodology
The vehicles and pedestrians in 72 selected cases were subjected to kinematic reconstruction models using the multi-body modeling approach in MADYMO software. The geometry of each multi-body vehicle model was developed based on blueprints or actual measurements of the respective accident-involved vehicle. At the same time, component stiffness characteristics were derived from crash block test data reported in previous studies and available ratings of the vehicle model in subsystem tests. Consistent with prior reconstruction studies [3,18], the pedestrian multi-body model was scaled according to the MADYMO pedestrian model to account for victim height and weight.
Another article extensively discusses the reconstruction process of pedestrian attitude and the vehicle’s instantaneous velocity in pedestrian collisions [18]. In brief, assuming the frame rate is known, the speed at which the vehicle comes into contact with the pedestrian is estimated based on the wheelbase and inter-frame time (number of frames/frame rate transmitted) captured in the video, as shown in Figure 1. Subsequently, a multi-body simulation initial impact configuration for vehicle-pedestrian collisions is established for each case, encompassing vehicle impact velocity, pedestrian’s initial posture, and contact position. The initial posture of pedestrians at the moment of contact with vehicles (gait position, bearing angle, body bending state, etc.) constitutes one crucial factor influencing the effective reconstruction of collision processes and reproduction of injuries. The initial posture of pedestrians in the simulation reconstruction can be defined based on video footage. Subsequently, a genetic algorithm was implemented using MATLAB to optimize kinematic global reconstruction by defining a fitness function that ensures consistency between simulation predictions and actual observations while minimizing the sum of relative distances for each pedestrian’s contact position. Finally, a kinematic reconstruction simulation was conducted using the optimal parameters. Figure 2 illustrates an example comparing predicted results with video data.
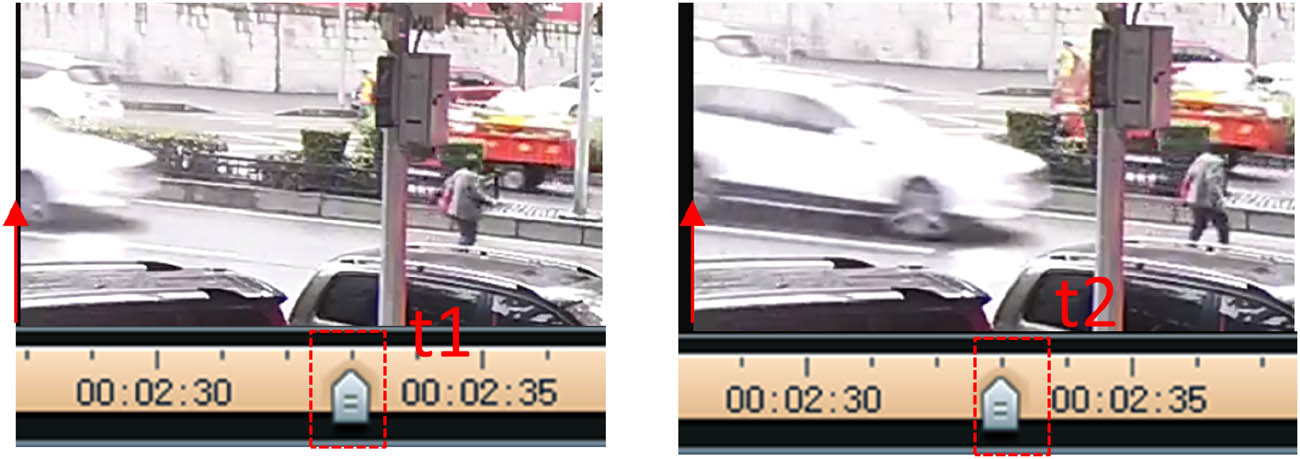
Figure 1
Video taken to estimate vehicle collision speed and pedestrian pose.
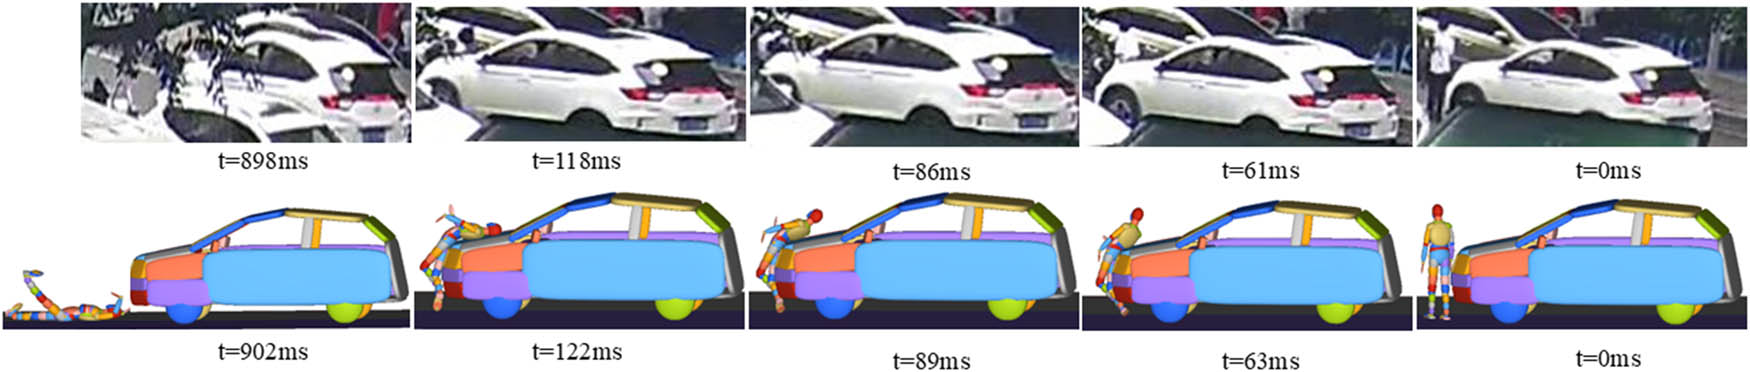
Figure 2
Comparison of pedestrian kinematics between reconstruction and video data.
2.3. Head injury criteria
Our head kinematics calculated three metrics: HIC [13], BrIC [14], and DAMAGE [15]. The constraints and critical values for these injury metrics are adapted from the corresponding studies.
2.4. Wavelet packet transform energy (WPTE)
The wavelet packet decomposition, also called the optimal subband tree structure, is a highly effective approach for addressing non-stationary signals and transient effects. It further enhances the performance of the wavelet transform by subdividing the high-frequency component, thereby offering improved time-frequency resolution to capture the time-frequency characteristics of the signal comprehensively [19]. Moreover, wavelet packet analysis facilitates the development of injury quantification metrics [20,21]. Using Figure 3, the structural diagram of wavelet packet decomposition, as an illustration, this method decomposes the signal into three layers comprising eight frequency bands, with subsequent subdivisions in both high- and low-frequency components at each layer. Unlike solely dividing low-frequency coefficients, here we simultaneously refine both high- and low-frequency coefficients using wavelet packet coefficients. g and h denote low-pass and high-pass filters.
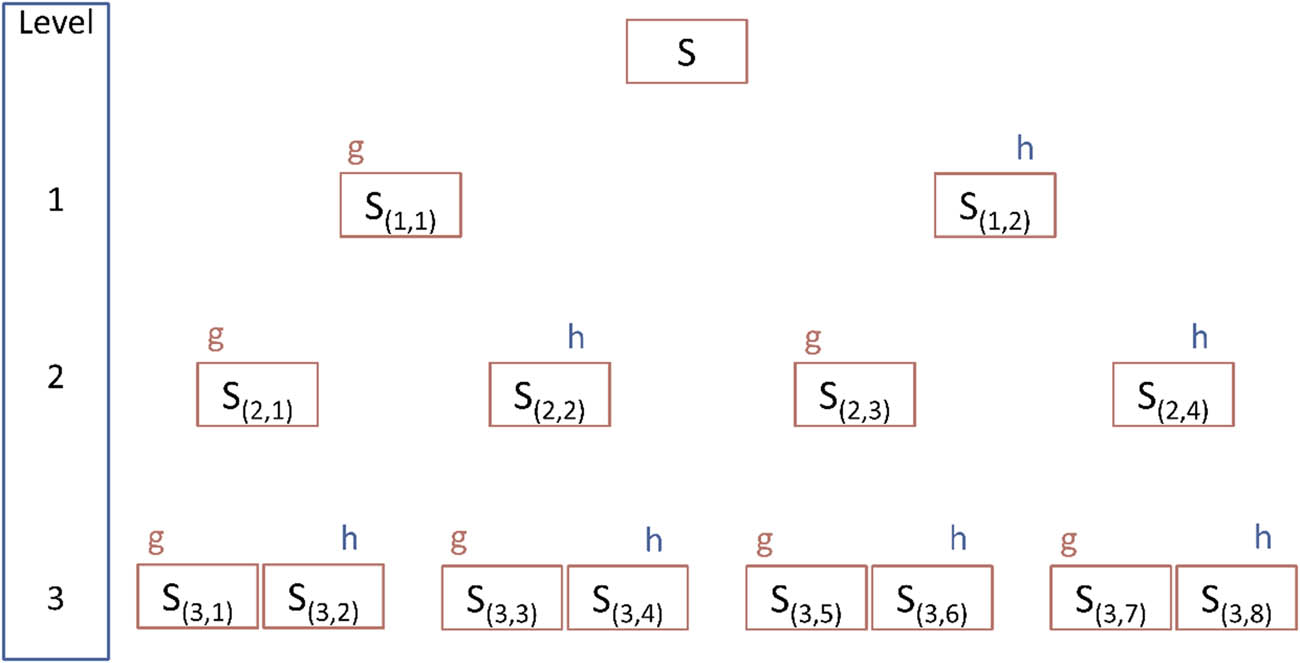
Figure 3
Decomposition tree for wavelet packet analysis.
The signal S can be decomposed into 2n subband signals through n-level wavelet packet decomposition. such as
The expression for the signal component at a specific level i, denoted as Si , can be formulated asThe variable i represents the frequency band (i = 1, 2,…2n), while 2 n signifies the total number of samples acquired within each respective band.The energy E i of each subband signal is computed
The energy of the i frequency band signal is denoted as E i , and represents the magnitude of the j value in the i frequency band signal. refers to the maximum energy among all frequency bands.The total energy E of the signal can be expressed as
where E represents the overall energy of the signal, and M denotes the count of signals in distinct frequency bands obtained through wavelet packet decomposition.The energy ratio of each subband signal to the total energy should be calculated
The energy entropy of the signal is computed after performing wavelet packet decomposition using the definition of information entropy, which can be precisely defined as follows:We employ wavelet packet decomposition in the present study to analyze the head’s Resultant Linear Acceleration (RLA) and Resultant Angular Acceleration (RAA) signals. The following standards are established:(1) During the collision process, pedestrians go through two stages: vehicle and ground contact. The calculation time window for these two stages ranges from T0 to T300ms and includes the moment of peak signal.
(2) In multi-rigid body reconstruction, it is observed that when pedestrians’ heads come into contact with the ground, they exhibit a bouncing behavior. In response to this, we select the signal with the highest peaks in the ground contact signal as our analysis signal for the collision stage involving ground impact.
(3) The head impact response waveform obtained through case reconstruction is decomposed into wavelet packets according to the abovementioned steps, generating a set of wave components. Considering that, when impacted on their heads, low frequencies dominate within a main frequency range while sampling at a frequency of 10 kHz. Therefore, we choose symlet wavelets as the mother wavelets for their tight support, high regularity, low vanishing moments, and preservation of orthogonality. We set the decomposition level to 7. Subsequently, the Matlab program is employed for wavelet packet decomposition and coding, and the frequency domain subband energy of the head response is accumulated to form a quantitative index of damage to realize the frequency domain characteristic analysis.
2.5. Statistical analysis
Pearson correlation coefficient (r 2) was employed to assess the linear correlation between brain injury evaluation criteria in the time domain and characteristics in the frequency domain. Subsequently, potential index for evaluating brain injury in the frequency domain were examined. MATLAB will be utilized for statistical analysis.
For the 72 cases we collected, we assigned a value of 1 to those with an actual MAIS score of 4 or higher and 0 to the rest, where the number of positive cases in the accident reconstruction was 33, and the number of negative cases was 39. The receiver operating characteristic (ROC) curve and area under the curve (AUC) were subsequently employed to evaluate the predictive capability of the repetitive injury index in real cases for AIS4+ injuries. The ROC curve assesses the performance of a classification model by comparing sensitivity (actual positive rate) against the false positive rate, and the closer the ROC value is to 1, the better the model prediction performance is indicated.
3. Results
3.1. Relationship between time-frequency domain indexes of brain injury in pedestrian collisions
Figure 4 shows the Pearson correlation coefficients (r 2) between injury index resulting from vehicle and ground contact and various energy-related features in the frequency domain. Overall, there is a high correlation (r 2 > 0.88) between HIC calculated based on linear motion and the head energy peak and total energy E in the frequency domain. Similarly, a strong correlation (r 2 > 0.82) was observed for the peak resultant acceleration (max_RAA and max_RLA). BrIC and DAMAGE show good correlations (r 2 > 0.8) with the head energy peak and total energy E in the frequency domain when considering rotational motion parameters. BrIC also exhibits a strong correlation with DAMAGE (r 2 > 0.84). However, other frequency-domain energy-related characteristics demonstrate only weak Pearson correlation coefficients ranging from 0.06 to 0.25 concerning the injury index.
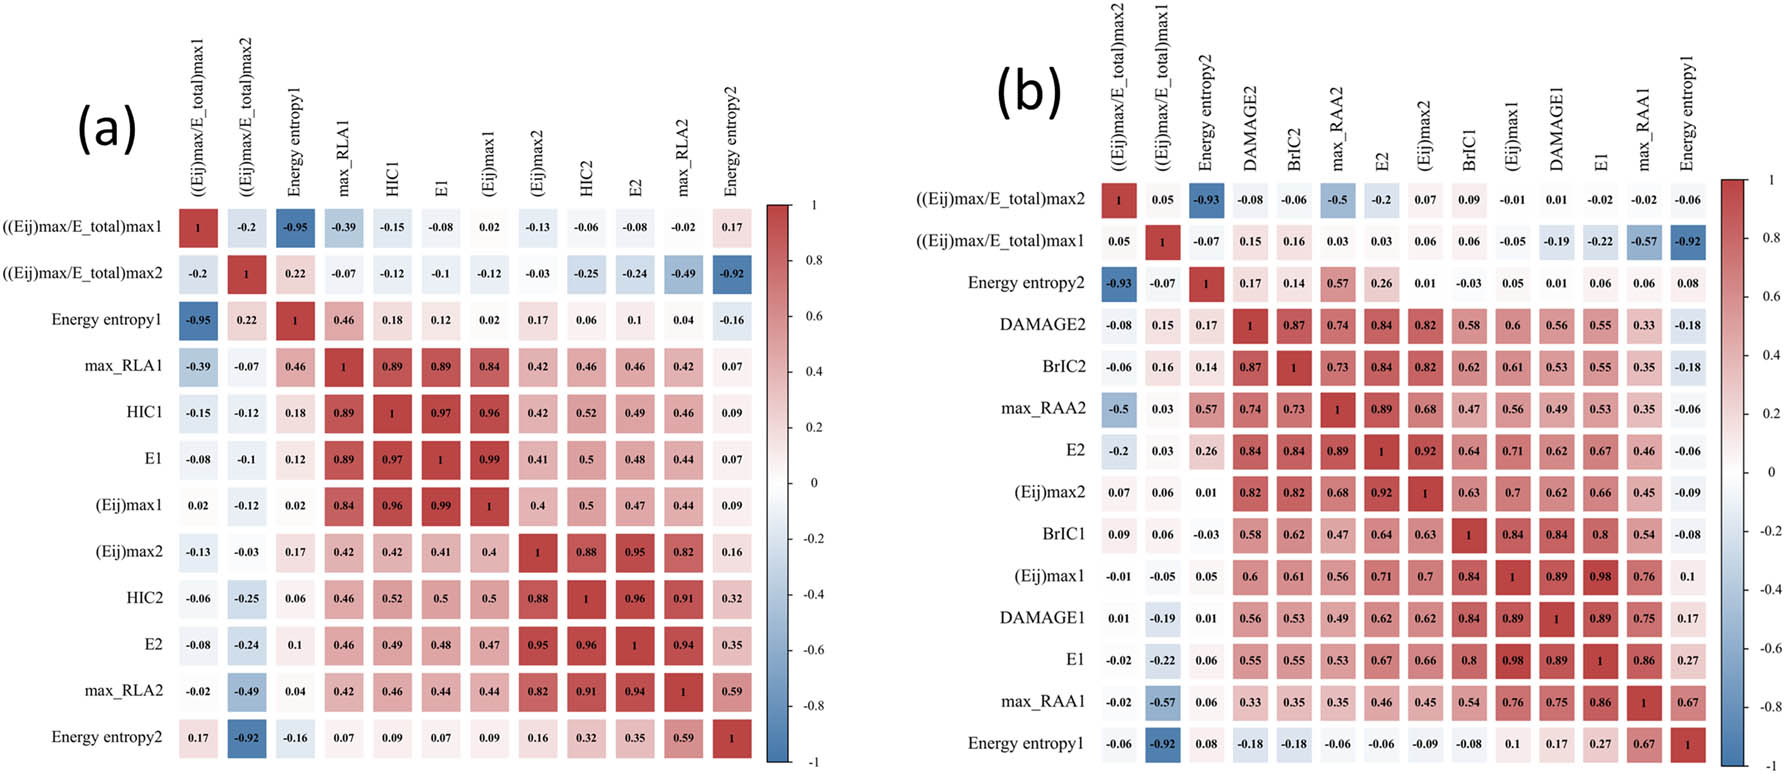
Figure 4
Pearson correlation coefficient (r 2) heat maps with different frequency-domain energy characteristics and brain injury criteria based on different kinematics: (a) time-domain criterion and frequency-domain index correlation based on linear motion, (b) time-domain criterion and frequency-domain index correlation based on rotational motion.
3.2. Frequency-domain characteristics of repetitive impact brain injury in animal experiments
Figures 5(a) and 6(a) demonstrate the accumulated energy based on the Resultant linear acceleration and Resultant angular acceleration signals for a single impact in different intensity ranges. The results show that the impact strength positively correlates with the cumulative energy in the rotational motion. In linear motion, there is a threshold of impact strength beyond which the accumulated energy decreases. In Figures 5(b) and 6(b), the cumulative energy of rotational motion is positively correlated with impact strength under repeated impact, but the loading order will lead to differences. In linear motion, the impact strength still has a threshold. After the first impact exceeds the threshold, the impact strength of the second impact is positively correlated with the cumulative energy.
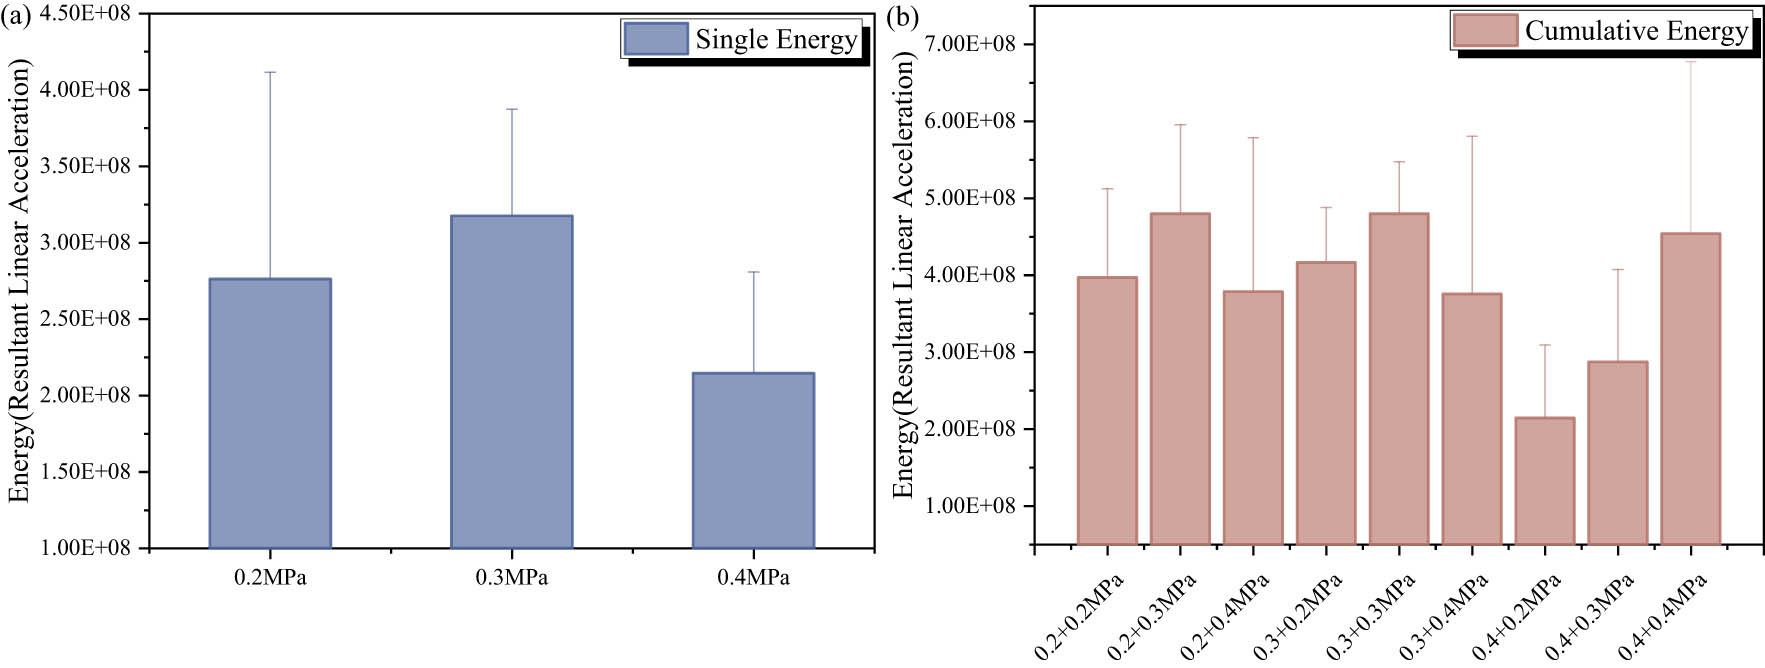
Figure 5
The total energy of the resultant linear acceleration signal. (a) Energy distribution in a single collision; (b) cumulative distribution of energy under repeated collisions.
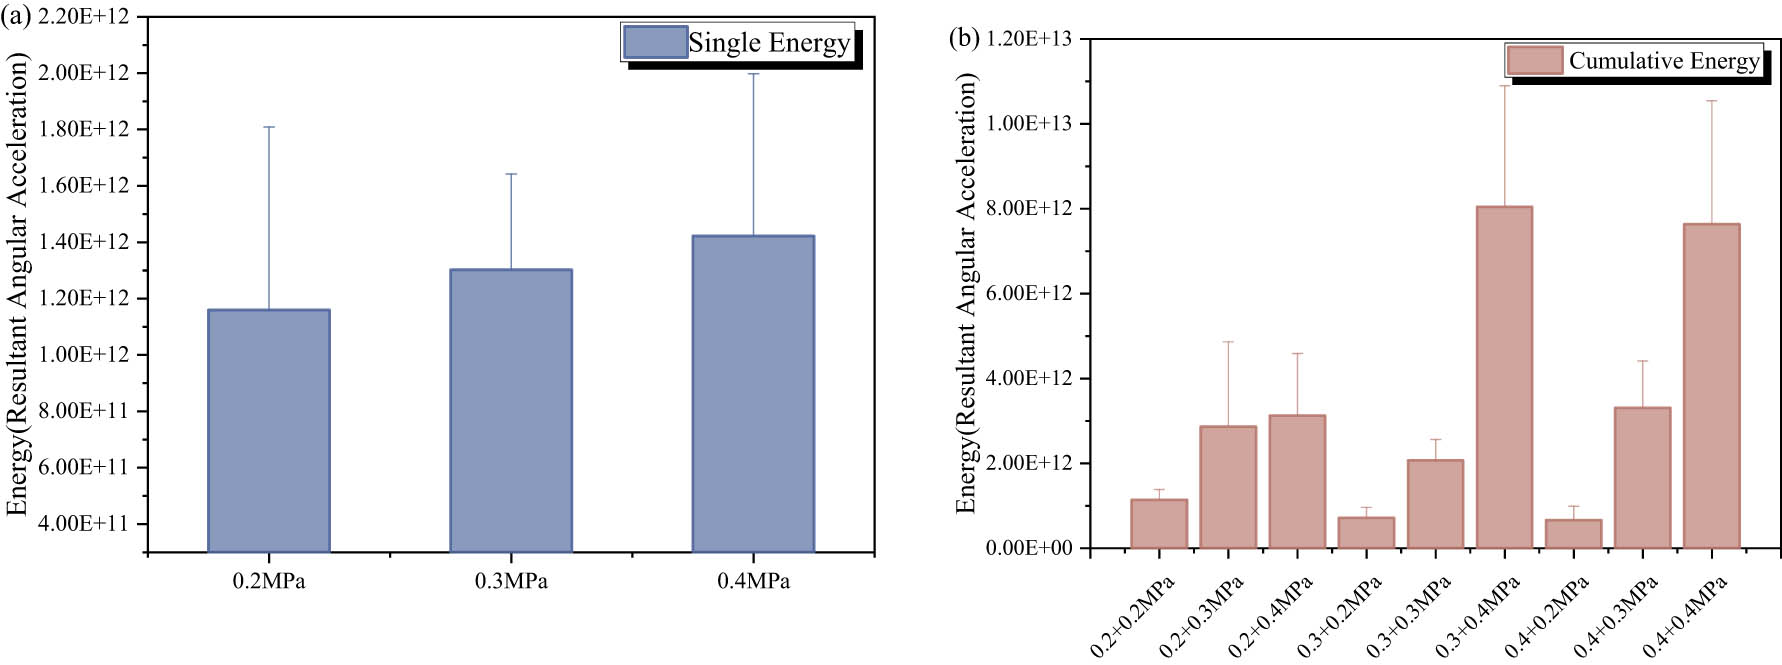
Figure 6
The total energy of the resultant angular acceleration signal. (a) Energy distribution in a single collision; (b) cumulative distribution of energy under repeated collisions.
3.3. Correlation of repetitive injury index
Figure 7 shows that the Pearson correlation coefficient (r 2) among the cumulative injury assessment index ranges from 0.5 to 0.91. Through rotational motion analysis, the BrIC and DAMAGE show the highest correlations with the cumulative energy index WPTE_RAA, with correlation coefficients of 0.83 and 0.76, respectively. In linear motion analysis, the HIC exhibits the highest correlation with the cumulative energy index, with a correlation coefficient of 0.91. Energy_RLA shows varying degrees of positive association with each accumulated injury index in rotational and linear motion analyses, with Pearson correlation coefficients ranging from 0.61 to 0.91. Similarly, Energy_RAA shows a similar trend. It was weakly correlated with MAIS score among all cumulative damage indicators, but Energy_RAA had the highest correlation coefficient (r² = 0.48).
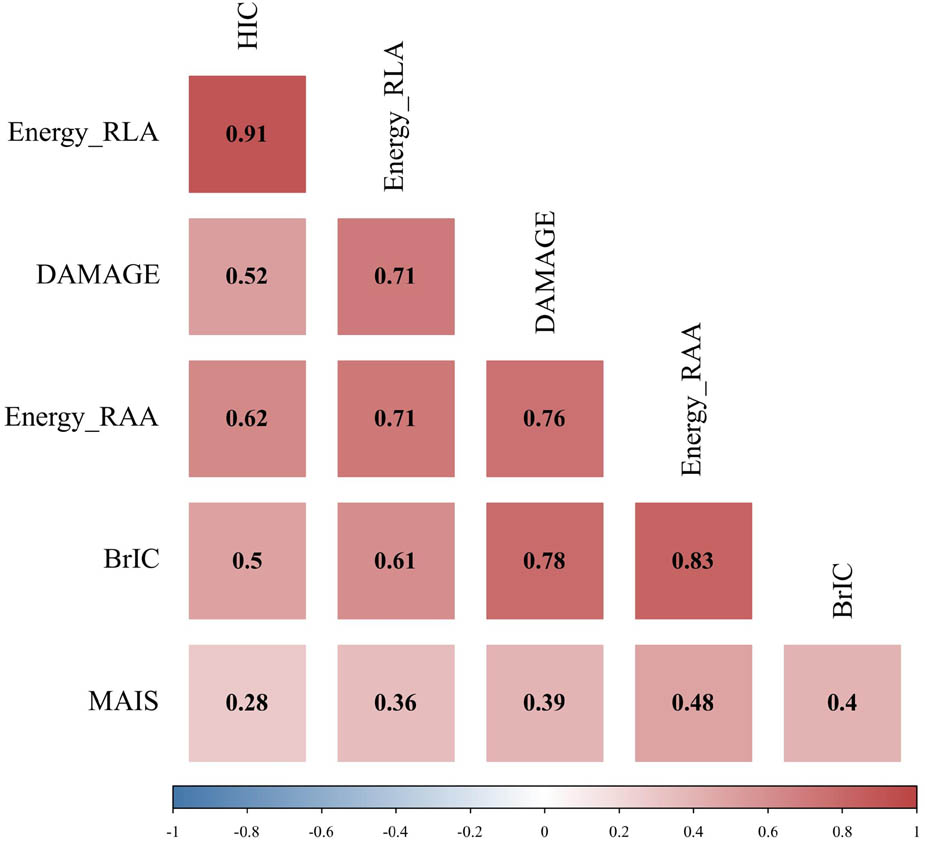
Figure 7
Pearson correlation coefficient (r 2) heatmaps for different time and frequency domain injury metrics.
3.4. Analysis of predictive ability of weighted brain injury index
Figure 8 shows the ROC curves of different injury indicators for AIS4 + to predict the cumulative brain injury risk. Among the brain injury criteria in Figure 8a, BrIC showed better predictive power with an AUC of 0.755, followed by DAMAGE with an AUC of 0.748, and HIC with an AUC of 0.710. Among the repeated injury evaluation indices based on frequency domain characteristics Figure 8b; Energy_RAA based on the energy accumulation index of the synthetic angular acceleration signal, has the best prediction effect on AIS4+ real head injury, with an AUC value of 0.841. The best-performing index for linear motion is Energy_RLA, which is based on the cumulative energy index of the synthesized linear acceleration signal and has an AUC of 0.72. Overall, the predictive performance of injury metrics based on frequency domain characteristics is better than that of traditional brain injury criteria. On the other hand, the index prediction results based on rotational motion are better than those based on linear motion.
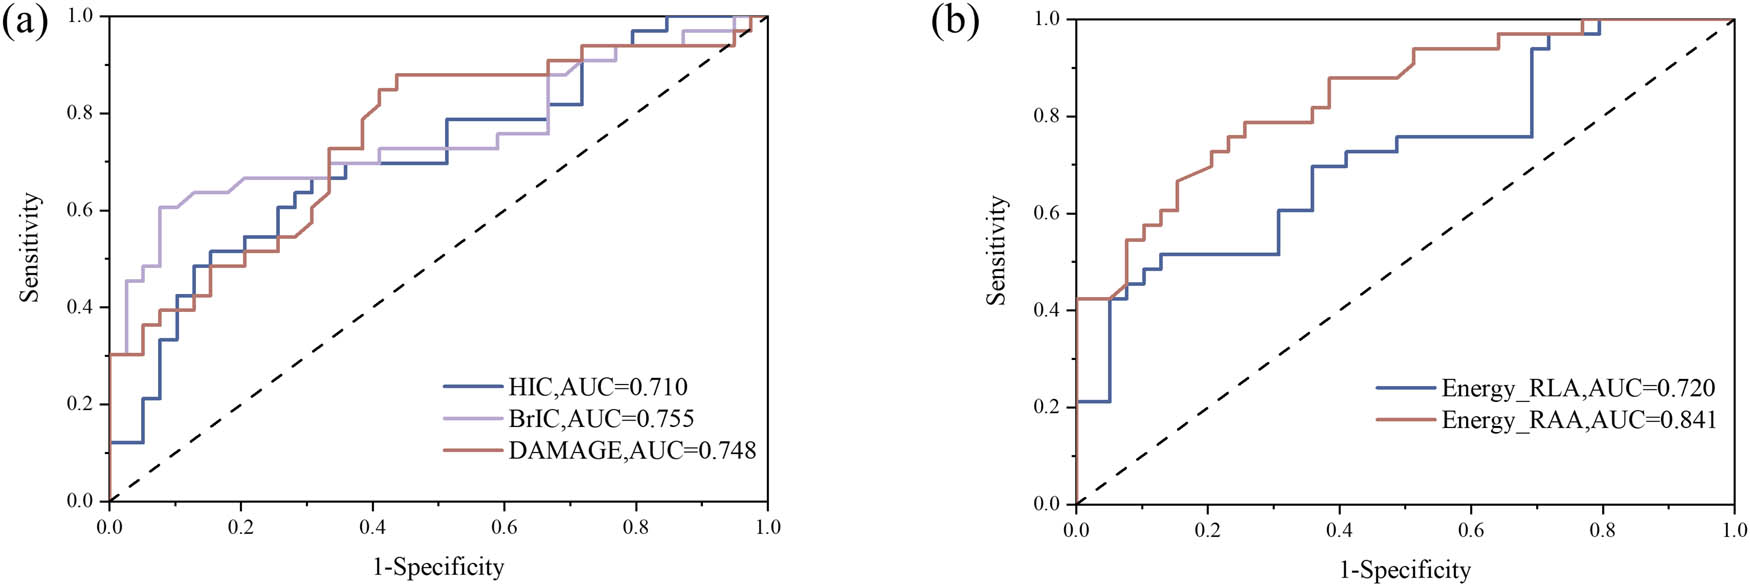
Figure 8
ROC curves of different injury metrics for predicting brain injury risk AIS4+. (a) Standard prediction of head injury based on timedomain Angle; (b) prediction based on Angle characteristic index in frequency domain.
4. Discussion
In this study, we employed the wavelet packet decomposition method to investigate the frequency-domain energy characteristics of six-degree-of-freedom head kinematic data under repetitive collisions. Based on the cumulative energy characteristics, a repetitive injury metric is established to improve the accuracy of injury risk assessment of various collision events such as pedestrian collisions. The data used in our study were obtained from MADYMO reconstructions of pedestrian collision accidents and acute repetitive impact animal experiments. Multibody dynamics can effectively reconstruct pedestrian collision processes and replicate injuries [3,18], while animal experiments can further characterize the cumulative effects and pathological mechanisms of acute repetitive collision brain injuries with short inter-impact intervals. For each group of pedestrian head kinematic data, we calculated several measures of brain injury criteria, and we conducted a correlation analysis with the frequency domain energy features obtained from wavelet packet decomposition. Additionally, using animal experimental data on head kinematics, we explored the cumulative effects of repetitive brain injury from a frequency domain energy perspective. We aim to establish a connection between pedestrian head motion and collisions with vehicles and the ground. In addition to the above methods, wavelet packet decomposition has been widely applied in various fields for its suitability for non-stationary random low-frequency transient signals (such as head impacts) and its accuracy in time-frequency localization [19,20,22]. Therefore, in this study, we also established an index based on the total energy of synthetic linear acceleration and synthetic angular acceleration signals to evaluate cumulative injury.
Choosing wavelet packet decomposition is based on capturing the spatiotemporal characteristics of brain deformation during motion processes from a frequency domain perspective. Laksari et al. found a strong dependence between the maximum induced strain in brain surrogate materials and the frequency of applied head movements [23]. In blunt impact studies, Li et al. discovered a high correlation between peak energy in the head frequency domain and existing criteria for head injury assessment, as well as certain amplitude-frequency aggregation features in head acceleration response [20]. In this study, Pearson correlation analysis revealed correlations between existing brain injury criteria and peak energy in the frequency domain (Figure 4), with even stronger correlations observed with total energy in the frequency domain, demonstrating specific cumulative characteristics. However, different brain injury criteria exhibit some differences due to their focus on different kinematic physical quantities of the head and derivation formulas. HIC shows a higher linear correlation (r 2 > 0.96) with total energy because they are both based on resultant linear acceleration signals of the head [13]. BrIC only takes the peak angular velocity of the head as a physical quantity [14]. In rotational motion, richer temporal dynamics will likely produce more spatiotemporal differences within the brain structure. Similar to the wavelet packet decomposition, DAMAGE, based on second-order system mechanical simulation, further considers the time history of angular acceleration during head impact [15], incorporating more complex spatiotemporal features in head impact response and demonstrating better effectiveness in predicting brain injury.
In many trauma models, the rat response closely correlates with the human response to injury [22]. Repetitive traumatic brain injury (rTBI) is the most common injury in collision events. Researchers have conducted a comprehensive study on its injury mechanism. Li et al. found that rTBI has a cumulative effect, which is not a simple linear superposition, and has an apparent injury threshold [7]. Huang et al. also reached the same conclusion in the study on the cumulative effect of biological craniocerebral injury under repeated explosion shock [6]. The frequency domain analysis of head kinematics signals in repetitive animal experiments showed (Figure 5) that the signal energy obtained from linear motion analysis showed a nonlinear relationship between impact strength and energy. The energy analysis of rotating motion signals shows a linear relationship between impact strength and energy (Figure 6) but not linear superposition. The cumulative effect of repetitive brain injury also differs between the energy characteristics of rotational and linear motion in the frequency domain energy perspective.
The total energy accumulation index (Engery_RLA, Engery_RAA) based on the resultant linear and resultant angular acceleration of the head has the best prediction effect in linear and rotational motion (Figure 8). The brain’s motion strongly depends on the input load’s frequency [23,24], and considering the amplitude and frequency accumulation properties of the acceleration response signal may be a potential method to assess repetitive head injuries. It is essential to acknowledge that while the new method is better at predicting the outcome of cumulative head injury (AIS4+) than traditional injury metrics, there is still room for further improvement and optimization. The cumulative effect of repetitive brain injury is complex, given that the current analysis only used linear and rotational accelerations to predict multiple head impacts on pedestrians. It did not establish a prediction model for linear and rotational motion co-induction. Therefore, future research needs more TBI data to explore the optimization of cumulative injury index in multiple collisions and further improve the model’s prediction accuracy and practical application value.
Funding information
This work was supported by the State Key Laboratory of Intelligent Vehicle Safety Technology (IVSTSKL-202516), and Shanghai Key Laboratory of Forensic Medicine and Key Laboratory of Forensic Science, Ministry of Justice (KF202502).
Author contributions
Liangliang Shi: Conceptualization, Data curation, Formal analysis, Investigation, Methodology, Visualization, Writing – original draft, Writing – review & editing. Tao Xiong: Conceptualization, Data curation, Investigation, Methodology, Visualization, Writing – original draft, Writing – review & editing. Zhiyong Yin: Conceptualization, Methodology. Kui Li: Investigation,Formal analysis. Shengxiong Liu: Conceptualization, Funding acquisition, Investigation, Methodology, Project administration, Writing – review & editing. Zhengdong Li: Conceptualization, Funding acquisition, Investigation, Methodology, Project administration, Writing – review & editing.
Conflict of interest statement
The author(s) declared no potential conflicts of interest with respect to the research, authorship, and publication of this article.
Data availability statement
The data supporting the findings of this study are available from the corresponding author upon reasonable request.