
Table 1
Demographic and anthropometric characteristics of participants in the control and balance disorders groups
| Group | Sex | n | Age (years) | Body mass (kg) | Height (cm) | BMI (kg/m²) |
|---|---|---|---|---|---|---|
| Control | Total | 26 | 67.8 ± 5.7 (55–78) | 79.9 ± 12.9 (55–99) | 165.5 ± 8.5 (151–183) | 29.0 ± 3.8 (22–37) |
| Female | 17 | 68.2 ± 5.6 (57–77) | 74.6 ± 12.8 (55–99) | 160.4 ± 4.4 (151–170) | 28.9 ± 4.6 (22–37) | |
| Male | 9 | 66.9 ± 6.3 (55–78) | 89.8 ± 7.2 (77–98) | 175.1 ± 5.3 168–183) | 29.2 ± 1.6 (27–32) | |
| Balance disorders | Total | 26 | 67.4 ± 8.7 (55–82) | 70.4 ± 12.3 (47–91) | 162.3 ± 9.1 (151–187) | 26.5 ± 3.7 (20–35) |
| Female | 19 | 66.3 ± 8.2 (55–80) | 67.2 ± 12.0 (47–91) | 158.4 ± 5.5 (151–170) | 26.6 ± 4.1 (20–35) | |
| Male | 7 | 70.4 ± 9.9 (59–82) | 79.0 ± 7.2 (70–89) | 173.0 ± 8.0 (164–187) | 26.3 ± 2.0 (24–29) |
Values are presented as mean ± standard deviation (range).
Table 2
Comparison of spatiotemporal gait parameters between the control and balance disorders groups
| Parameter | Group | p-Value | ||||
|---|---|---|---|---|---|---|
| Control (n = 26) | Balance disorders (n = 26) | |||||
| Mean ± SD | Min–Max | Mean ± SD | Min–Max | |||
| Spatial | Step length (cm/cm) | 35.94 ± 2.65 | 30.62–40.31 | 35.17 ± 5.19 | 26.17–45.68 | 0.510 |
| Stride length (cm/cm) | 66.78 ± 8.14 | 48.45–80.03 | 64.12 ± 10.33 | 48.34–81.18 | 0.320 | |
| Base of support (cm/cm) | 8.51 ± 2.70 | 5.05–12.72 | 8.57 ± 3.75 | 0.96–14.91 | 0.949 | |
| Temporal | Single support (% gait cycle) | 35.06 ± 2.03 | 29.39–37.63 | 35.595 ± 2.97 | 31.601–43.193 | 0.855 |
| Double support (% gait cycle) | 21.27 ± 5.88 | 12.63–29.50 | 26.46 ± 12.55 | 13.92–63.49 | 0.201 | |
| Stance duration (% gait cycle) | 64.75 ± 5.87 | 53.767–78.717 | 65.00 ± 6.62 | 78.930–53.715 | 0.899 | |
Table 3
Comparison of within-group left–right asymmetry of spatiotemporal gait parameters
| Parameter | Group | |||||||
|---|---|---|---|---|---|---|---|---|
| Control (n = 26) | Balance disorders (n = 26) | |||||||
| Left Mean ± SD | Right Mean ± SD | Mean difference Left–Right | p-Value | Left Mean ± SD | Right Mean ± SD | Mean difference Left–Right | p-Value | |
| Step length (cm/cm) | 35.97 ± 2.77 | 35.91 ± 2.66 | 0.057 | 0.446 | 35.09 ± 5.51 | 35.24 ± 5.19 | 0.146 | 0.548 |
| Stride length (cm/cm) | 67.98 ± 8.82 | 64.28 ± 9.01 | 3.707 | 0.080 | 65.65 ± 11.91 | 62.48 ± 10.84 | 3.172 | 0.319 |
| Base of support (cm/cm) | 9.23 ± 3.43 | 8.21 ± 2.60 | 1.021 | 0.261 | 9.39 ± 4.76 | 8.99 ± 3.21 | 0.396 | 0.555 |
| Single support (% gait cycle) | 33.85 ± 4.98 | 36.76 ± 4.89 | 2.912 | 0.174 | 35.60 ± 2.97 | 35.59 ± 3.13 | 0.053 | 0.987 |
| Stance duration (% gait cycle) | 63.51 ± 6.33 | 67.60 ± 10.06 | 3.687 | 0.177 | 65.00 ± 6.62 | 63.50 ± 8.08 | 4.937 | 0.225 |
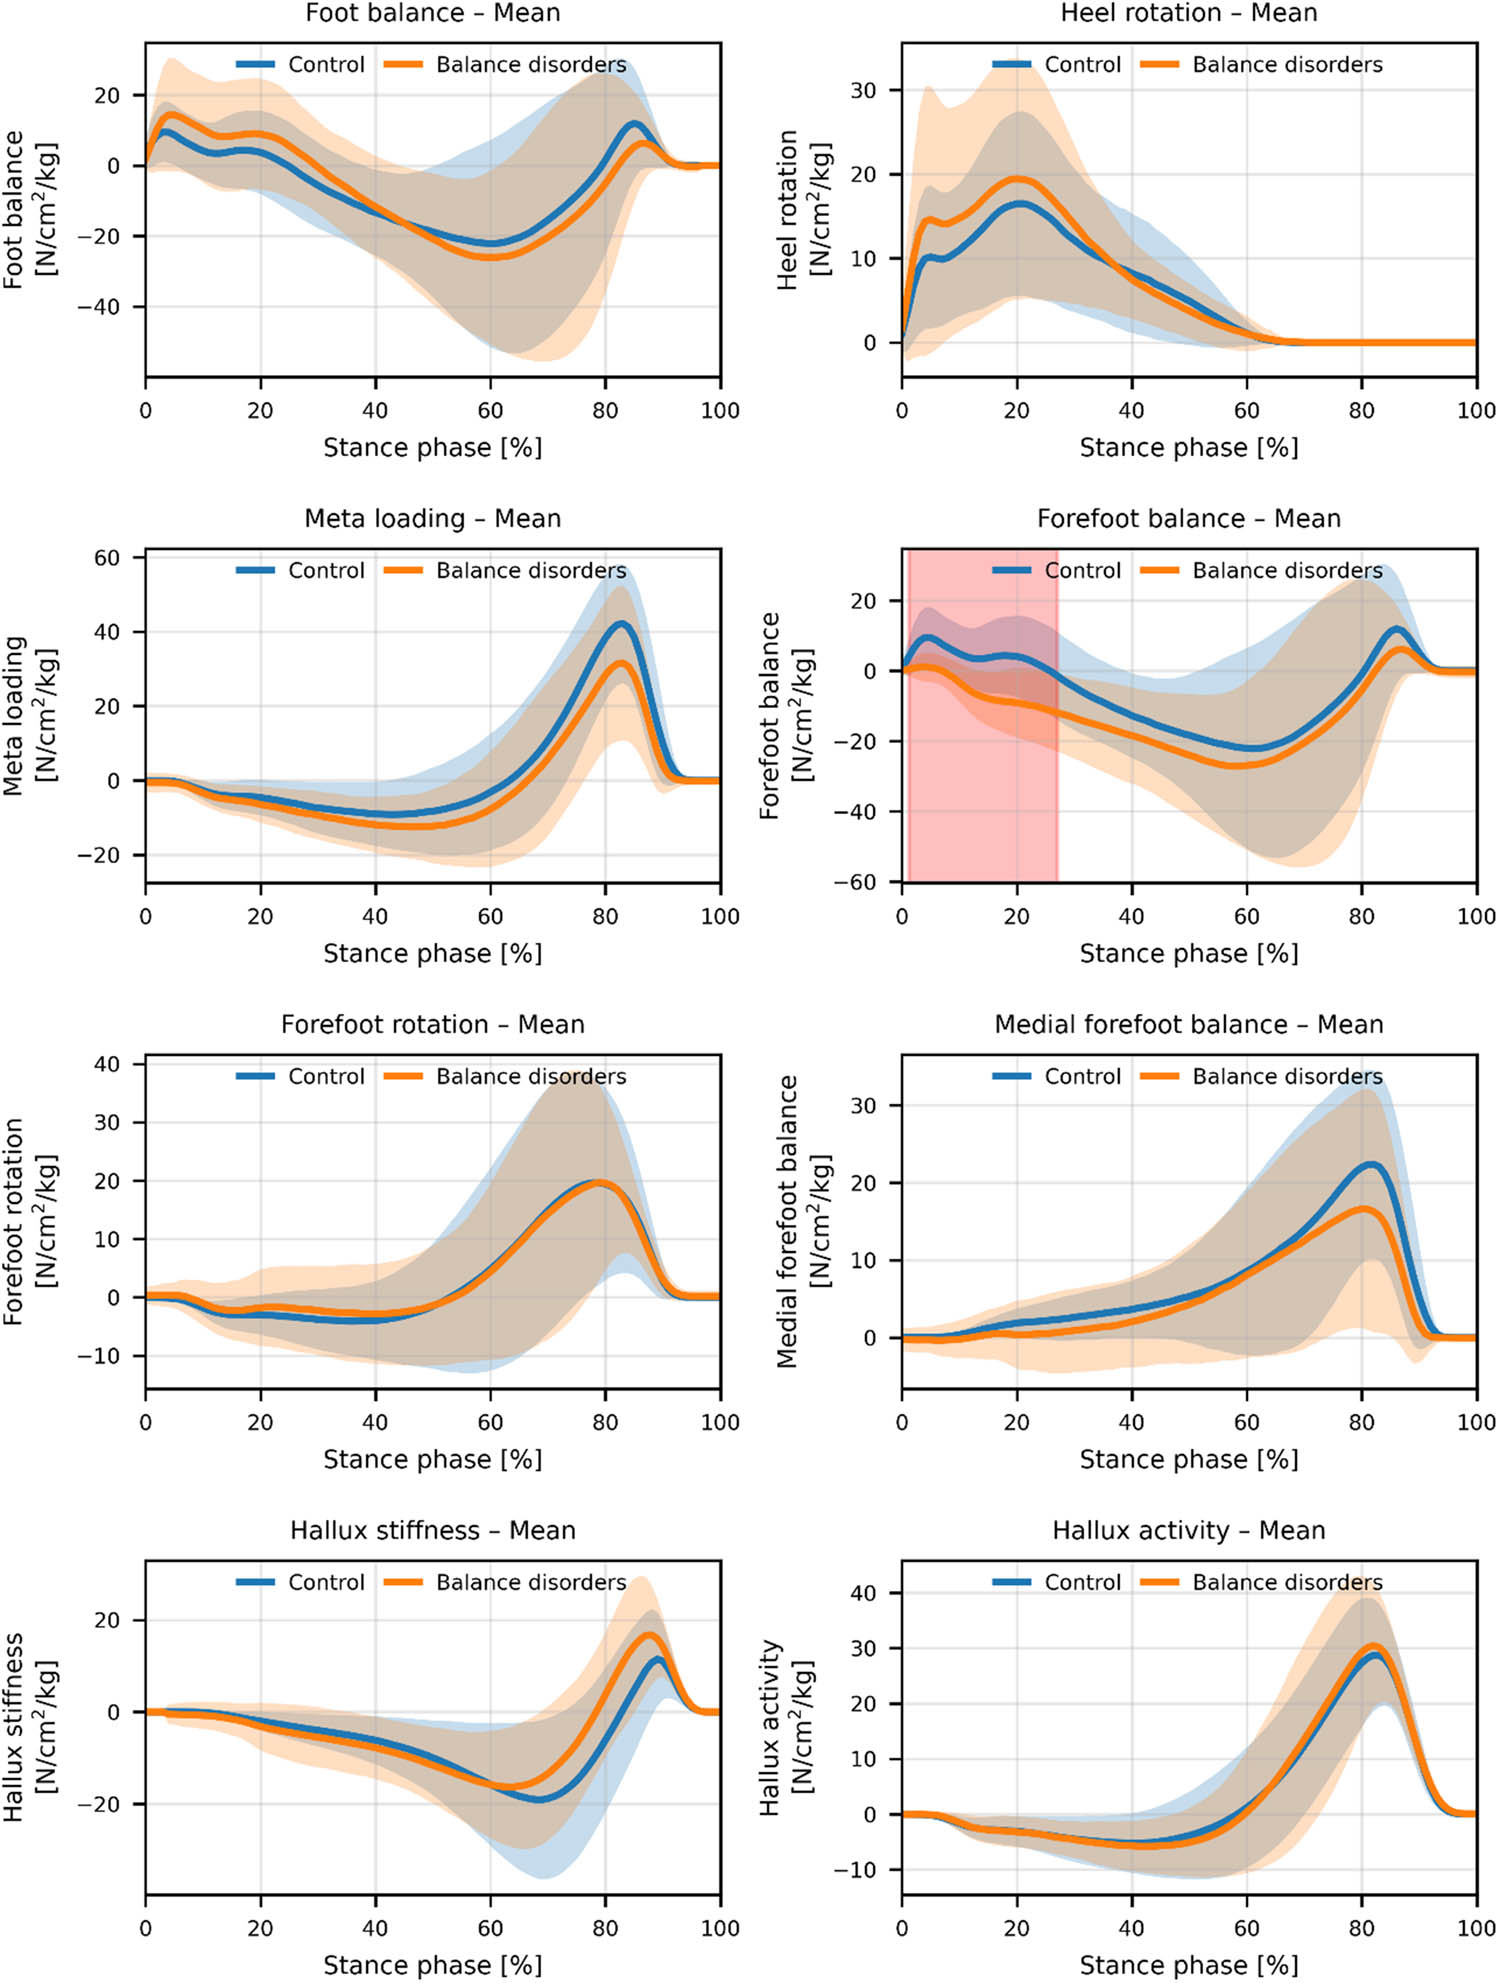
Figure 1
SPM analysis of mean waveforms of dynamic foot balance parameters during the stance phase in the control and balance disorders groups.
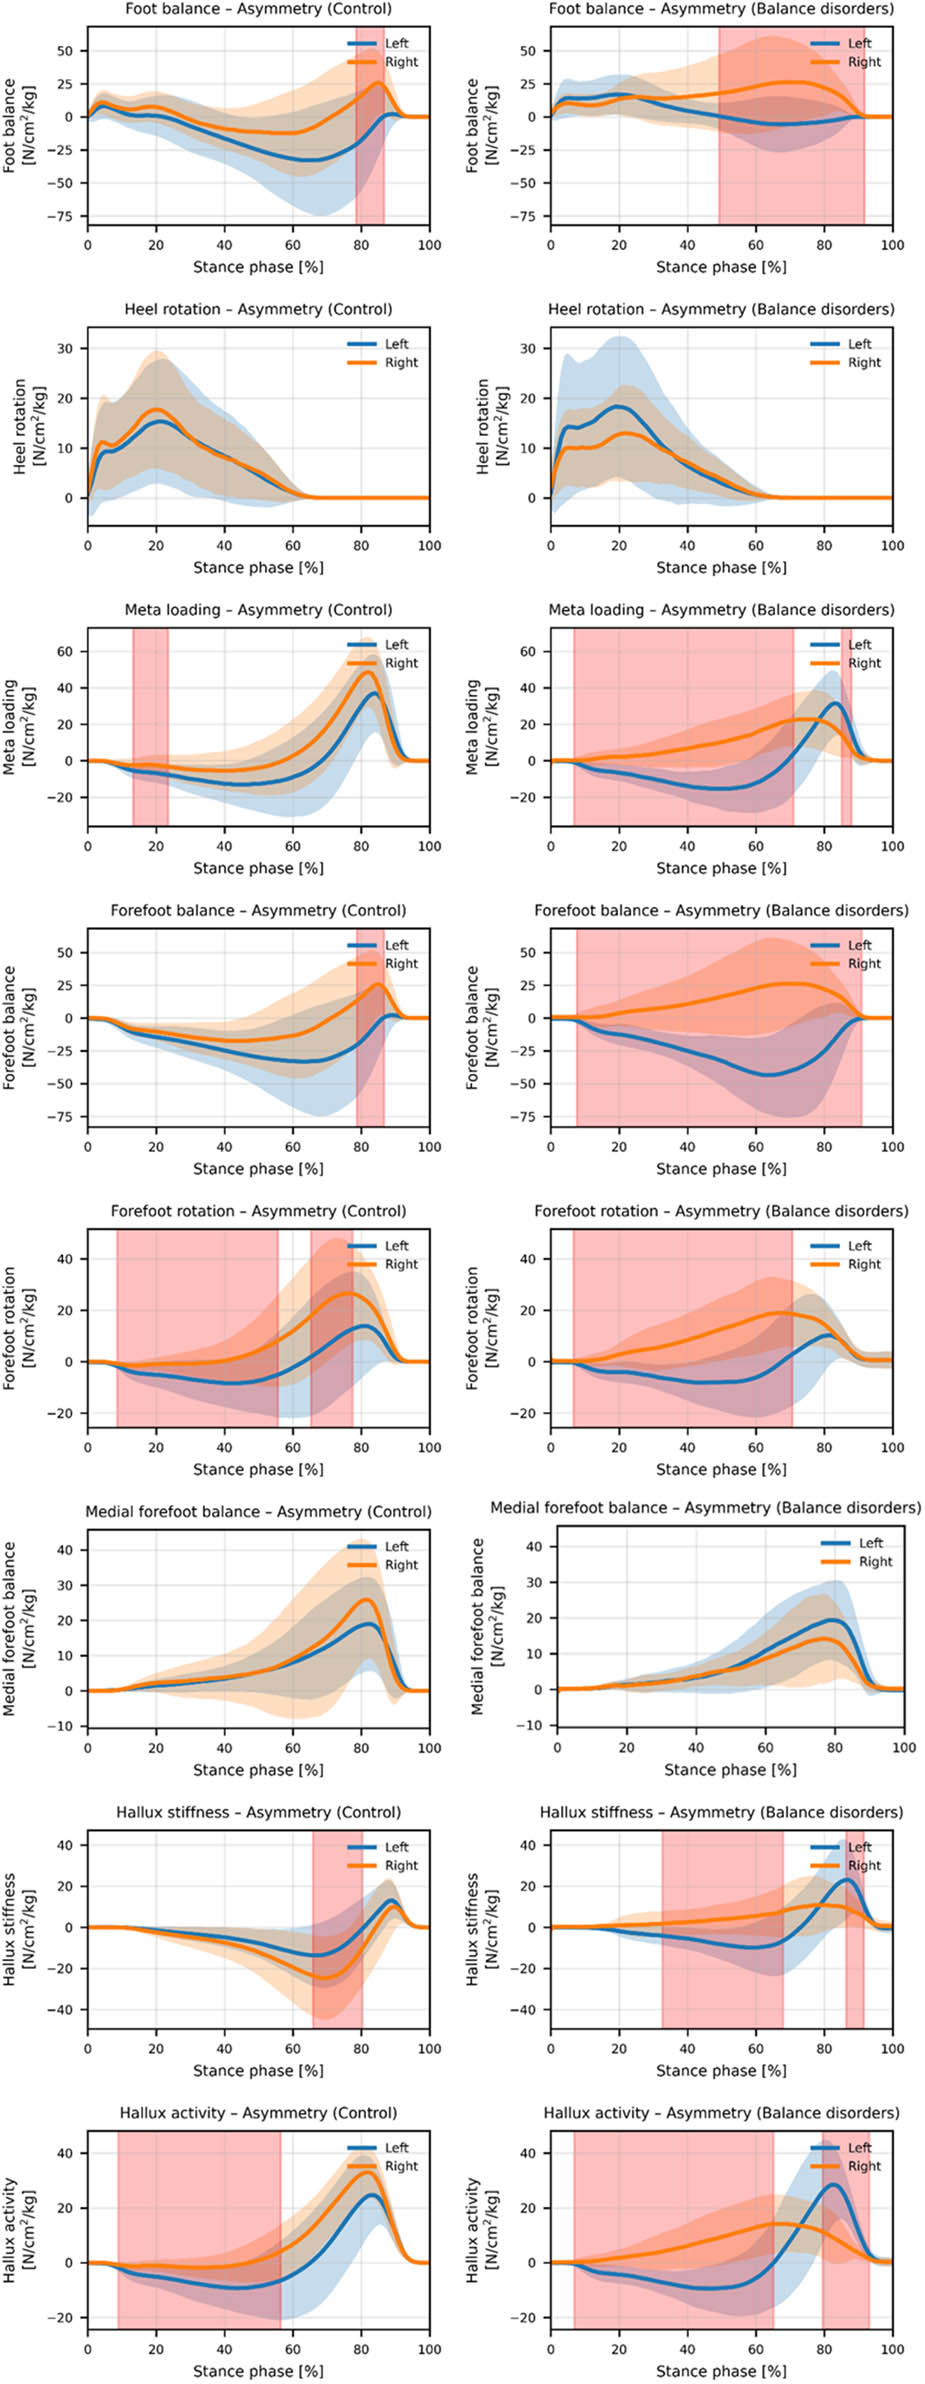
Figure 2
SPM Analysis of left–right limb asymmetry in dynamic foot balance parameters during the stance phase in the control and balance disorders groups.
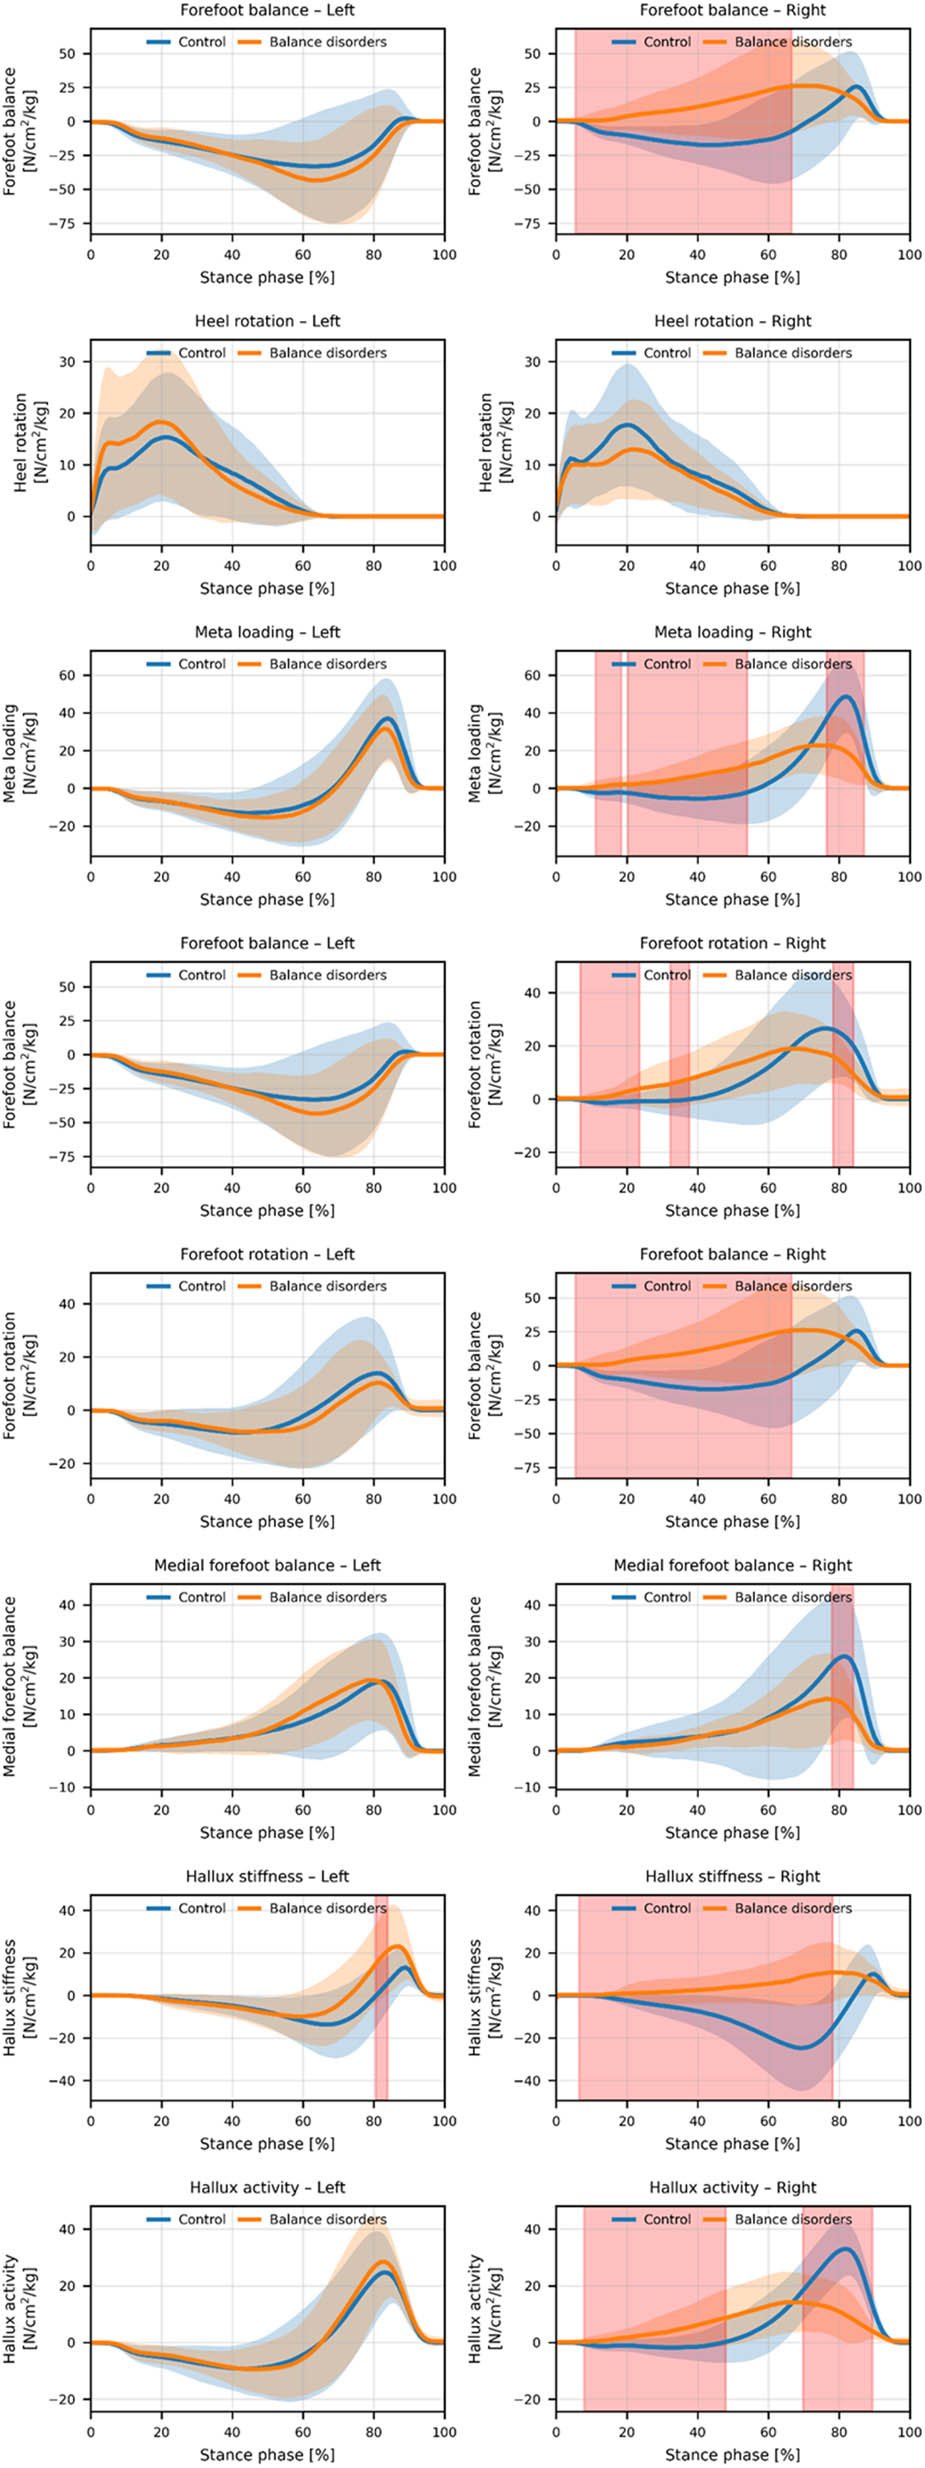
Figure 3
SPM Analysis of limb-matched between-group comparisons (left–left and right–right) of dynamic foot balance parameters during the stance phase in the control and balance disorders groups.