
1. Introduction
Maintaining postural stability is a complex physiological process that requires the continuous integration of sensory inputs from the visual, vestibular, and somatosensory systems [1]. Foot-related impairments have been consistently associated with increased instability and a higher risk of falls in older adults [2,3]. Proprioceptive feedback from the feet plays a critical role in maintaining balance, particularly during walking. With advancing age, this proprioceptive input often decreases, contributing to impaired postural control and increased center of pressure (COP) variability [4,5,6,7,8,9,10,11].
Spatial and temporal gait parameters are fundamental for the assessment of postural control and dynamic stability [12,13,14,15,16,17,18,19]. Spatial variables, such as step length, stride width, and pressure distribution, provide information on the geometric and mechanical aspects of gait related to balance strategies. Temporal parameters, such as the timing and duration of stance and swing phases and the timing of peak forces, reflect gait efficiency and symmetry. Deviations in these parameters have been associated with impaired sensorimotor control and an increased risk of falls in older populations [20].
Together, spatial and temporal gait metrics provide a broader view of dynamic balance and can reveal deficits not seen in static measurements. Normal global spatiotemporal parameters can coexist with subtle impairments in dynamic foot control, which may only be detected using time-dependent plantar pressure analysis [21,22,23].
Despite the growing relevance of dynamic plantar pressure and gait analysis in both clinical and research settings, the current literature provides limited insight into how detailed gait-related parameters differ between older adults with and without balance impairments. While COP measures such as sway path length and velocity during quiet standing have been relatively well studied, there remains a notable lack of comparative data on specific biomechanical variables, including heel rotation, forefoot rotation, hallux stiffness, overall foot balance, medial forefoot balance, metatarsal loading, and hallux activity.
The aim of this study was to address this gap by comparing spatiotemporal gait parameters and dynamic plantar pressure measures between two groups of older adults: those with balance disorders and a history of falls, and those without such impairments. This approach was used to better understand the relationship between foot function, gait characteristics, and balance disorders in older adults.
2. Materials and methods
This section outlines the study design, participant characteristics, experimental protocol, data processing procedures, and statistical analyses used to examine differences in spatiotemporal gait characteristics and dynamic foot balance parameters between older adults with and without balance disorders.
2.1. Participants
The inclusion criteria were as follows: (1) age ≥ 55 years at the time of recruitment; (2) independent walking without the use of assistive devices; (3) no history of orthopedic injury or lower-limb surgery within the preceding six months; (4) no diagnosed neurological conditions known to significantly affect balance; and (5) willingness to participate in both clinical and biomechanical assessments. All participants provided written informed consent before inclusion in the study. The study protocol was approved by the Local Bioethics Committee.
Participants were divided into two groups based on their fall history within the preceding 12 months and their scores on the Dizziness Handicap Inventory (DHI). The balance impairment group included 26 individuals (19 women and 7 men) who met both of the following criteria: a DHI score ≥10 points and a self-reported history of at least one fall in the previous year. The control group included 26 participants (17 women and 9 men) with DHI scores <10 and no reported falls during the same period. Detailed demographic and anthropometric characteristics of the participants, including age, body mass, body height, and BMI, for the overall study groups and separately by sex, are presented in Table 1.
Table 1
Demographic and anthropometric characteristics of participants in the control and balance disorders groups
| Group | Sex | n | Age (years) | Body mass (kg) | Height (cm) | BMI (kg/m²) |
|---|---|---|---|---|---|---|
| Control | Total | 26 | 67.8 ± 5.7 (55–78) | 79.9 ± 12.9 (55–99) | 165.5 ± 8.5 (151–183) | 29.0 ± 3.8 (22–37) |
| Female | 17 | 68.2 ± 5.6 (57–77) | 74.6 ± 12.8 (55–99) | 160.4 ± 4.4 (151–170) | 28.9 ± 4.6 (22–37) | |
| Male | 9 | 66.9 ± 6.3 (55–78) | 89.8 ± 7.2 (77–98) | 175.1 ± 5.3 168–183) | 29.2 ± 1.6 (27–32) | |
| Balance disorders | Total | 26 | 67.4 ± 8.7 (55–82) | 70.4 ± 12.3 (47–91) | 162.3 ± 9.1 (151–187) | 26.5 ± 3.7 (20–35) |
| Female | 19 | 66.3 ± 8.2 (55–80) | 67.2 ± 12.0 (47–91) | 158.4 ± 5.5 (151–170) | 26.6 ± 4.1 (20–35) | |
| Male | 7 | 70.4 ± 9.9 (59–82) | 79.0 ± 7.2 (70–89) | 173.0 ± 8.0 (164–187) | 26.3 ± 2.0 (24–29) |
Values are presented as mean ± standard deviation (range).
2.2. Study protocol
Biomechanical analysis was performed using the Footscan® pedobarographic platform system (Materialise, Belgium) integrated into the floor. The platform dimensions were 2096 mm × 469 mm × 18 mm, with an active sensor area of 1950 mm × 325 mm. Each participant was instructed to walk barefoot along the 9-meter-long path, with the Footscan® platform embedded in the central section, at a self-selected comfortable speed. Walking trials were performed in both directions to minimize potential directional bias. For each participant, a minimum of three valid walking trials were recorded.
2.2.1. Spatiotemporal parameters
A set of spatiotemporal gait parameters was analyzed. The spatial parameters, which reflect the geometric and mechanical characteristics of gait, included: step length, stride length, and base of support. The following temporal gait parameters were extracted: left and right step times, gait cycle duration, single-support duration, double-support duration, stance-phase duration. Spatial gait parameters were normalized to body height to reduce the influence of inter-individual differences in body size. Lower limb length was not assessed in the present study. Therefore, body height was used as an anthropometric measure for normalization.
2.2.2. Dynamic foot balance parameters
In addition to spatiotemporal variables, dynamic foot balance analyses were performed to further characterize gait performance and postural control. These analyses were based on time-dependent patterns of selected parameters derived from plantar pressure recordings. The analyzed parameters were defined in accordance with the Footscan® system methodology [24]. The following dynamic foot balance parameters were analyzed: foot balance, heel rotation, metatarsal loading (meta loading), forefoot balance, forefoot rotation, medial forefoot balance, hallux stiffness, and hallux activity.
For each participant, parameter time series were first computed separately for each trial and for each lower limb. The resulting waveforms were time-normalized to the stance phase and averaged across trials for each limb, and subsequently averaged across both limbs to obtain a single representative waveform for each participant. To ensure inter-subject comparability, all pressure-related values were normalized to body mass. Finally, individual waveforms were averaged within each group to derive group-level mean profiles. Time series data were resampled to 100 evenly spaced points corresponding to 0–100% of the stance phase.
2.3. Statistical analysis
Python scripts were used for signal preprocessing, normalization procedures, step averaging, variability computations, and the implementation of all statistical tests, including scalar between-group and within-group comparisons as well as waveform-based Statistical Parametric Mapping (SPM) analyses.
2.3.1. Spatiotemporal parameters
Between-group comparisons were conducted for scalar spatiotemporal gait parameters derived from cycle-averaged values. To enhance inter-subject comparability, spatiotemporal parameters were normalized to body height where appropriate. The resulting values were subsequently scaled by a factor of 100 to improve numerical interpretability. Normality of parameter distributions within each group was assessed using the Shapiro–Wilk test. When normality was satisfied in both groups, Welch’s t-test was applied, as it does not assume equal variances. When normality was violated in at least one group, the non-parametric Mann–Whitney U test was used.
Within each group, left–right gait asymmetry was examined using paired statistical tests. Normality of left–right differences was assessed using the Shapiro-Wilk test. When normality was met, paired t-tests were applied; otherwise, the Wilcoxon signed-rank test was used.
Between-group comparisons of spatiotemporal parameters were performed without correction for multiple comparisons and should therefore be interpreted as exploratory. For within-group left–right asymmetry analyses, p-values were adjusted using the Holm–Bonferroni procedure to control for multiple testing within each group.
2.3.2. Dynamic foot balance parameters
To ensure inter-subject comparability, all pressure-related signals were normalized to body mass. The normalized signals were subsequently scaled by a factor of 100 to improve numerical interpretability. Signals were subsequently time-normalized to 0–100% of the stance phase using linear interpolation.
All waveform analyses were performed using SPM for one-dimensional continuous data. Prior to each SPM analysis, only regions of the stance phase exhibiting non-zero variance in all compared conditions were included, ensuring numerical stability and validity of the statistical tests. Statistical significance was set at α = 0.05.
Between-group differences were assessed for mean waveforms. Differences in mean waveforms between the control and balance disorders groups were evaluated using an SPM-based two-sample Welch’s t-test with a two-tailed hypothesis, as no a priori directional assumption was made.
To assess gait asymmetry, within-group comparisons between the right and left lower limbs were conducted separately for each group. A paired SPM t-test was applied to the limb-difference waveform to determine whether left–right differences deviated significantly from zero across the stance phase. All asymmetry analyses were performed using two-tailed tests with α = 0.05.
3. Results
The results include scalar spatiotemporal parameters and time-normalized dynamic foot balance measures, providing complementary information on overall gait performance as well as stance-phase-specific differences.
3.1. Spatiotemporal parameters
Table 2 summarizes the spatiotemporal gait parameters for the control group and the balance disorders group. Between-group comparisons were conducted to identify potential global differences in spatial and temporal gait characteristics.
Table 2
Comparison of spatiotemporal gait parameters between the control and balance disorders groups
| Parameter | Group | p-Value | ||||
|---|---|---|---|---|---|---|
| Control (n = 26) | Balance disorders (n = 26) | |||||
| Mean ± SD | Min–Max | Mean ± SD | Min–Max | |||
| Spatial | Step length (cm/cm) | 35.94 ± 2.65 | 30.62–40.31 | 35.17 ± 5.19 | 26.17–45.68 | 0.510 |
| Stride length (cm/cm) | 66.78 ± 8.14 | 48.45–80.03 | 64.12 ± 10.33 | 48.34–81.18 | 0.320 | |
| Base of support (cm/cm) | 8.51 ± 2.70 | 5.05–12.72 | 8.57 ± 3.75 | 0.96–14.91 | 0.949 | |
| Temporal | Single support (% gait cycle) | 35.06 ± 2.03 | 29.39–37.63 | 35.595 ± 2.97 | 31.601–43.193 | 0.855 |
| Double support (% gait cycle) | 21.27 ± 5.88 | 12.63–29.50 | 26.46 ± 12.55 | 13.92–63.49 | 0.201 | |
| Stance duration (% gait cycle) | 64.75 ± 5.87 | 53.767–78.717 | 65.00 ± 6.62 | 78.930–53.715 | 0.899 | |
No statistically significant between-group differences were observed for any of the analyzed spatiotemporal gait parameters. Overall, both groups demonstrated comparable spatial and temporal gait characteristics when assessed using global, cycle-averaged measures.
Table 3 presents the within-group comparisons of left–right asymmetry in spatiotemporal gait parameters for the control group and the balance disorders group.
Table 3
Comparison of within-group left–right asymmetry of spatiotemporal gait parameters
| Parameter | Group | |||||||
|---|---|---|---|---|---|---|---|---|
| Control (n = 26) | Balance disorders (n = 26) | |||||||
| Left Mean ± SD | Right Mean ± SD | Mean difference Left–Right | p-Value | Left Mean ± SD | Right Mean ± SD | Mean difference Left–Right | p-Value | |
| Step length (cm/cm) | 35.97 ± 2.77 | 35.91 ± 2.66 | 0.057 | 0.446 | 35.09 ± 5.51 | 35.24 ± 5.19 | 0.146 | 0.548 |
| Stride length (cm/cm) | 67.98 ± 8.82 | 64.28 ± 9.01 | 3.707 | 0.080 | 65.65 ± 11.91 | 62.48 ± 10.84 | 3.172 | 0.319 |
| Base of support (cm/cm) | 9.23 ± 3.43 | 8.21 ± 2.60 | 1.021 | 0.261 | 9.39 ± 4.76 | 8.99 ± 3.21 | 0.396 | 0.555 |
| Single support (% gait cycle) | 33.85 ± 4.98 | 36.76 ± 4.89 | 2.912 | 0.174 | 35.60 ± 2.97 | 35.59 ± 3.13 | 0.053 | 0.987 |
| Stance duration (% gait cycle) | 63.51 ± 6.33 | 67.60 ± 10.06 | 3.687 | 0.177 | 65.00 ± 6.62 | 63.50 ± 8.08 | 4.937 | 0.225 |
No statistically significant left–right asymmetries were detected in either group. These findings indicate that gait patterns were largely symmetrical at the level of spatiotemporal parameters in both the control group and the balance disorders group.
3.2. Dynamic foot balance parameters
Figure 1 presents an overview of between-group comparisons of mean time-normalized temporal and plantar-pressure-derived waveforms, illustrating overall gait patterns in the control group and in participants with balance disorders.
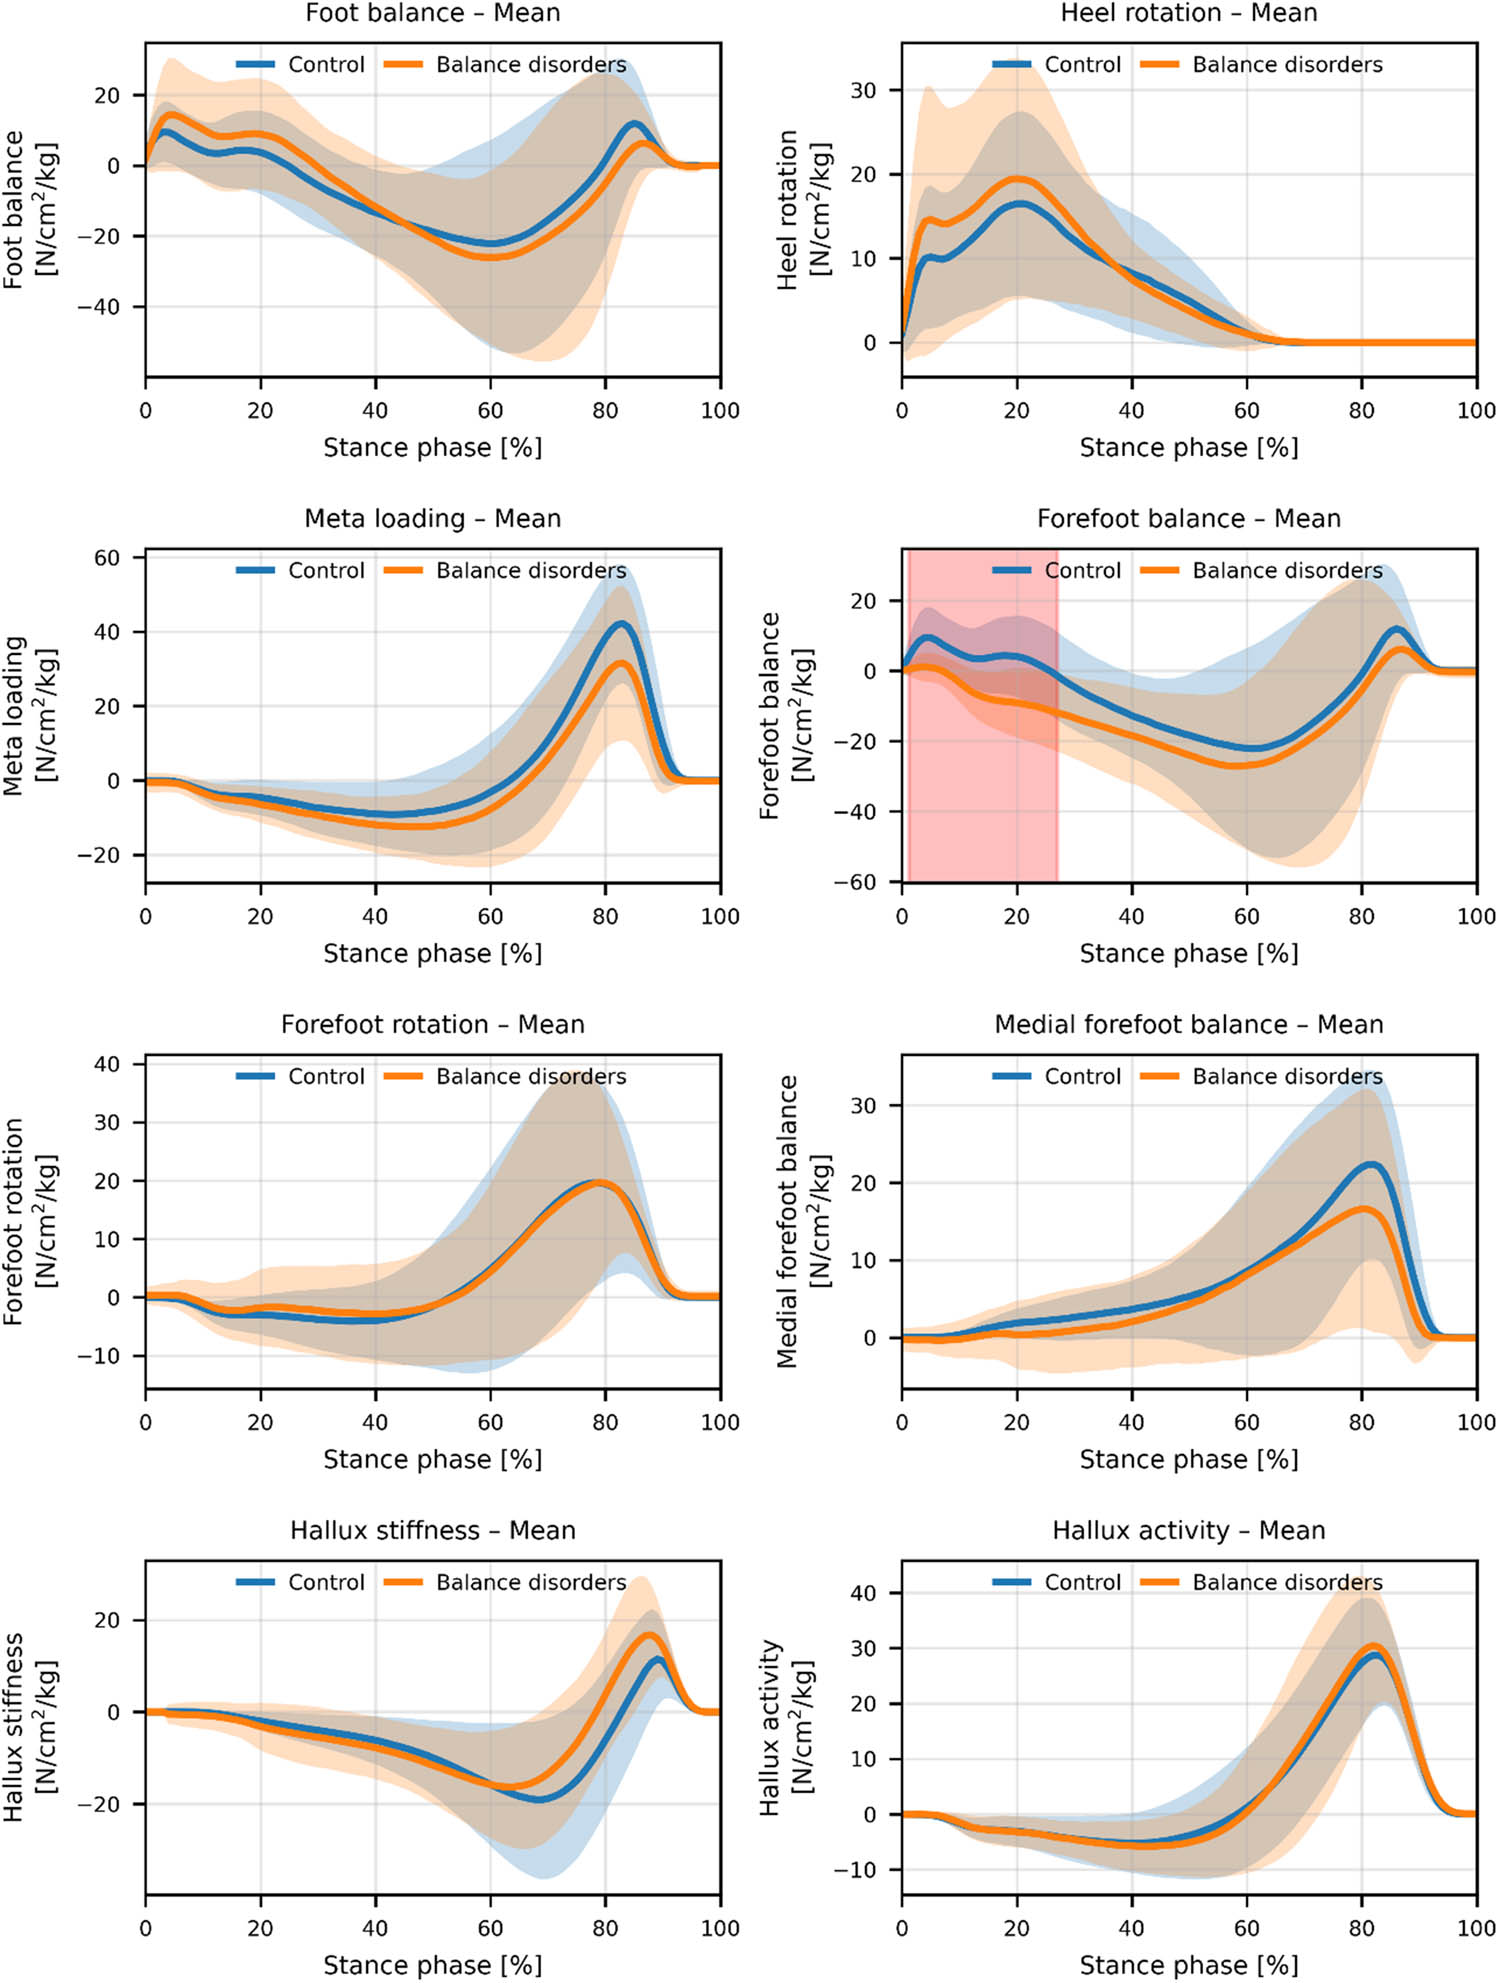
Figure 1
SPM analysis of mean waveforms of dynamic foot balance parameters during the stance phase in the control and balance disorders groups.
Analysis of the mean time-normalized waveforms showed largely comparable overall waveform shapes between the control group and participants with balance disorders across the stance phase. However, SPM identified a statistically significant stance-phase interval during early stance for the forefoot balance parameter. Outside this early stance interval, no statistically significant between-group differences were detected for the remaining dynamic foot balance parameters.
Figure 2 presents within-group comparisons between the left and right lower limbs, allowing for the assessment of gait asymmetry across the stance phase in both groups.
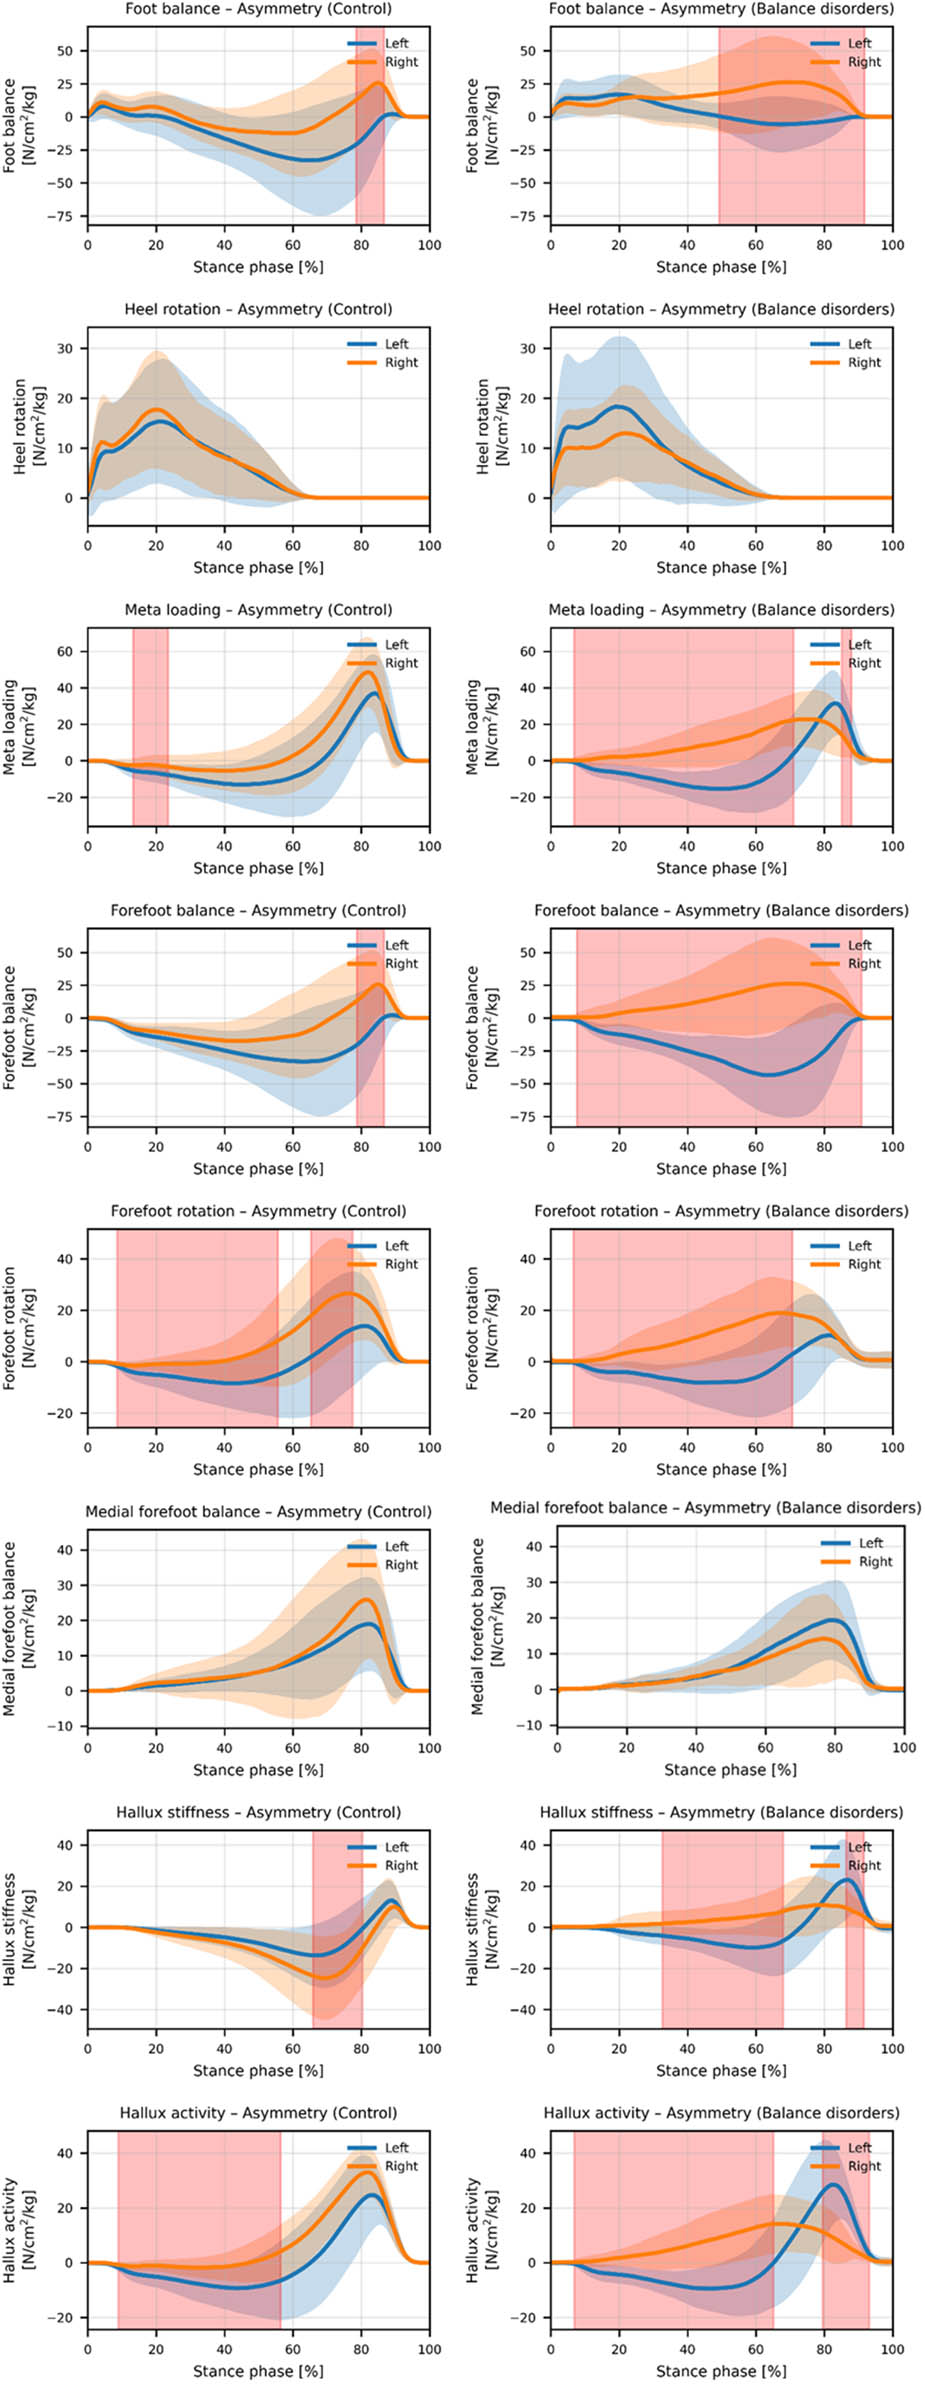
Figure 2
SPM Analysis of left–right limb asymmetry in dynamic foot balance parameters during the stance phase in the control and balance disorders groups.
Qualitative inspection of the asymmetry waveforms suggests that, in participants with balance disorders, left–right differences were more frequently associated with forefoot-related loading patterns rather than with heel mechanics. In particular, the right foot exhibited a tendency toward increased and earlier central-to-medial forefoot loading, as reflected by the metatarsal loading, forefoot rotation, and forefoot balance parameters. Additionally, reduced hallux-related contributions during terminal stance were observed in the right limb. These features may indicate altered forefoot function and modified load transfer during push-off, potentially reflecting reduced shock absorption capacity.
Given the presence of parameter- and phase-specific left–right asymmetries identified in the within-group analyses, an additional set of comparisons was performed to further explore limb-specific behavior. Specifically, dynamic foot balance waveforms were compared between corresponding limbs across groups (left–left and right–right) to examine whether group differences were preferentially associated with one limb. This complementary analysis was intended to clarify whether the observed asymmetries reflected generalized bilateral alterations or limb-dominant differences in dynamic foot balance control. The results of these limb-matched comparisons are presented in Figure 3.
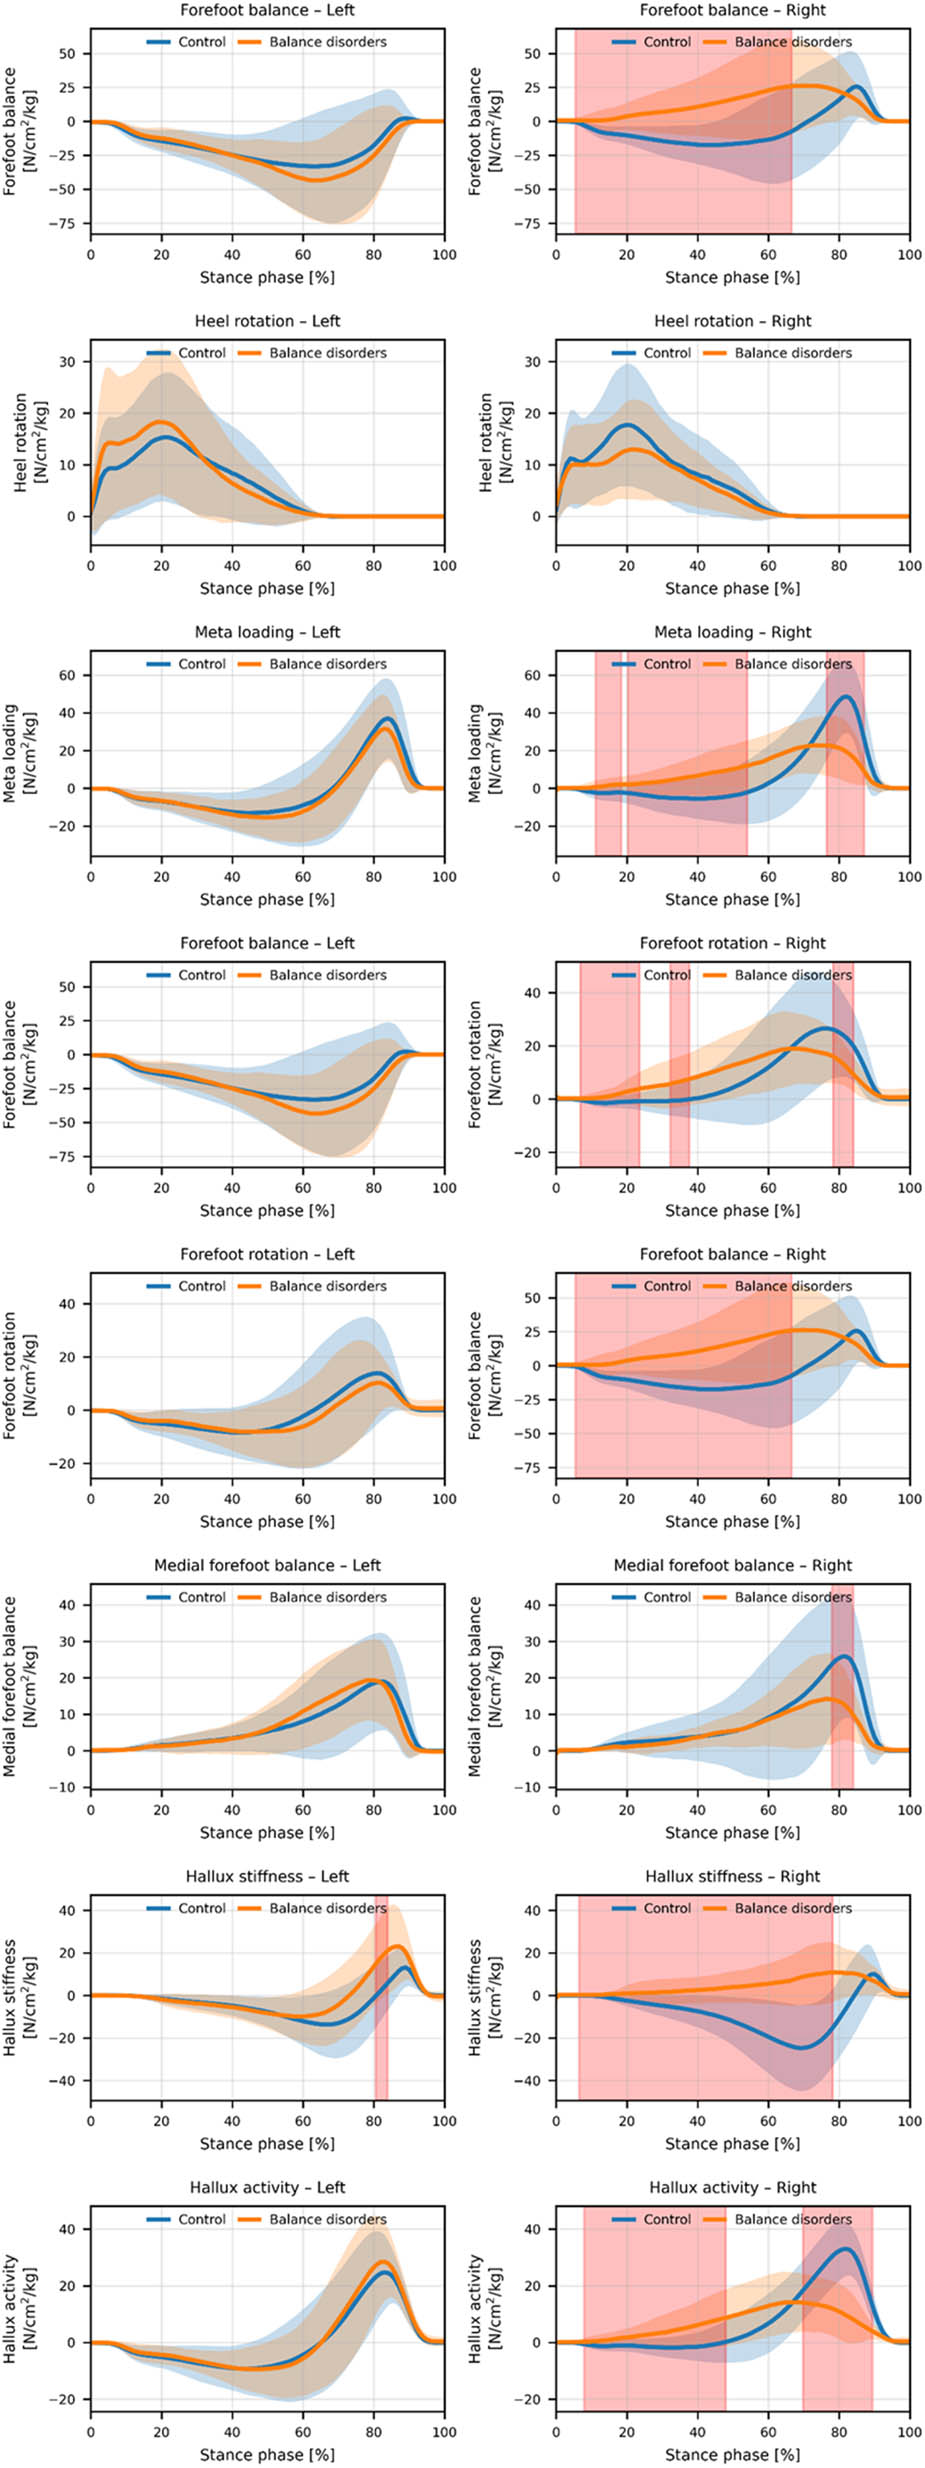
Figure 3
SPM Analysis of limb-matched between-group comparisons (left–left and right–right) of dynamic foot balance parameters during the stance phase in the control and balance disorders groups.
Limb-matched between-group comparisons revealed statistically significant stance-phase intervals predominantly for the right lower limb across several dynamic foot balance parameters. These differences were most frequently observed in forefoot- and hallux-related measures, which may suggest a more limb-specific alteration of distal load distribution in participants with balance disorders. Significant intervals occurred mainly during early-to-mid stance and, for selected parameters, during terminal stance. In contrast, the left lower limb exhibited few or no statistically significant between-group differences across the analyzed parameters. No statistically significant differences were detected for heel rotation in either limb, suggesting largely comparable heel loading patterns between groups.
4. Discussion
The present study aimed to investigate differences in spatiotemporal gait characteristics and dynamic foot balance parameters between older adults with and without balance disorders using pressure-based gait analysis. For this reason, conventional scalar gait measures were analyzed alongside waveform-based SPM to examine both overall gait characteristics and stance-phase–specific behavior.
4.1. Spatiotemporal gait parameters and global gait characteristics
Despite documented balance impairments, participants with balance disorders in this study walked with spatiotemporal characteristics comparable to those of the control group during steady-state walking. Similar findings have been reported previously in older adults assessed under comparable walking conditions [21,23]. Key parameters such as step length, stride length, step time, and support phase durations did not differ between groups, indicating that global gait characteristics alone may be insufficient to discriminate individuals with balance impairments under relatively controlled walking conditions.
Previous studies have similarly shown that older adults with balance deficits or a history of falls may present largely preserved spatiotemporal gait patterns during unconstrained walking [25]. One possible explanation is that participants with balance disorders consciously regulated their gait during the trials, which may have reduced observable differences in global parameters. Similar compensatory strategies related to increased attentional control during walking have been described previously [26,27].
Within-group analyses revealed no significant left–right asymmetries in spatiotemporal parameters after correction for multiple comparisons, indicating preserved global gait symmetry in both groups. This finding is consistent with previous reports showing that spatiotemporal symmetry measures may remain unchanged even in populations with balance impairments, particularly during straight-line walking [28]. The present results indicate that spatiotemporal parameters alone were not sufficient to differentiate between groups in this experimental setting.
An additional factor that should be considered when interpreting the results is that all assessments were performed during barefoot walking. Walking without footwear may alter gait mechanics and sensory feedback from the plantar surface of the foot, particularly in older adults with balance impairments. Therefore, the observed gait characteristics may not fully reflect everyday walking conditions, which typically involve the use of footwear. Nevertheless, barefoot assessment allowed standardized measurement conditions across all participants and minimized potential confounding effects related to differences in footwear.
4.2. Dynamic foot balance parameters and waveform-based analyses
In contrast to scalar spatiotemporal measures, waveform-based analyses of dynamic foot balance parameters provide a more detailed characterization of foot-ground interactions throughout the stance phase. In the present study, group-averaged mean waveforms did not show statistically significant between-group differences when assessed using SPM. The lack of between-group differences in group-averaged waveforms suggests that balance disorders are not associated with uniform alterations in plantar pressure distribution during walking, as also reported in earlier pressure-based gait studies [29].
Inspection of individual waveforms revealed noticeable differences in signal magnitude and variability in participants with balance disorders, particularly during mid- and terminal stance. Although these trends did not reach statistical significance, similar phase-dependent alterations in plantar loading have been observed in older adults at increased risk of falls, suggesting subtle adaptations in load distribution during stance [30,31]. Such adaptations may reflect compensatory strategies aimed at maintaining stability rather than clear biomechanical deficits.
The within-group asymmetries observed in this study indicate that balance disorders may be reflected in localized and individual-specific changes in foot–ground interaction rather than in global gait structure. Previous studies have shown that age-related balance disorders are often associated with greater gait variability and subtle irregularities rather than consistent changes in global gait parameters [15,32,33]. Dynamic foot balance parameters reflect changes in loading across the stance phase and may help detect these alterations. The lack of consistent between-group differences in limb-specific analyses and the parameter-specific asymmetries observed suggest individual differences in foot function during walking. These differences may be influenced by pre-existing structural or degenerative factors [34,35,36].
In contrast to the observed within-group asymmetries, side-specific between-group analyses provide additional support for this interpretation. Separate comparisons of the left and right limbs did not reveal consistent phase-dependent differences between groups. This suggests that balance-related gait alterations are not limited to a single or dominant limb. In the present data, balance disorders were associated with greater variability in motor control strategies, without a consistent side-specific pattern across participants. As a result, averaging waveforms across participants likely reduced the visibility of limb-specific adaptations that differed in direction and magnitude between individuals.
These observations are consistent with reported findings [8], which reported significant left–right asymmetries in knee muscle torques in older adults with balance disorders, particularly in knee extensors. The present results extend these observations from static and quasi-static balance tasks to dynamic gait conditions. In some individuals, asymmetries at the proximal joint level may be reflected as localized plantar pressure asymmetries during walking. Nevertheless, direct causal relationships between proximal joint asymmetries and plantar pressure patterns cannot be established. The lack of a uniform asymmetry pattern across both studies further supports the notion that balance disorders may be characterized by variable and compensatory neuromuscular control strategies rather than by fixed biomechanical deficits. These results suggest that combining proximal joint assessments with time-resolved plantar pressure analysis may help identify subtle balance-related gait alterations that are not evident in global spatiotemporal measures.
These asymmetry findings should be interpreted with caution. While SPM inherently controls the family-wise error rate across the time domain, the absence of correction across multiple parameters limits the strength of confirmatory conclusions. Accordingly, the observed asymmetries should be treated as hypothesis-generating rather than definitive evidence of impaired gait symmetry.
From a biomechanical perspective, parameter- and phase-specific asymmetries were observed without global gait changes. This suggests that balance disorders mainly affect fine control of foot loading rather than overall gait structure. Such subtle changes may represent early or compensatory signs of balance dysfunction and could become more evident under more challenging walking conditions.
5. Conclusions
In this study, older adults with balance disorders showed no differences in spatiotemporal gait parameters or group-averaged dynamic foot balance waveforms during steady-state walking. These findings suggest that conventional global gait measures may have limited sensitivity for detecting balance-related impairments in this population.
In contrast, exploratory waveform-based analyses revealed parameter- and phase-specific left–right asymmetries in dynamic foot balance parameters, particularly among participants with balance disorders. These asymmetries were not consistent across all parameters and should be interpreted cautiously. However, they highlight the potential value of plantar pressure analysis for identifying subtle gait alterations not captured by traditional metrics.
The present results indicate that balance-related gait alterations in older adults are more likely to appear in localized and individual-specific features than in global spatiotemporal parameters. Future work using more challenging gait tasks or repeated assessments may help determine the clinical relevance of the observed asymmetries.
6. Limitations of the study
This study has several limitations. First, participants’ habitual physical activity levels were not assessed, although physical activity may influence balance performance and gait characteristics. Second, the relatively small sample size may have limited the statistical power to detect subtle between-group differences. Third, participant classification was based on self-reported fall history and DHI scores. Self-reported fall history may be subject to recall bias, and these criteria do not provide a comprehensive assessment of balance impairment. In addition, walking speed was not recorded as a separate outcome measure. As gait speed may influence spatiotemporal and plantar-pressure parameters, its potential effect on the observed results cannot be excluded. Finally, gait was evaluated during barefoot walking under controlled laboratory conditions, which may not fully reflect everyday locomotor challenges. Therefore, the findings should be interpreted with caution and confirmed in larger studies incorporating objective balance assessments and more demanding walking tasks.
Acknowledgements
The study protocol was approved by the Bioethics Committee of the Medical University of Bialystok (approval number APK.002.330.2022).
Funding information
This research was funded by the National Center for Research and Development, as a part of the governmental ‘Accessibility Plus’ program competition entitled ‘Things are for people’. Project: ‘Mechatronic device to assist inmaintaining balance during locomotionwith function of recording gait kinematic parameters’, grant no. Rzeczy są dla ludzi/0009/2020-00.
Author contributions
PP and SP conceived the study. PP, ZBW, and SP developed the methodology and performed the formal analysis. PP developed the software, curated the data, prepared the visualizations, and drafted the manuscript. PP, ŁM, ZBW, and SP participated in validation. PP and ŁM carried out the investigation. ŁM, ZBW, and SP provided resources. PP, ŁM, ZBW, and SP reviewed and edited the manuscript. ZBW and SP supervised the research. SP coordinated the project and acquired funding. All authors read and approved the final manuscript.
Conflict of interest statement
Authors state no conflict of interest.
Data availability statement
The data supporting the findings of this study are available from the corresponding author upon reasonable request. The data are not publicly available due to privacy and ethical restrictions.