
1. Introduction
Birmingham hip resurfacing (BHR) arthroplasty was developed as a bone-conserving alternative to total hip arthroplasty (THA) for younger, physically active patients with end-stage hip osteoarthritis. In contrast to conventional THA, which involves resection of the femoral head and implantation of a stemmed component into the medullary canal, BHR preserves most of the native femoral head and neck. A metal cap is placed over the reshaped femoral head and articulates with a metal acetabular component. This design maintains more physiological load transfer through the proximal femur, preserves bone stock for potential future revision, and allows a larger head size with lower dislocation risk compared with standard THA [1,2]. Long-term registry and cohort studies have confirmed durable survivorship of BHR in appropriately selected patients, with 10- to 20-year survival rates exceeding 94% in male patients, with less favorable outcomes reported in women [3,4,5].
The surgical procedure for BHR differs from THA not only in implant design but also in the technical demands placed on the surgeon. Following hip exposure, the femoral head is preserved and a guidewire is inserted along the intended head-neck axis. The head is then prepared using cannulated reamers or milling devices centered on this guidewire, and a metal resurfacing component is cemented or press-fitted onto the prepared surface. Because most of the native femoral neck is retained, the accuracy of the guidewire trajectory and resulting component orientation is critical. Malalignment increases the risks of femoral neck fracture, edge loading, and early failure [6,7,8]. Femoral neck fracture is among the most serious of these complications, with registry data indicating an incidence of approximately 1–2%, with higher risk in women and in patients with smaller femoral heads [8]. Shimmin and Back, as well as Davis et al., demonstrated that varus placement of the femoral component increases bending stresses in the femoral neck and is strongly associated with fracture, whereas valgus alignment appeared protective; superior cortical notching was identified as a further risk factor [6,8]. Malalignment of the metal-on-metal bearing can also lead to edge loading and elevated metal ion release [6,8].
Achieving precise alignment is further complicated by considerable anatomical variability of the proximal femur. Neck-shaft angle, femoral offset, head diameter, neck length, and anteversion show wide inter-individual variation and may be further distorted by developmental dysplasia, previous trauma, or degenerative changes. Clinical series indicate that outcomes are more predictable in younger men with larger femoral heads and relatively normal anatomy [1,2]. In more challenging anatomies, the safe corridor for a guidewire through the neck is narrower and the tolerance for angular error is reduced. These difficulties are compounded by the confined surgical exposure, through which the surgeon must infer the three-dimensional (3D) course of the neck from limited visual and tactile information [9].
Several strategies have been proposed to assist surgeons with these challenges. The simplest approach relies on free-hand placement of the femoral guidewire, based on visual and tactile assessment of the femoral neck. However, its accuracy is highly dependent on the surgeon’s experience, and several studies have linked free-hand techniques to higher rates of varus positioning, cortical notching, and femoral neck fracture [6,8,9]. To provide more structure, various mechanical alignment guides and jigs have been developed for BHR. These devices can improve consistency compared with purely free-hand placement, but they are usually based on average geometries and do not account for patient-specific anatomical variation [6,8,9].
Computer-assisted navigation and preoperative 3D planning based on computed tomography (CT) data have shown promise in improving accuracy. Multiple studies have demonstrated that computer-assisted navigation reduces varus malpositioning and notching in hip resurfacing, with angular deviations 3–7° smaller than those of conventional jig-based techniques [10,11,12,13,14]. CT-based planning allows individualized reconstruction of the pelvis and femur, enabling more accurate assessment of deformity, implant sizing, and component positioning than conventional two-dimensional templating [15]. Building on 3D planning and advances in additive manufacturing have enabled the production of patient-specific instruments (PSI) and 3D-printed anatomical models [16]. However, existing PSI workflows are often labor-intensive, and even in the most advanced approaches, the identification of key anatomical axes typically remains a manual or semi-automated step [17,18]. Kunz et al. [18] achieved a mean angular deviation of 1.14° from the planned trajectory using individualized 3D-printed drill templates, yet the geometric axis was defined by the operator during the planning phase. Although navigation systems have been shown to improve accuracy and reproducibility of femoral component positioning, especially during the learning curve [19,20], they require dedicated hardware, additional intraoperative setup, and specialized training, which have limited widespread adoption.
Each of these approaches, however, has limitations. Free-hand and jig-based methods remain vulnerable to anatomical variability. Navigation improves alignment but at the cost of complexity and equipment. CT-based 3D planning and PSI workflows typically treat the determination of the femoral head-neck axis as an implicit, operator-dependent step rather than an explicit, reproducible computation [17,18]. Accurate definition of anatomical reference points and axes is a well-recognized challenge in computer-assisted musculoskeletal analysis, with studies demonstrating that downstream biomechanical assessments are sensitive to how geometric references are defined [21]. This work presents a parametric computational method for algorithmic determination of the femoral head-neck axis from CT-derived 3D models. Its feasibility for preoperative planning and patient-specific instrumentation is evaluated.
2. Materials and methods
2.1. Input data acquisition and preprocessing
The algorithm requires a three-dimensional femoral model in Standard for the Exchange of Product model data (STEP) format as input. This model is derived from CT imaging through segmentation, surface reconstruction, and format conversion (Digital Imaging and Communications in Medicine → Standard Triangle Language → STEP), with artifact reduction applied at each stage using standard filtering techniques [22]. The choice of segmentation software can influence model accuracy [23]. The input model should encompass only the proximal femur – the femoral head, neck, and both trochanters – sectioned approximately 15 mm distal to the lesser trochanter (Figure 1a), and must exhibit complete and uniform solid filling to ensure correct algorithmic operation (Figure 1b).
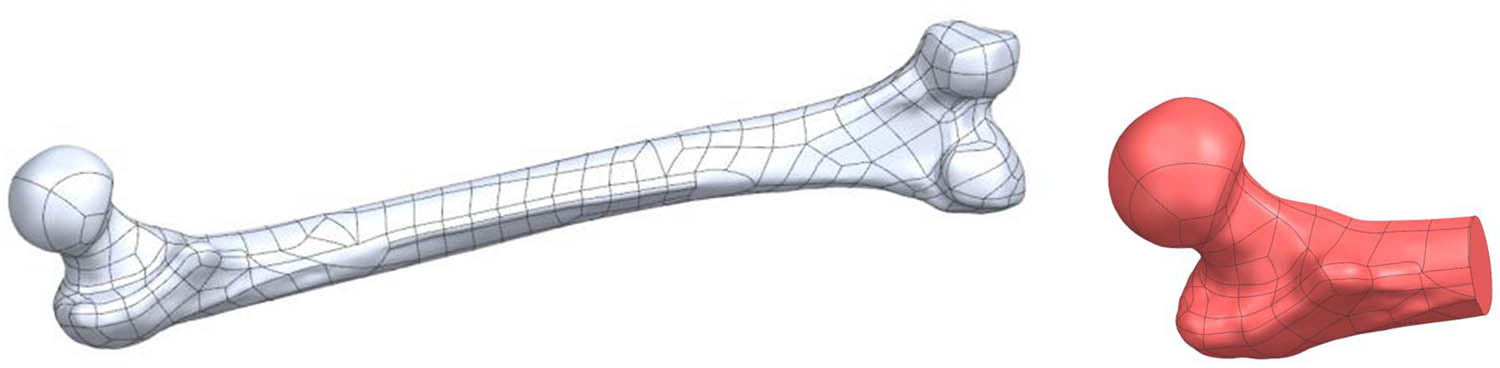
Figure 1
(a) Input geometry – full femoral model; (b) working geometry – proximal femur.
2.2. Algorithmic determination of the femoral head-neck axis
2.2.1. Input data preparation
The algorithm accepts a three-dimensional model in STEP format as input. Prior to calculations, the model is cleaned of surface errors and discontinuities to ensure solid coherence. The object is then translated to a coordinate system with its center of gravity positioned at the origin (0,0,0). This simplifies subsequent transformations and eliminates requirements for additional translation and rotation calculations.
2.2.2. Determination of local reference systems
Basic working planes (Figure 2) are defined for the object. Local coordinate systems are created, whose position and orientation are determined using a homogeneous transformation matrix.
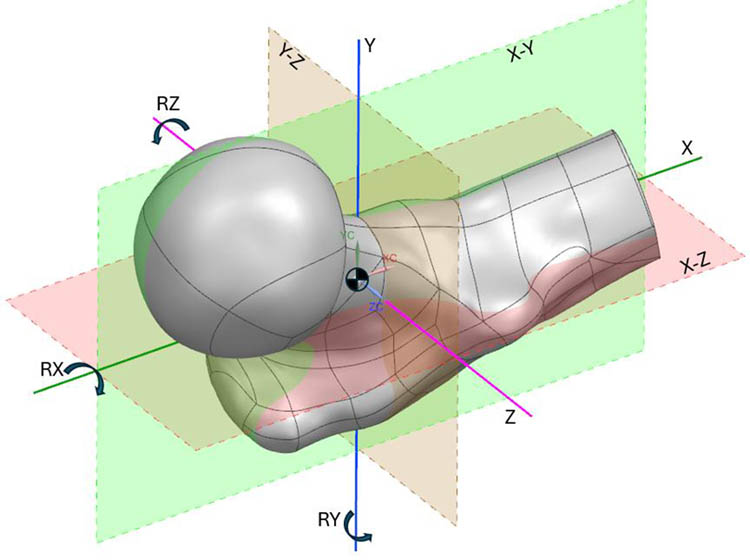
Figure 2
Coordinate system and principal working planes in the Siemens NX environment with rotation axes (RX, RY, RZ).
2.2.3. Iterative cross-sectional determination
A series of cross-sections is generated along successive principal axes of the model. Surface area is calculated for each cross-section. Based on area variation, characteristic regions are identified:
Head region – largest cross-sectional areas
Neck isthmus – smallest cross-sectional area
Proximal shaft – renewed area increase
Region identification proceeds as follows. First, cross-sections are generated in three principal planes (X–Y, X−Z, Y−Z). The plane yielding the largest cross-sectional area is discarded, as it corresponds to the plane perpendicular to the femoral shaft rather than the neck. The direction toward the femoral head is then determined by iteratively offsetting the two remaining planes by increments equal to one-eighth of the model’s largest bounding dimension, selecting the direction in which cross-sectional area is smallest. The operator confirms the correctness of the identified direction vector before proceeding.
Each remaining principal plane is then rotated around two axes in 5° steps over a range of ±20°. For each orientation, the cross-sectional area is measured. The plane orientation yielding the minimum area is selected and further refined by rotation in 0.5° steps over a ±3° range. The algorithm terminates the neck search when the cross-sectional area of successive sections increases by more than 15% relative to the current minimum, indicating transition from the neck isthmus to the head or trochanteric region. Three independent area measurement methods are employed at each cross-section to handle cases where the sectioning plane intersects multiple disjoint surfaces, a situation that arises frequently near the head-neck junction due to the complex proximal femoral topology.
2.3. Characteristic point determination
Following identification of the minimum cross-sectional area, the neck isthmus center point (Ps) is defined. This point is determined through iterative circle fitting to the cross-section, with the circle’s geometric center designated as Ps.
Subsequently, along the axis direction, additional cross-sections are generated at 1 mm intervals until complete model exit. The head center point (Pm) corresponds to the centroid of the maximum cross-sectional area, while the head apex point (Pw) corresponds to the center of the final non-zero cross-section.
2.3.1. Axis approximation
The anatomical axis is approximated using three characteristic points: Ps, Pm, and Pw. Three direction vectors are computed between these points, subsequently normalized, and their average calculated to determine the axis direction. The final anatomical axis passes through the head center (Pm) parallel to this averaged vector.
2.3.2. Rotational optimization
The algorithm incorporates axis direction optimization through iterative rotation. Initial vector rotation proceeds in 5° steps, followed by refinement at 0.5° increments. The optimization criterion minimizes distances between centroids and the proposed axis. The iterative refinement aligns the final axis with the anatomical femoral neck orientation.
2.3.3. Validation and quality control
The algorithm incorporates visual verification of axis correctness. When necessary, direction correction is achieved through minor vector rotation or characteristic point adjustment. Implementation within the Siemens NX computer-aided design (CAD) environment provides real-time axis visualization relative to the three-dimensional femoral model. Figure 3 shows the results of the algorithm. Final validation is performed by a qualified operator (engineer or surgeon).
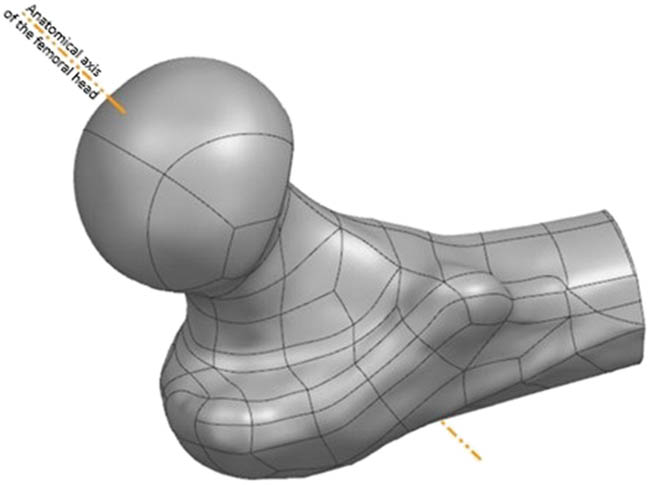
Figure 3
Algorithmically determined head-neck axis of the proximal femur.
2.4. Implementation environment
The algorithm was implemented within Siemens NX, a professional CAD/CAM/CAE system providing extensive geometric modeling capabilities and parametric programming tools. Use of a commercial CAD platform ensures compatibility with existing surgical planning workflows and supports integration with downstream applications including PSI design.
3. Results
3.1. Algorithm output
For each processed femoral model, the algorithm outputs the three-dimensional coordinates of three characteristic points (Ps, Pm, Pw), the optimized axis direction vector, and derived geometric parameters including the neck isthmus cross-sectional area and the approximate head diameter. These results are generated automatically within the Siemens NX environment and can be exported as geometric data for subsequent planning or manufacturing applications. Visual validation within the CAD environment confirms computed axis alignment with anatomical landmarks. Figure 4 shows the schematic workflow of the axis approximation algorithm.
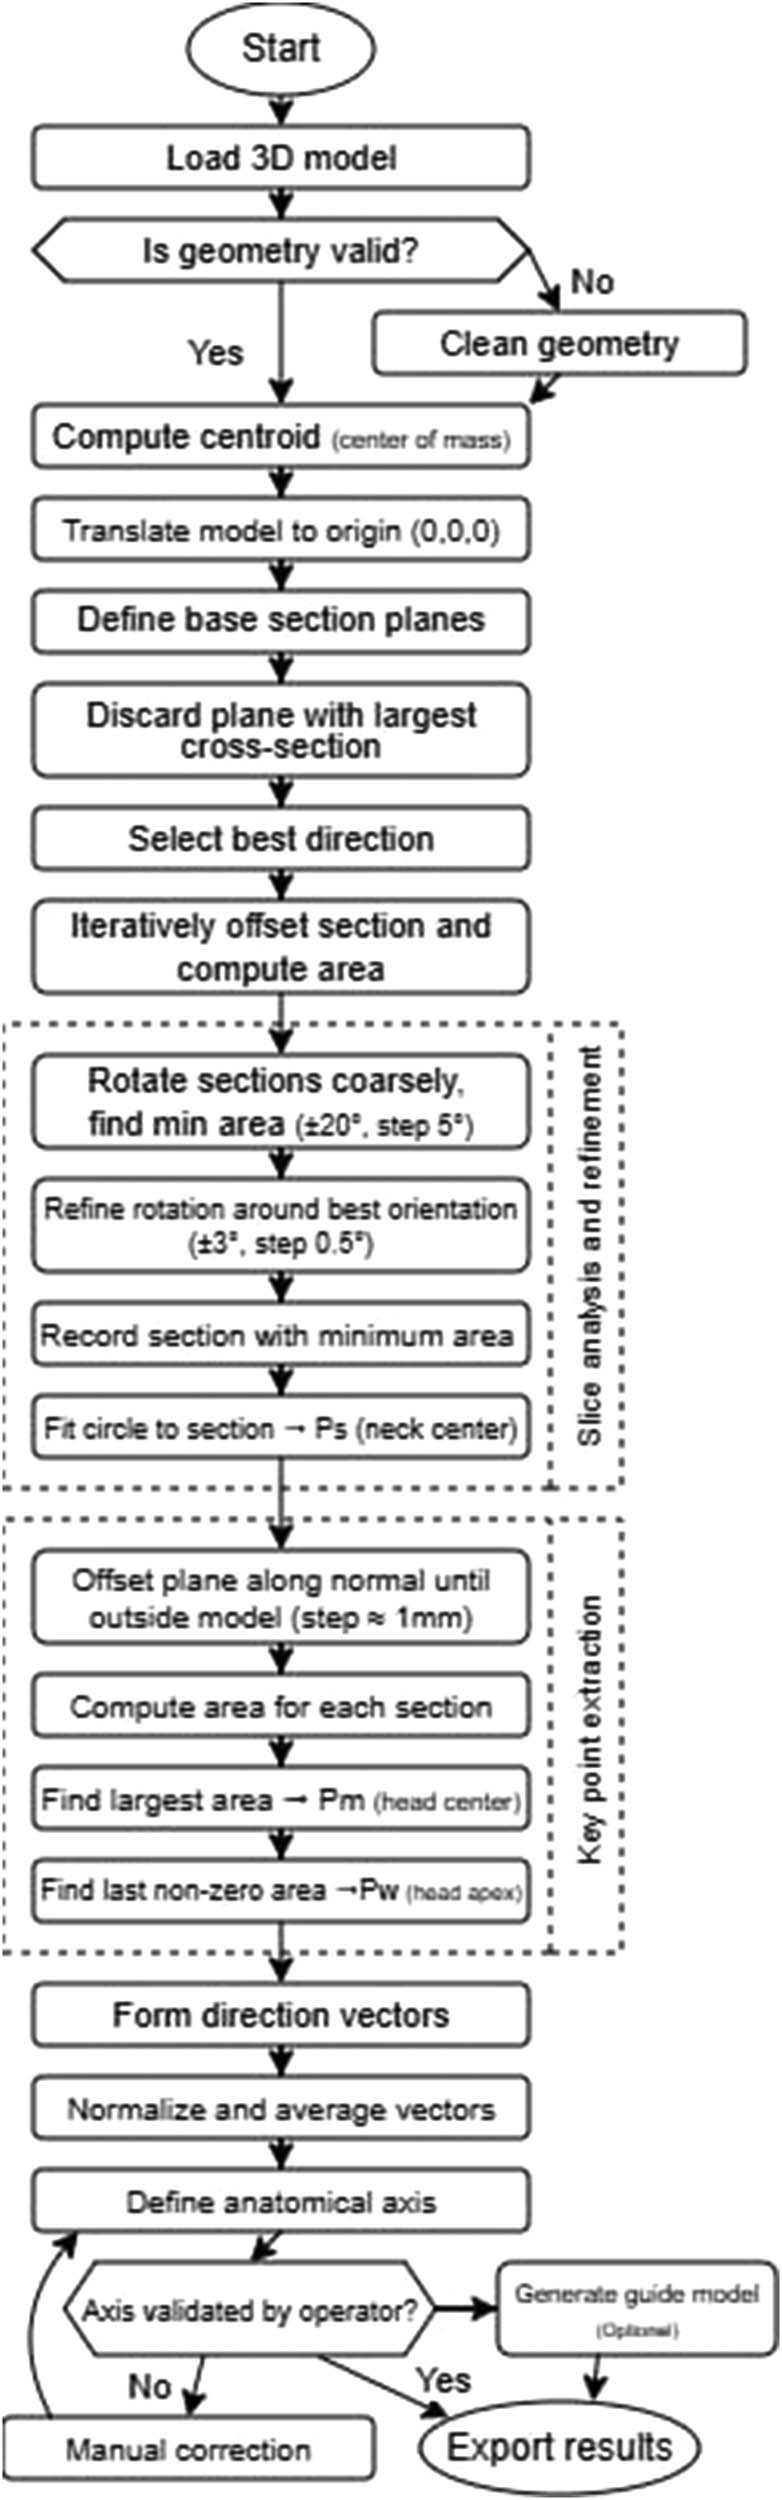
Figure 4
Flowchart of the algorithm for determining topological parameters of the proximal femur.
3.2. Algorithm validation
The algorithm was evaluated in a pilot feasibility study on 4 independent CT-derived femoral bone models, each tested in 5 different spatial orientations to assess robustness to initial positioning, yielding a total of 20 test cases. Algorithm performance was evaluated across eight parameters using a five-point scale (1 = program failure or completely incorrect result; 2 = algorithm runs but result is entirely wrong; 3 = partially correct with significant errors; 4 = nearly correct with minor deviations; 5 = fully correct result matching expectations).
The eight evaluation parameters listed in Table 1 assess progressively deeper stages of the algorithmic pipeline, from initial model cleanup through characteristic point identification to final axis determination. The overall mean score across all models and parameters was 4.1 out of 5.0 (82%). Models 1, 3, and 4, which had high-quality surface meshes with minimal artifacts, achieved consistently high scores (4–5) across all parameters. Model 2, characterized by extensive surface artifacts and geometric irregularities, produced substantially lower scores (1–2 for most parameters). After manual repair of the most severe artifacts on Model 2, the algorithm was able to complete the analysis, although the introduced geometric modifications negatively affected the subsequent processing steps.
Table 1
Algorithm validation results across four femoral models
| Parameter | Model 1 | Model 2 | Model 3 | Model 4 |
|---|---|---|---|---|
| Model cleanup | 5 | 5 | 5 | 5 |
| Initial orientation robustness (five positions) | 4/5 pos. score 5, 1 pos. score 4 | 4/5 pos. score 4, 1 pos. score 2 | 3/5 pos. score 5, 2 pos. score 4 | 4/5 pos. score 5, 1 pos. score 4 |
| Multi-surface handling | 5 | 1 (error; after manual fix: 5) | 4 | 5 |
| Head direction identification | 5 | 2 | 4 | 4 |
| Neck isthmus point (Ps) accuracy | 5 | 2 | 3 | 5 |
| Head center point (Pm) accuracy | 5 | 2 | 4 | 5 |
| Head apex point (Pw) accuracy | 5 | 2 | 4 | 5 |
| Anatomical axis accuracy | 5 | 2 | 4 | 4 |
| Mean score | 4.9 | 2.5 | 4.0 | 4.6 |
Scoring: 1 = program failure; 2 = runs but incorrect; 3 = partially correct; 4 = nearly correct with minor deviations; 5 = fully correct. Overall mean: 4.1/5.0 (82%).
The algorithm demonstrated strong resilience to changes in initial spatial orientation: for Models 1 and 4, four out of five orientations received the highest score, with only one orientation producing a suboptimal initial direction vector that was nevertheless correctable through the iterative refinement procedure.
In addition to the ordinal scoring, the algorithm’s measurement repeatability was assessed. For each of the four femoral models, five independent runs were performed from different initial spatial orientations. Across all runs for a given model, the algorithmically determined axis direction exhibited a repeatability of ±0.5° in angular orientation and ±0.2 mm in the position of the neck isthmus center point (Ps) relative to the mean result. These values represent the algorithm’s intrinsic precision (repeatability), independent of input data quality. The iterative refinement procedure (0.5° angular step, 0.5 mm linear step along the axis) converged consistently to the same solution regardless of initial conditions. These data characterize algorithmic repeatability rather than absolute accuracy, as the present pilot study did not include an independently defined reference axis (e.g., expert-determined or navigation-derived) for comparison. Establishing absolute accuracy will require a larger cohort with an independent geometric reference.
3.3. Physical prototype validation
To assess practical feasibility, two prototype iterations of the patient-specific surgical gauge were manufactured using fused deposition modeling. The first prototype failed on two counts: half-shell mating (gap formation during handling) and pin fragility. Pin breakage was the critical issue. These findings prompted design modifications – a clamping band, surface relief at the parting plane to compensate for printing tolerances, a 0.1 mm offset of the bone-contacting surface, and filleted edges. The second prototype incorporated all modifications and used a revised print orientation (building from the base cylinder upward). Internal surface quality improved markedly. Overall, the prototyping cycle confirmed that the algorithmically determined axis provides a viable geometric foundation for PSI design, but manufacturing-aware adjustments are essential.
4. Discussion
The method presented in this work addresses a specific gap in current BHR planning practice. Various technologies exist to assist surgeons in component positioning, from mechanical jigs to computer navigation and PSIs. Most, however, rely on either generic anatomical assumptions or semi-manual identification of key geometric features. The parametric algorithmic approach described here offers a reproducible, automated solution for determining the head-neck axis from CT-derived three-dimensional models.
4.1. Comparison with existing approaches
Free-hand guidewire placement remains widely employed in BHR but is susceptible to intraoperative misjudgment, particularly in cases with atypical anatomy or during a surgeon’s learning curve [6,8,9]. Generic mechanical jigs improve consistency but cannot adapt to patient-specific variations in neck-shaft angle, head size, or torsional profile [6,8,9]. Intraoperative fluoroscopy provides real-time feedback but offers only two-dimensional projections of a three-dimensional problem and carries radiation exposure concerns [9,20]. Computer-assisted navigation systems have demonstrated improved accuracy and reproducibility compared with free-hand techniques [19,20]. However, they require dedicated hardware, additional intraoperative setup, and specialized training. Such demands have limited widespread adoption.
Quantitative accuracy data from the literature enable a more detailed comparison of these approaches. Conventional mechanical jigs have been reported to produce mean angular deviations on the order of 5–7° from the intended stem-shaft angle (SSA). Davis et al. [11] demonstrated a mean SSA of 127.7° with a conventional jig (target 135°), corresponding to a mean error of 7.3°, whereas image-free navigation achieved a mean SSA of 133.3° (mean error 1.7°). Similarly, Gravius et al. [24] reported a mean angular error of 6.5 ± 7.8° for conventional instruments compared with 0 ± 0.7° for fluoroscopy-based navigation in an in vitro setting, with cadaveric results of 1 ± 1.4° for navigation. Wirth and Gossé [25] found that the manufacturer’s centering device produced a mean angular deviation of 7 ± 5.7°, whereas central neck drilling under fluoroscopic guidance reduced this to 3 ± 3.4°. Olsen et al. [13] demonstrated that navigation provided ranges of coronal alignment error up to eight times smaller than those of conventional jigs.
Navigation-assisted techniques have been evaluated in larger clinical series with consistent results. Ganapathi et al. [26] reported that 38% of non-navigated hip resurfacing arthroplasties (33 of 88) exhibited a deviation exceeding 5° from the planned trajectory, whereas none of the 51 navigated cases (0%) exceeded this threshold. In a separate clinical series, Olsen et al. [19] reported a mean deviation of 2.8 ± 2.0° from the planned SSA in 100 consecutive navigated BHR procedures, with 86% of cases falling within ±5° of the plan. Chiron et al. [27] demonstrated that a fluoroscopy-guided technique achieved malpositioning risks below 1.41° in the anteroposterior plane and below 0.80° in the lateral profile across 160 consecutive hip resurfacing arthroplasties.
Patient-specific templates derived from preoperative CT data have demonstrated accuracy comparable to or exceeding that of navigation. Kitada et al. [28] compared three approaches on synthetic bone models and reported root mean square errors (RMSE) of 0.954–2.969° for patient-specific templates, 1.468–3.213° for CT-based navigation, and greater errors for conventional mechanical jigs. Kunz et al. [18] reported a mean angular deviation of 1.14° with individualized 3D-printed drill templates.
The influence of surgical experience on conventional jig accuracy has also been documented. Morison et al. [29] reported that surgeons who subsequently gained experience with navigation improved their conventional jig accuracy from a mean SSA deviation of 5.6° to 2.2° (p = 0.01), suggesting that familiarity with three-dimensional anatomy through navigation training carries over to conventional techniques.
Table 2 summarizes the reported angular accuracy of the principal femoral component positioning methods in BHR, alongside the repeatability of the algorithm presented in this work.
Table 2
Comparison of femoral component positioning accuracy across methods in BHR. Clinical methods report accuracy (deviation from intended or reference axis); the proposed algorithm reports repeatability
| Method | Study | Setting | Angular error metric | Notes |
|---|---|---|---|---|
| Conventional mechanical jig | Davis et al. [11] | Cadaver | 7.3° mean error (SSA target 135°) | n = 6 paired limbs |
| Gravius et al. [24] | In vitro | 6.5 ± 7.8° mean error | Conventional instruments | |
| Wirth and Gossé [25] | Clinical | 7 ± 5.7° mean deviation | Manufacturer centering device | |
| Morison et al. [29] | Clinical | 5.6° mean deviation (pre-nav. exp.); 2.2° (post-nav. exp.) | 213 consecutive HRAs | |
| Imageless navigation | Davis et al. [11] | Cadaver | 1.7° mean error | n = 6 paired limbs |
| Olsen et al. [19] | Clinical | 2.8 ± 2.0° mean deviation from plan | 100 consecutive BHRs; 86% within ±5° | |
| Ganapathi et al. [26] | Clinical | 0% outliers > 5° (vs 38% without) | 51 navigated vs 88 non-navigated | |
| Fluoroscopy-based navigation | Gravius et al. [24] | In vitro | 0 ± 0.7° mean error | Cadaver: 1 ± 1.4° |
| Chiron et al. [27] | Clinical | AP < 1.41°; profile < 0.80° | 160 consecutive HRAs | |
| Wirth and Gossé [25] | Clinical | 3 ± 3.4° mean deviation | Central drilling under fluoroscopy | |
| Patient-specific template | Kitada et al. [28] | Synthetic | RMSE 0.954–2.969° | vs navigation RMSE 1.468–3.213° |
| Kunz et al. [18] | Clinical | 1.14° mean deviation | 3D-printed drill templates | |
| Proposed algorithm* | Present study | Computational (pilot) | ± 0.5° repeatability* | 4 models, 5 orientations each |
[i] *The value reported for the proposed algorithm represents intrinsic computational repeatability (precision), not accuracy against an independent reference axis. It is therefore not directly comparable with the clinical accuracy values listed for other methods. The algorithm determines the axis on a digital model prior to surgery; additional error sources – including CT reconstruction, registration, surgical execution, and cementation – would contribute to the total clinical error chain. The comparison is provided to contextualize the magnitude of the algorithmic variability relative to known clinical positioning errors, not to claim equivalence of the measured quantities.
Preoperative three-dimensional planning based on CT data is a promising direction and has gained acceptance in THA [15]. Recent advances in artificial intelligence have further enhanced CT-based planning pipelines, enabling automated segmentation, morphometric analysis, and three-dimensional component positioning optimization [30,31]. However, most existing workflows treat head-neck axis determination as an implicit step performed manually or semi-automatically by an engineer or surgeon during planning. This manual involvement introduces variability, consumes time, and limits scalability. These shortcomings are amplified in high-volume settings. The algorithmic method presented here automates this critical step, ensuring axis definition consistency, reproducibility, and independence from user experience.
4.2. Input data accuracy and error propagation
The accuracy of the algorithmically determined femoral head-neck axis depends not only on the algorithm’s intrinsic precision but also on the dimensional fidelity of the input three-dimensional model. Because the algorithm operates on CT-derived bone geometry, any error present in the CT imaging, segmentation, and surface reconstruction chain propagates into the final axis determination.
The dimensional accuracy of CT-based bone models has been characterized extensively in the literature. Stephen et al. [32] compared CT and MRI-derived models of cadaveric lower limbs against structured light scanning (35 µm accuracy) and reported a mean surface error of 0.85 ± 0.2 mm for femoral CT models. Bittner-Frank et al. [33] systematically evaluated the effects of CT scanner type, scan protocol, and segmentation algorithm on 3D bone model accuracy and found mean absolute deviations ranging from 0.03 ± 0.20 mm to 0.32 ± 0.23 mm across all tested configurations, with all values remaining below 0.5 mm. Campanelli et al. [34] demonstrated that CT models of the distal femur achieved submillimeter accuracy relative to laser-scanned specimens, though a slight overestimation of bone morphology was observed. Taken together, these studies indicate that CT-based bone models typically exhibit a dimensional accuracy in the range of 0.3–1.0 mm, depending on scanner hardware, acquisition protocol, and reconstruction parameters.
Within this imaging-to-model pipeline, the segmentation step has been identified as the largest single contributor to dimensional error. Singh et al. [35] demonstrated that variations in the segmentation threshold applied to skull CT data resulted in surface deviations of up to 0.6 mm relative to optical scanning. Engelkes [36] showed through synthetic CT volumes that sub-voxel segmentation accuracy is achievable when appropriate local thresholding strategies are employed, but that global thresholding or inappropriate windowing can introduce systematic bias. Mandolini et al. [23] compared three segmentation software packages for hip surgical planning and found that the choice of software influenced the dimensional and geometric accuracy of the resulting femoral head models, with Materialise Mimics and 3D Slicer producing the most accurate reconstructions.
The propagation of CT model error into angular uncertainty of the determined axis can be estimated from geometric considerations. The algorithm employs a 0.5° angular step and a 0.5 mm linear step during the fine refinement phase. The cross-coupling between these two step sizes is negligible: a 0.5 mm positional offset measured at an angular resolution of 0.5° corresponds to 0.5 mm × tan(0.5°) ≈ 0.004 mm, which is well below any measurable threshold. However, the CT surface error propagates more substantially into angular uncertainty. The femoral neck isthmus region spans approximately 25–40 mm in length; 30 mm was used as a representative midrange value. A worst-case surface error of 0.85 mm at one endpoint of the axis determination region propagates to an upper-bound angular uncertainty of arctan(0.85/30) ≈ 1.6° (range: 1.2°–1.9° for neck lengths of 40–25 mm). In practice, systematic CT bias (e.g., slight overestimation reported by Campanelli et al. [34]) would shift both endpoints in the same direction, resulting in a smaller angular error than this worst-case estimate. This estimate indicates that the CT input quality, rather than the algorithm itself, constitutes the limiting factor for axis determination accuracy. The algorithm’s intrinsic repeatability of ±0.5° (Section 3.2) is approximately three times smaller than the estimated CT-induced angular uncertainty, confirming that the current algorithmic resolution is well matched to the precision of available input data.
This analysis also informs decisions regarding potential step size refinement. The current algorithm employs a two-phase search: a coarse phase spanning ±20° in 5° increments (approximately 18 rotations per axis) followed by a fine phase spanning ±3° in 0.5° increments (approximately 26 rotations per axis). Reducing the fine phase step size to 0.1° would increase the number of rotations in the fine phase to approximately 122 per axis (a fivefold increase in computation), yet would yield no practical improvement in overall accuracy given that the CT-induced angular uncertainty (∼1.6°) already exceeds the current step size by a factor of three. Step refinement below the noise floor of the input data yields no practical improvement in accuracy. Such refinement may, however, become meaningful in the future with higher-resolution imaging modalities, such as photon-counting CT or micro-CT, which can reduce surface reconstruction errors to the sub-0.1 mm range.
4.3. Advantages of the parametric approach
The proposed method’s key strength lies in its systematic, rule-based approach to axis identification. By analyzing cross-sectional geometry at regular intervals and optimizing axis orientation based on objective geometric criteria (centroid positions and distances), the algorithm substantially reduces subjective judgments regarding axis location while retaining visual verification as a quality safeguard. This reproducibility is particularly valuable in high-volume centers where multiple surgeons or engineers may participate in preoperative planning, and in research settings where consistent methodology across cases is essential for comparative analysis.
The method also demonstrates versatility in potential applications. Once determined, the axis serves as a foundational geometric reference applicable in several ways:
As a planning tool for visualizing intended guidewire trajectory and assessing superior cortex clearance
As a reference for evaluating anatomical risk factors including small neck diameter or unfavorable neck-shaft angle
As input for designing patient-specific drilling guides or jigs that enforce planned trajectory intraoperatively
As an educational tool, enabling surgeons to understand individual case three-dimensional anatomy before entering the operating room
Implementation within a commercial CAD environment (Siemens NX) ensures method integration into existing surgical planning workflows and compatibility with downstream manufacturing processes, including three-dimensional printing of PSIs . Systematic reviews confirm the growing adoption of three-dimensional printed guides in hip arthroplasty [37].
4.4. Limitations and future directions
The method has several limitations that warrant discussion. First, the algorithm lacks clinical outcome validation. While the approach’s geometric logic is sound, its clinical utility ultimately depends on whether component placement based on the computed axis leads to improved outcomes, including reduced femoral neck fracture rates, enhanced implant survivorship, or fewer complications compared with conventional techniques. Prospective clinical studies are necessary to establish this connection. The current pilot validation was conducted on four femoral models, which, while sufficient to demonstrate algorithmic feasibility and identify failure modes, is a limited sample size. Expansion of the test cohort to include a broader range of anatomical variants – including dysplastic, post-traumatic, and osteoporotic femora – would strengthen confidence in the method’s generalizability. While the current evaluation employs a semi-quantitative ordinal scoring scale for overall algorithm performance, preliminary repeatability testing has demonstrated angular precision of ±0.5° and positional precision of ±0.2 mm (Section 3.2). Nevertheless, these values represent algorithmic repeatability rather than absolute accuracy. Future studies should incorporate direct angular comparison with expert-defined or navigation-determined axes to validate the method against an independent geometric reference [10,11,12,13,14,18].
Second, algorithm accuracy depends on input data quality. Segmentation errors, incomplete surface models, or residual artifacts in STEP files can lead to incorrect axis determination. As discussed in Section 4.2, the CT reconstruction chain introduces a dimensional uncertainty of approximately 0.3–1.0 mm, which propagates to an estimated angular uncertainty of approximately 1.6° for a typical femoral neck geometry. Although artifact reduction steps are incorporated into the workflow, careful three-dimensional model quality control prior to axis calculation remains essential. Future work could explore integration with automated segmentation algorithms and machine learning-based quality checks to further reduce manual intervention.
Third, current implementation requires access to specialized CAD software (Siemens NX), which may not be available in all clinical or research settings. The algorithmic principles are transferable to other platforms; standalone or open-source implementations would improve accessibility.
Fourth, the method focuses exclusively on geometric axis determination and does not account for other factors influencing surgical decision-making, including bone quality, cyst or sclerosis presence, or patient-specific biomechanical considerations beyond simple geometry. A complete preoperative planning system would need to integrate axis information with clinical data, implant sizing, acetabular component planning, and risk stratification tools.
Finally, the method determines a single optimal axis based on geometric criteria. In practice, a range of acceptable trajectories may exist, and surgeons may wish to explore variations to optimize for specific clinical goals, such as maximizing bone support or avoiding specific anatomical features. Future algorithm versions could incorporate interactive adjustment tools or present a family of candidate axes with associated risk metrics.
4.5. Potential for clinical workflow integration
The parametric algorithmic method, for all its current limitations, moves BHR planning closer to objective, reproducible, patient-specific workflows. At its core, it provides a geometric foundation for downstream tools – risk assessment, implant selection, and intraoperative guidance. With growing adoption of digital planning technologies and patient-specific approaches, automated geometric analysis may become increasingly integrated into clinical workflows.
The method may prove particularly valuable in complex cases where anatomical variation is pronounced, including developmental dysplasia, post-traumatic deformity, or revision surgery. Generic planning approaches are least reliable precisely in such cases. The benefit of patient-specific axis determination is therefore greatest in cases with the most challenging anatomy and the narrowest margins for error. By providing an objective reference point, the algorithm can assist surgeons in making more informed decisions regarding case suitability, component sizing, and surgical approach.
5. Conclusion
This work presents a parametric algorithmic method for automated determination of the femoral head-neck axis from CT-derived three-dimensional models in the context of BHR. The method systematically analyzes cross-sectional geometry, identifies anatomical landmarks (neck isthmus, head center, and apex), and optimizes axis orientation through iterative rotation to minimize geometric deviations.
The algorithm offers complementary advantages to existing approaches, including reproducibility, objectivity, and independence from user experience. It provides a reliable geometric reference supporting multiple applications in preoperative planning and PSI design. Implementation within a commercial CAD environment ensures compatibility with existing workflows and downstream manufacturing processes. Published clinical data report positioning errors of 5–7° for conventional jigs, 1–3° for navigation systems, and 1–3° RMSE for patient-specific templates. The algorithm’s intrinsic repeatability of ±0.5° is smaller in magnitude than these clinical positioning errors. However, the two quantities are not directly comparable: the former is computational precision, while the latter reflects end-to-end clinical accuracy. Error propagation analysis indicates that CT-induced input data uncertainty (∼1.6° upper bound for typical femoral geometry) rather than the algorithm itself constitutes the limiting factor in overall axis determination accuracy.
The current validation is based on a limited sample of four femoral models and does not yet include clinical outcome data. Even so, the results demonstrate algorithmic feasibility and add to the growing set of digital planning tools in hip arthroplasty. Future work should focus on prospective clinical studies, integration with broader planning systems, and development of more accessible software implementations to enable wider adoption of patient-specific approaches in BHR.