
1. Introduction
In recent years, power meters installed on bicycles have become widespread, enabling the measurement of pedaling power in diverse environments [1,2]. Although power values obtained in this manner are influenced by road surface conditions, surrounding environment, and measurement errors, they provide sufficiently analyzable measurements compared to stable measurement data previously obtained in laboratories [3,4]. The Shimano Power Meter is one of the few devices capable of separately measuring tangential and radial components of the pedal force for each leg using sensors mounted on a bicycle crank [5]. Cyclists using this device can upload their bicycle ride data, including measured pedal force vector information, to the SHIMANO CONNECT Lab, a web-based ride data management software [6]. Consequently, ride data from diverse conditions during outdoor cycling can be obtained and analyzed relatively easily using the SHIMANO CONNECT Lab. However, previous research using outdoor measurement data has been limited to power values and cadence, and few studies have analyzed pedaling techniques using pedal force vectors.
Previously, electromyography studies have been conducted to evaluate pedaling technique from the perspective of muscle activity [7]. The index of force effectiveness (IFE) is an index used to evaluate pedaling technique, derived from such muscle activity, and it has been widely used in research [8]. The IFE is a mechanical efficiency index that quantifies how effectively the tangential component of the pedal force vector contributes to propulsion relative to the total pedal force. In contrast, another efficiency index, gross efficiency (GE), represents total efficiency as the ratio of propulsive work to total metabolic energy expenditure. Although it reflects the inherent efficiency of pedaling motion, it requires VO2 analysis and can only be measured in a laboratory setting. The IFE that can be easily measured by attaching a force vector sensor to a bicycle has been used as an indicator for evaluating pedaling techniques [8] and examining differences in cadence and riding position [9–14] as well as relationships with muscle activity and coordination [15]. However, although intentionally emphasizing the pull-up action increases the IFE, it decreases GE [16,17], indicating that a high IFE does not necessarily represent a desirable pedaling movement from the standpoint of inherent efficiency [18]. Thus, when considering performance analysis in actual cycling, GE has practical measurement limitations, whereas IFE does not necessarily reflect efficient pedaling motion. Therefore, in this study, while considering the perspective of previous research, we attempted to develop a new analytical method that more comprehensively captures pedaling characteristics using pedal force vectors.
During outdoor cycling, workload varies owing to changes in cruising speed and road gradient, and cyclists flexibly adapt their pedaling movements in response to such workload variations. We define this technique of adaptively changing pedaling movements in response to workload variations as “pedaling strategy”. Previous indoor experiments have shown notable differences in the pedaling strategy between competitive and recreational cyclists involving participants of different competitive levels [19], and the pedaling strategy of elite cyclists have been studied based on differences in pedaling movements at different workloads [20].
Against this research background, we focused on evaluating pedaling strategies specific to individual cyclists rather than the pedaling movement itself. We previously discovered that, as a new method for analyzing the pedaling strategy, the total pedaling force and effective driving force have a linear relationship under graded workload conditions and demonstrated that the pedaling strategy can be evaluated using this slope [21]. Furthermore, we showed that, similar to the total pedaling force, the instantaneous pedal force at each angle also exhibits a linear relationship with variations in effective driving forces and proposed that the pedaling strategy can be quantitatively captured using this angle-specific slope information [22].
The purpose of this study was to develop a method for quantitatively evaluating the pedaling strategy using pedal force vectors measured outdoors, an area that has received little research attention. The research question (RQ) was set as: “Among cyclists who ride regularly, are there differences in pedaling characteristics between professional cyclists and other cyclists?” To this end, we introduced principal component analysis (PCA) as a new analytical method capable of compactly analyzing multidimensional data and conducted the following:
(1) Verification that the instantaneous pedal force at each angle exhibits a linear relationship with effective driving force when analysis data are extracted from outdoor cycling data.
(2) Confirmation that pedaling strategy information can be reduced to several principal component values using PCA applied to the calculated angle-specific slopes.
(3) Examination of the possibility of evaluating pedaling strategies using principal component values through modelling of virtual pedaling types based on multiple principal component values.
(4) Statistical analysis of differences in principal component values due to differences in participant characteristics.
2. Materials and methods
This observational study incorporates retrospective data analysis.
2.1. Participants
Participants who cycled regularly and had available pedaling force vector data were randomly selected from data registered in SHIMANO CONNECT Lab. Participants with the Professional (Pro) attribute were recruited separately. Of the total 91 participants, 16 possessed Pro attributes. Data were extracted from participants’ outdoor activity records by Shimano Inc. in accordance with a joint research agreement between Kansai Medical University and Shimano Inc. The data were anonymized and provided to Kansai Medical University, where the analysis was conducted. Comprehensive consent was obtained from participants at the time of registration in the SHIMANO CONNECT Lab, and the study was approved by the Medical Ethics Review Committee of Kansai Medical University (Reference Number 2024287).
As participant background factors such as height, weight, age, and sex were anonymized, functional threshold power per body weight (FTP/BW; W/kg) and ride frequency (rides/week) are shown in Table 1 to provide an overview of individual fitness levels. Ride frequency is shown only for participants who do not have the Pro attribute.
Table 1
Characteristics of the study participants; FTP/BW for professional and nonprofessional participants, and ride frequency for nonprofessional participants
| 25% quartile | Median | 75% quartile | |||
|---|---|---|---|---|---|
| Professional: FTP/BW (W/kg) | 4.88 | ∼ | 5.07 | ∼ | 5.22 |
| Non-Professional: FTP/BW (W/kg) | 2.75 | ∼ | 3.57 | ∼ | 4.15 |
| Non-Professional: Ride frequency (rides/week) | 2.03 | ∼ | 3.29 | ∼ | 5.52 |
2.2. Analysis methods
The overall analysis method was as follows.
2.2.1. Data extraction for analysis
Pedal force vectors were measured at 30° crank angle intervals using a pedaling monitoring system such as crank-based power meters (Shimano Inc., FC-R9200-P, FC-R8100-P) [5] or pedaling monitor system (Pioneer, SGY-PM900 and SGY-PM910 series). Sensor accuracy was ensured through zero-offset calibration performed prior to use, as well as through factory calibration using known loads conducted by the manufacturer.
As shown in Figure 1, analysis data (219 cases, including 42 from participants with Pro attributes) were extracted from participants’ outdoor activity records by excluding inappropriate records, removing identical left-right data, and dividing the remaining data into multiple datasets according to the conditions for each left and right measurement. Specifically, the following data were excluded: (1) the first and last 15% of the entire activity, corresponding to warm-up/cool-down, (2) out-of-saddle pedaling sections (the so-called dancing state), (3) noise and outliers (data outliers). Furthermore, when groups of data with differing variances were identified within the same record, the data were divided into multiple datasets according to the conditions.
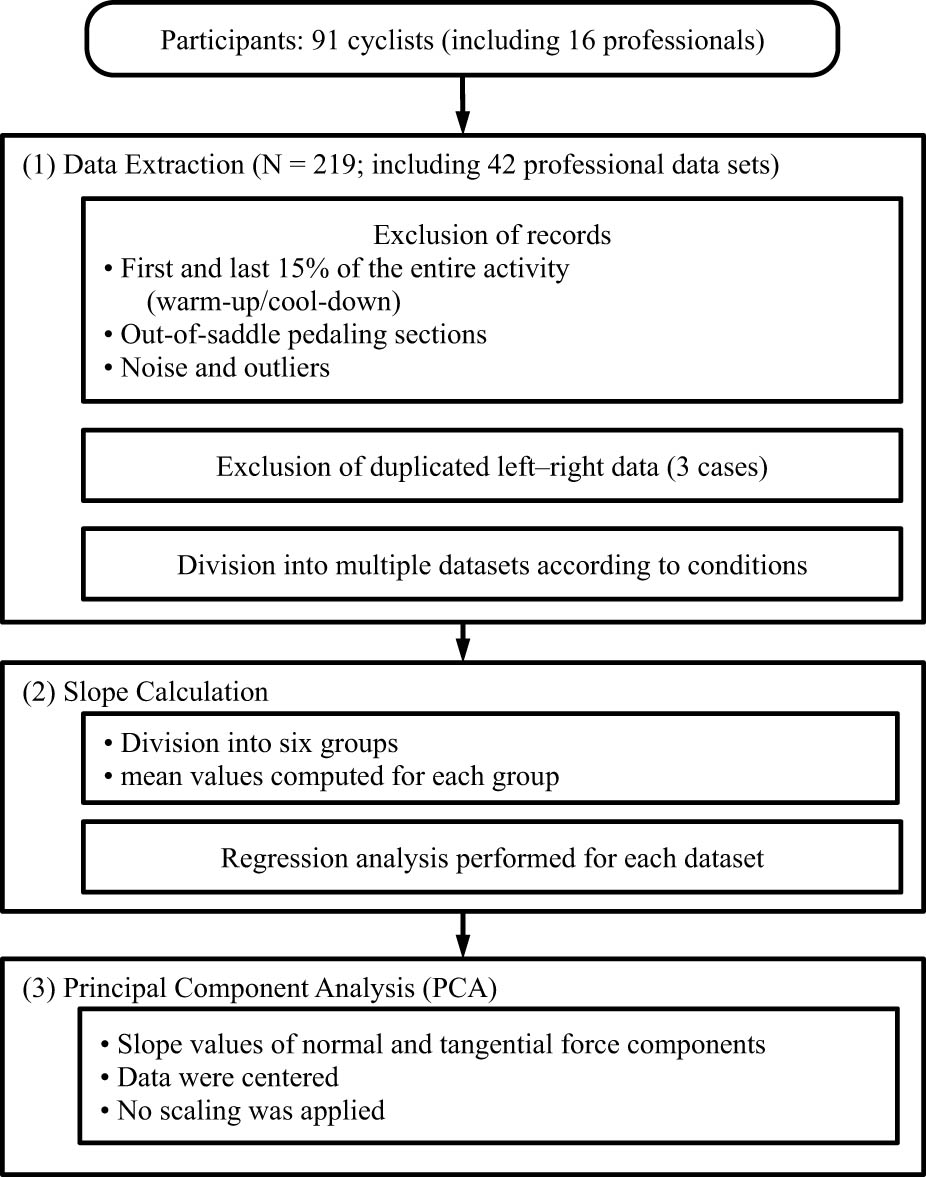
Figure 1
Overview of the analysis.
2.2.2. Slope calculation
For each participant, the instantaneous pedal force at each angle with respect to the workload variation was expressed using a regression equation based on the least-squares method.
Here, F i (θ) represents the instantaneous pedal force at angle θ for the ith dataset. The angle-specific slope a i (θ) and intercept b i (θ) are expressed with respect to changes in the mean pedal force represented by . The term e represents the residual error. For each crank angle , the instantaneous pedal force F i (θ) was regressed against the mean pedal force and the coefficients a i (θ) and b i (θ) were determined by minimizing the sum of squared residuals e. This slope was calculated for both tangential and radial components as values relative to the mean pedal force corresponding to the tangential pedal force.An example of slope calculation, with the mean pedal force divided into six groups, is shown in Figure 2. Figure 2(a) shows waveforms for each group, with measured crank angles at 30° intervals on the horizontal axis and the instantaneous pedal force on the vertical axis. The results of plotting the mean pedal force on the horizontal axis and the instantaneous pedal force at each angle on the vertical axis are shown in Figure 2(b). This figure demonstrates that the instantaneous pedal force at each angle can be approximated well by a linear function with respect to increases in the mean load. The validity of the regression calculation was assessed by calculating the root mean square (RMS) error and examining the error distribution and magnitude.
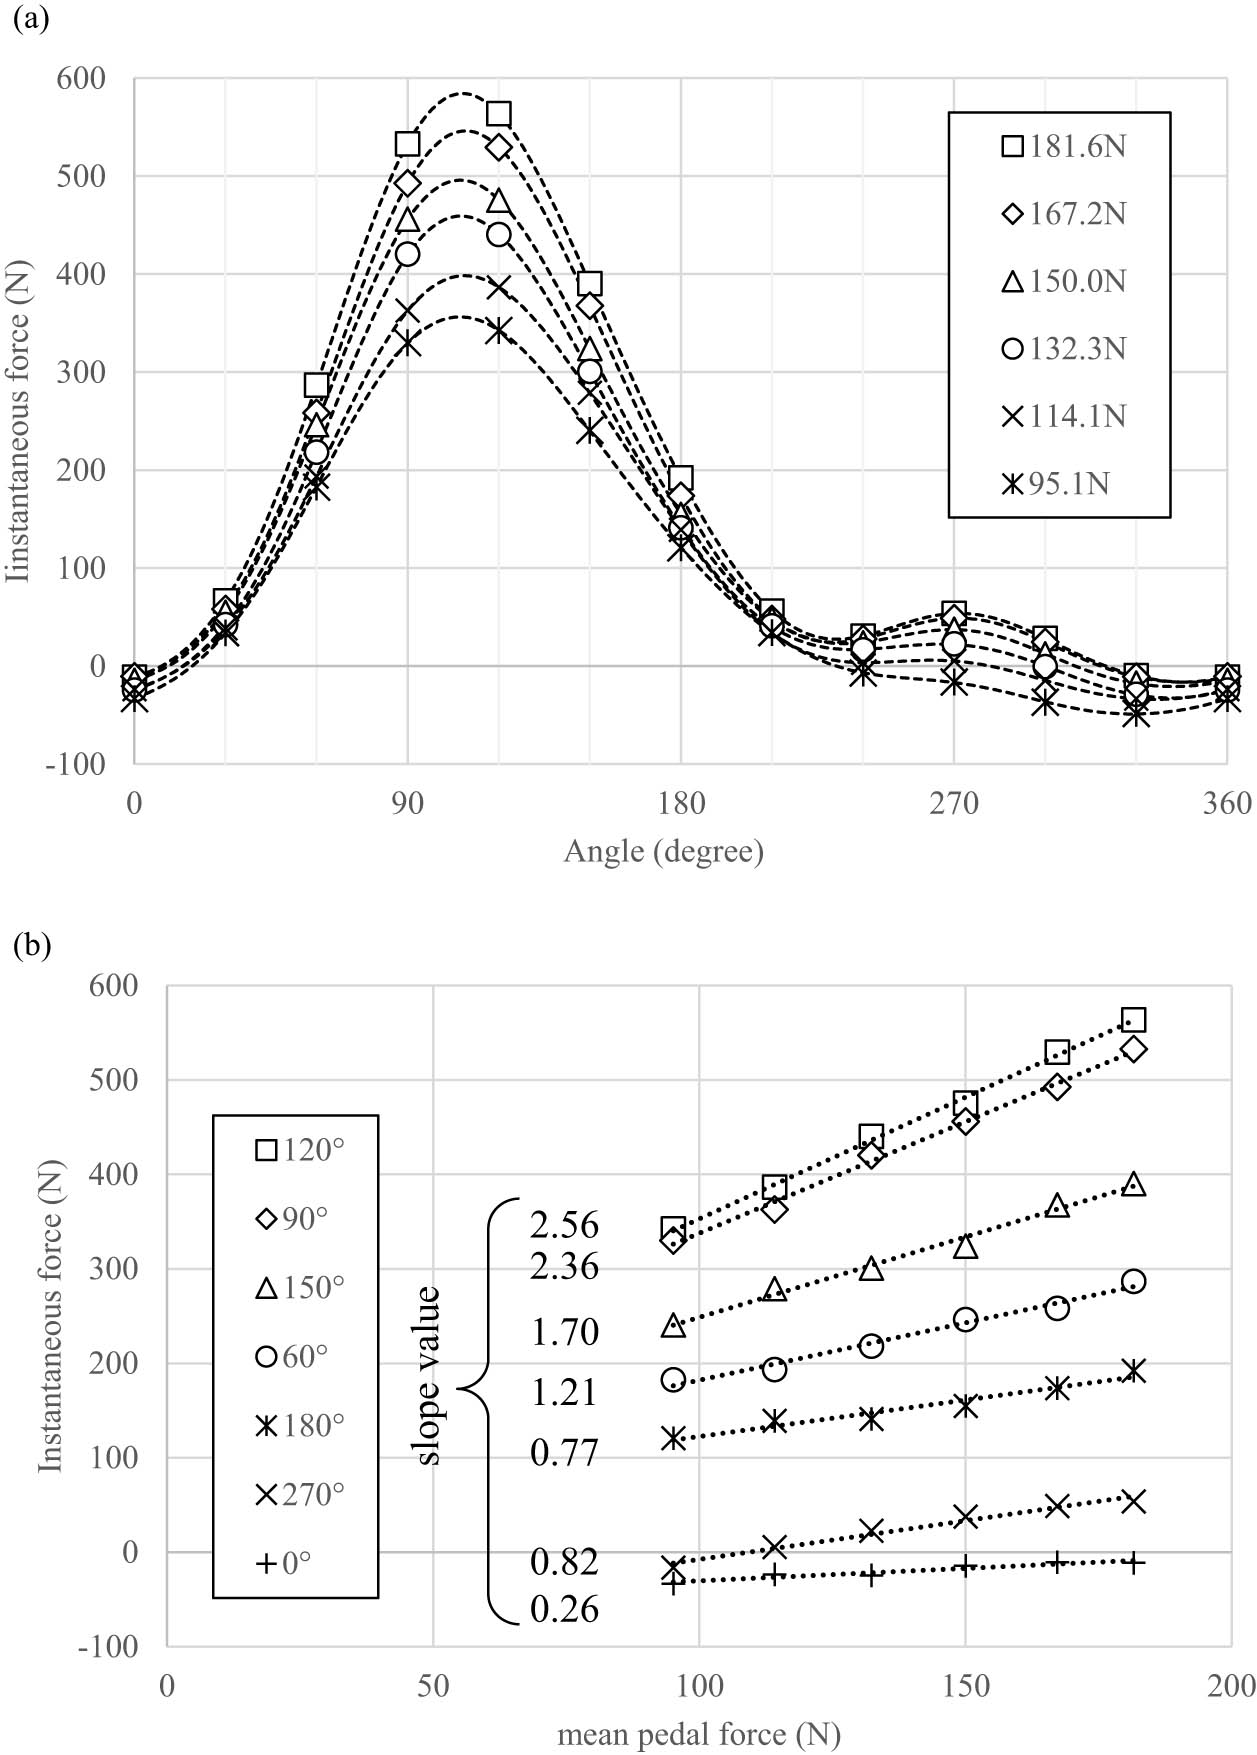
Figure 2
Slope calculation. (a) Example of instantaneous pedal force variation across crank angles with increasing mean pedal force. (b) Linear relationship between instantaneous and mean pedal forces at each crank angle (selected angles).
2.2.3. Principal component analysis
PCA is a statistical technique that transforms a set of possibly correlated variables into a smaller number of uncorrelated variables, called principal components, which capture most of the variance in the data. This approach enables the representation of high-dimensional datasets using a reduced number of variables while preserving their dominant patterns of variation [23]. This allows complex pedaling patterns to be summarized into a few interpretable components.
PCA was performed using slope values for radial and tangential components (24 values per dataset) calculated from pedal force data of the 219 cases. Centering was performed by subtracting the mean value at each angle. Scaling to correct for variance was not performed to utilize the effect of slope variance at each angle. Therefore, the slope waveform for each dataset can be expressed using the following equation:
Here, represents the baseline waveform corresponding to the mean slope value after centering, PC k (θ) represents the principal component waveforms, and s ik represents the weight values expressing each slope. The evaluation of PCA was performed by calculating eigenvalues and contribution ratios, and the validity of the PCA was confirmed from the cumulative contribution ratio.2.2.4. Analysis of the pedaling strategy using principal component analysis data
Based on the results of PCA, differences in pedaling strategy due to changes in two principal components (PC1 and PC2) were analyzed as follows. Five types were defined: Type 1 as the average case where both principal components are zero; Type 2 where only PC1 is increased by one standard deviation (+σ 1); Type 3 where only PC1 is decreased by one standard deviation (−σ 1); Type 4 where only PC2 is increased by one standard deviation (+σ 2); and Type 5 where only PC2 is decreased by one standard deviation (−σ 2). For each of these five types, pedal force waveforms were calculated for typical pedaling conditions of 90 rpm cadence and 0.17 m crank length at power outputs equivalent to 100, 200, and 300 W for both legs combined.
2.3. Statistical analysis
Statistical analyses were performed to compare PC1 and PC2 scores between professional and nonprofessional participants. Differences in central tendency were assessed using the Wilcoxon rank-sum test, and differences in dispersion were evaluated using the Brown–Forsythe test. The significance level was set to p < 0.05. All statistical analyses, including PCA, were conducted using JMP Student Edition 18.2.0.
3. Results
3.1. Evaluation of participants and data preprocessing
As shown in Table 1, participants with Pro attribute exhibited sufficiently high FTP/BW characteristics, showing a difference from those of participants without Pro attribute. Participants without Pro attribute rode regularly (2–5.5 times/W per week), and their FTP/BW indicates they were intermediate to advanced hobby racers.
Figure 3 presents the mean load (power) for 219 cases. The quartile values and median were 80.4–93.9–107.0 (W), which corresponds to approximately 200 W when converted to the total output from both legs. The dataset also included a wide range of workload outputs, from a minimum of 23 W to a maximum of 362 W (both legs combined).

Figure 3
Pedal load of extracted data (W).
3.2. Evaluation of slope values
Linear regression was performed for both radial and tangential directions at each angle for pedal force data from 219 cases to calculate slope values. The logarithmic distribution of the RMS error, representing the residuals of the regression calculation, closely approximated a normal distribution, and no difference in variance was observed across angles. Therefore, the mean ± standard deviation (SD) in the logarithmic distribution of the RMS error was calculated and back-transformed. Figure 4 presents the mean value and values corresponding to mean ± SD values of the RMS error for each angle from 0° to 330° and overall.
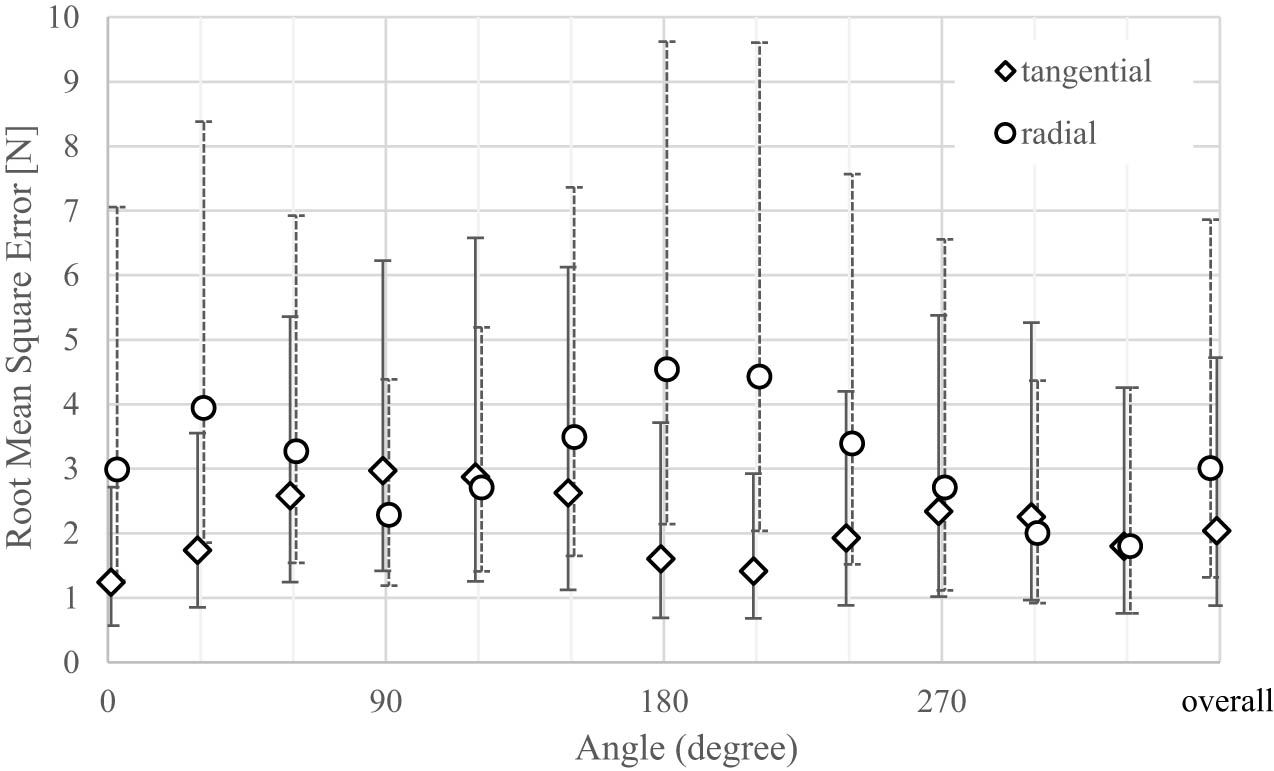
Figure 4
Root mean square error of linear regression by crank angle.
3.3. Principal component analysis
PCA was performed using slope data at 30° intervals for both radial and tangential directions, yielding 24 points per dataset of the 219 cases. Table 2 shows the eigenvalues and cumulative contribution ratios for the top four principal components and the standard deviation as distribution information for principal component values. The results showed that eigenvalues exceeded 1 for principal components up to PC3, and the cumulative contribution ratio reached 64.6% for PC1 and PC2 combined, and 83.4% for PC1 through PC4.
Table 2
Results of principal component analysis
| Eigen value | Cumulative contribution rate | Standard deviation | |
|---|---|---|---|
| PC1 | 3.965 | 41.24 | 1.9913 |
| PC2 | 2.247 | 64.61 | 1.4990 |
| PC3 | 1.224 | 77.31 | 1.1051 |
| PC4 | 0.584 | 83.39 | 0.7644 |
Figure 5 shows the baseline waveform on the left axis and the angle-specific slope waveforms PC 1(θ) and PC 2(θ) on the right axis. Panels (a) and (b) show tangential and radial components, respectively.
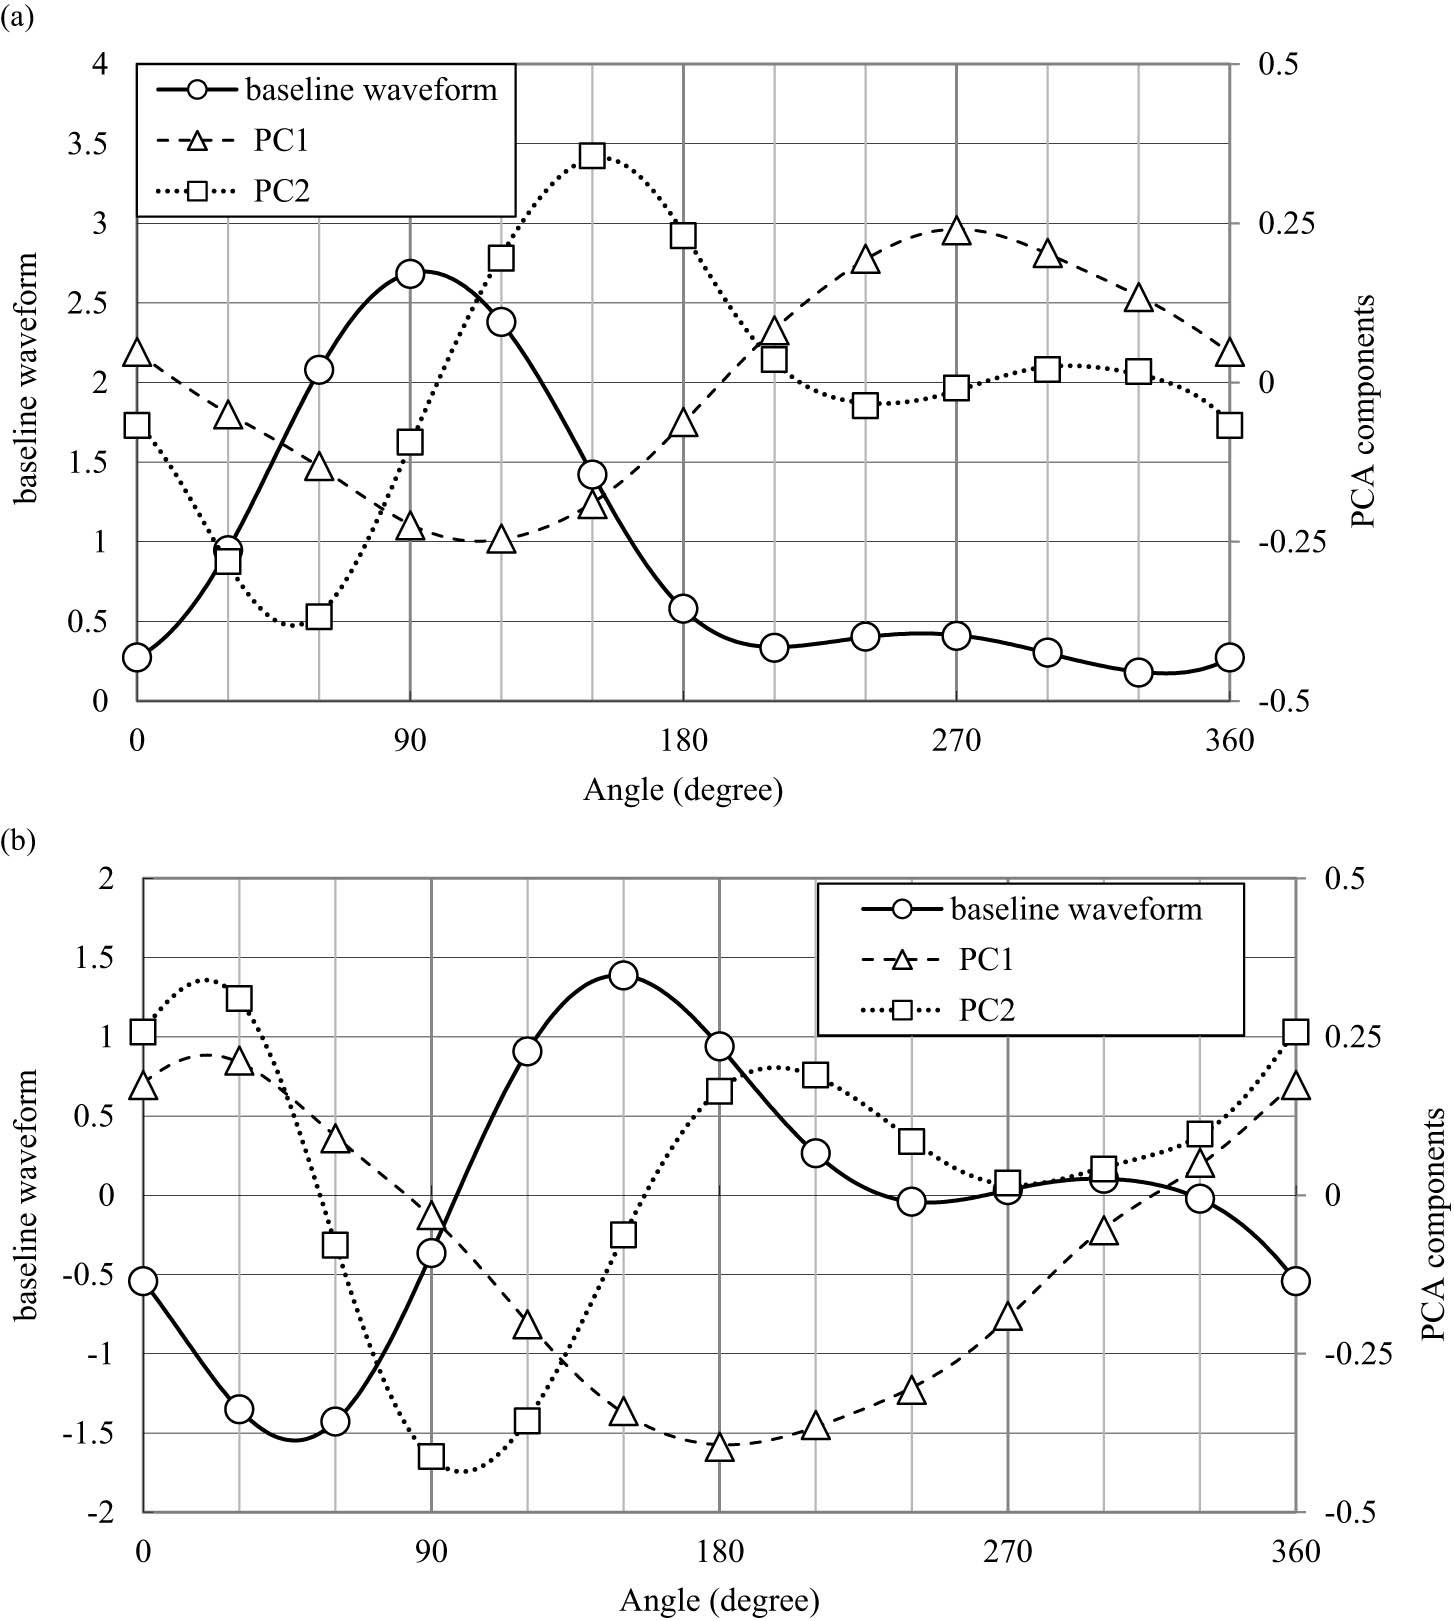
Figure 5
Baseline and principal component waveforms; baseline waveform (left axis) and PC1 and PC2 waveforms (right axis). (a) Tangential component. (b) Radial component.
3.4. Pedaling strategy by principal component value differences
The results of pedaling characteristics for each of the five types described are shown in Figures 6 and 7. Figure 6 shows pedal force waveforms when pedaling at workloads virtually equivalent to 100, 200, and 300 W for both legs combined, with (a) tangential and (b) radial forces. In the figures, Type 1 is positioned at the center, Types 2 and 3 (which vary only in PC1) are positioned on the right and left, and Types 4 and 5 (which vary only in PC2) are positioned above and below, enabling easy comparison with PC1 and PC2 magnitudes, similar to a scatter plot.
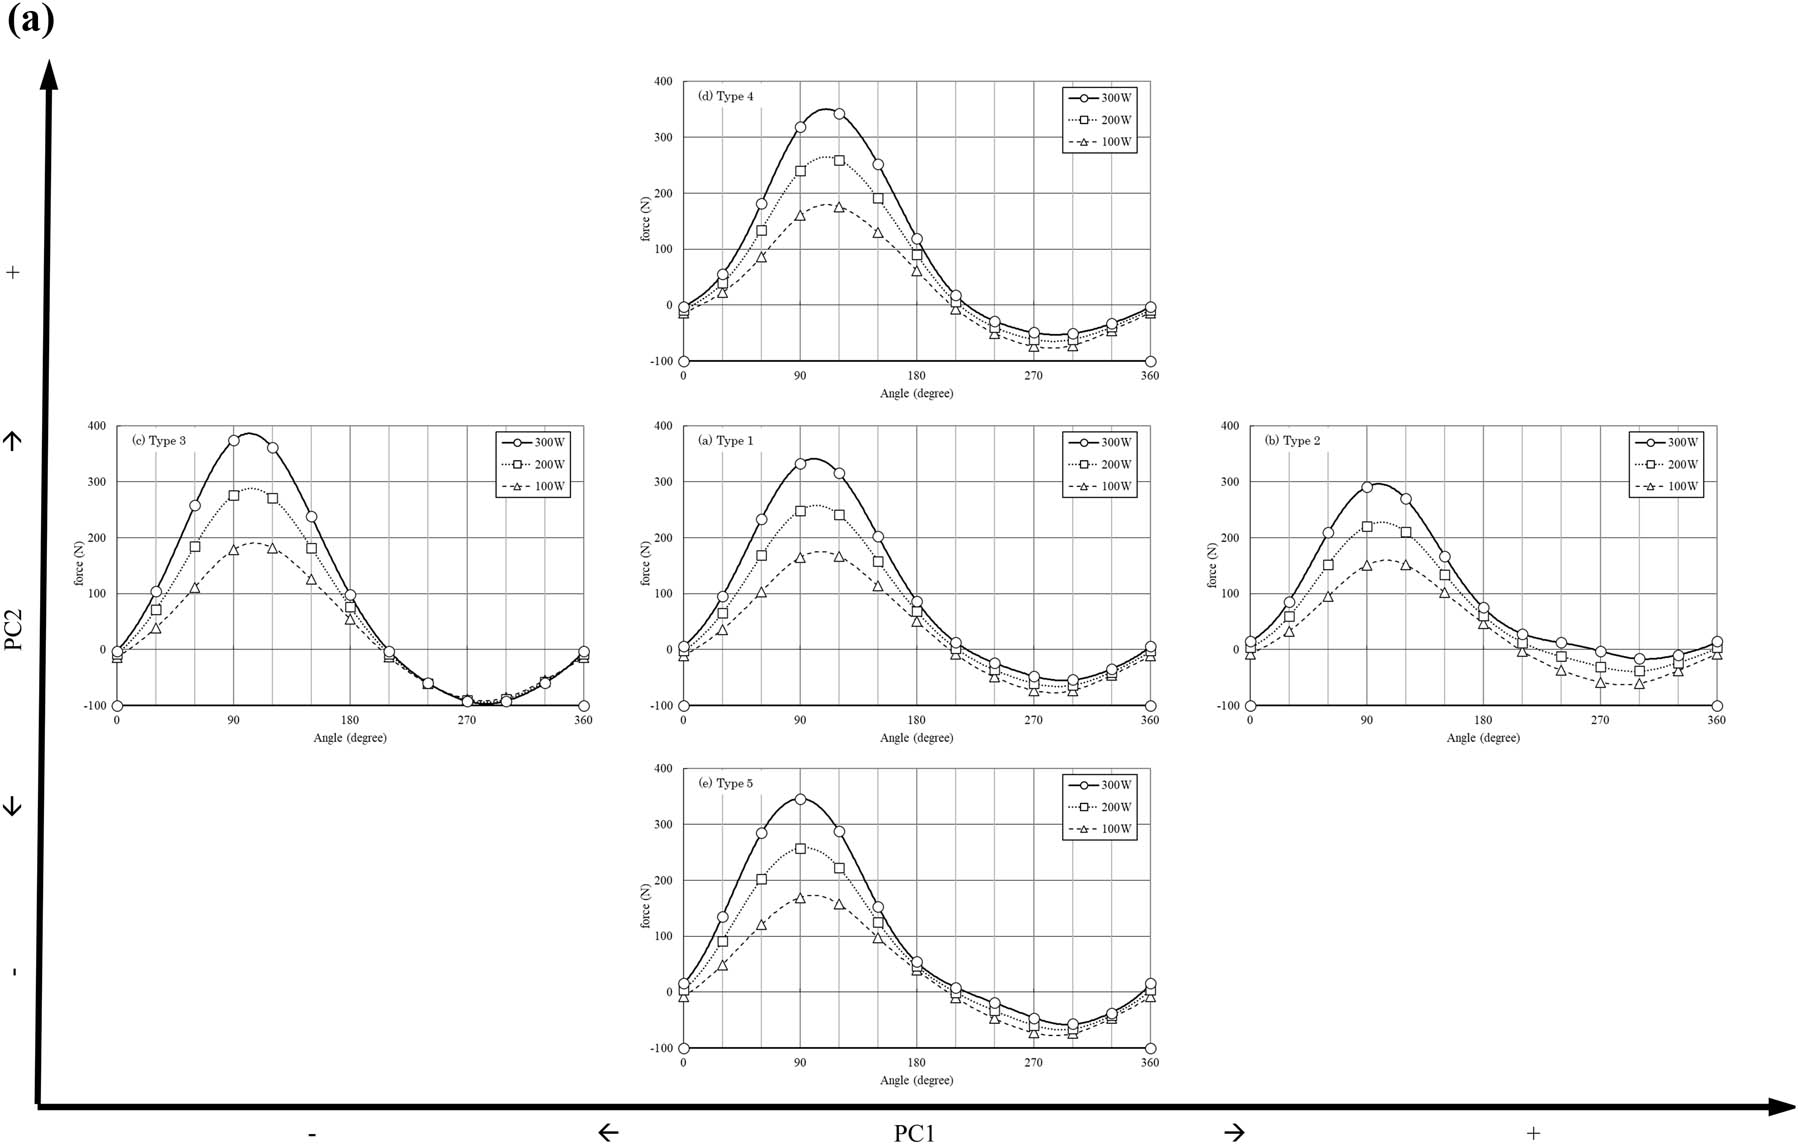
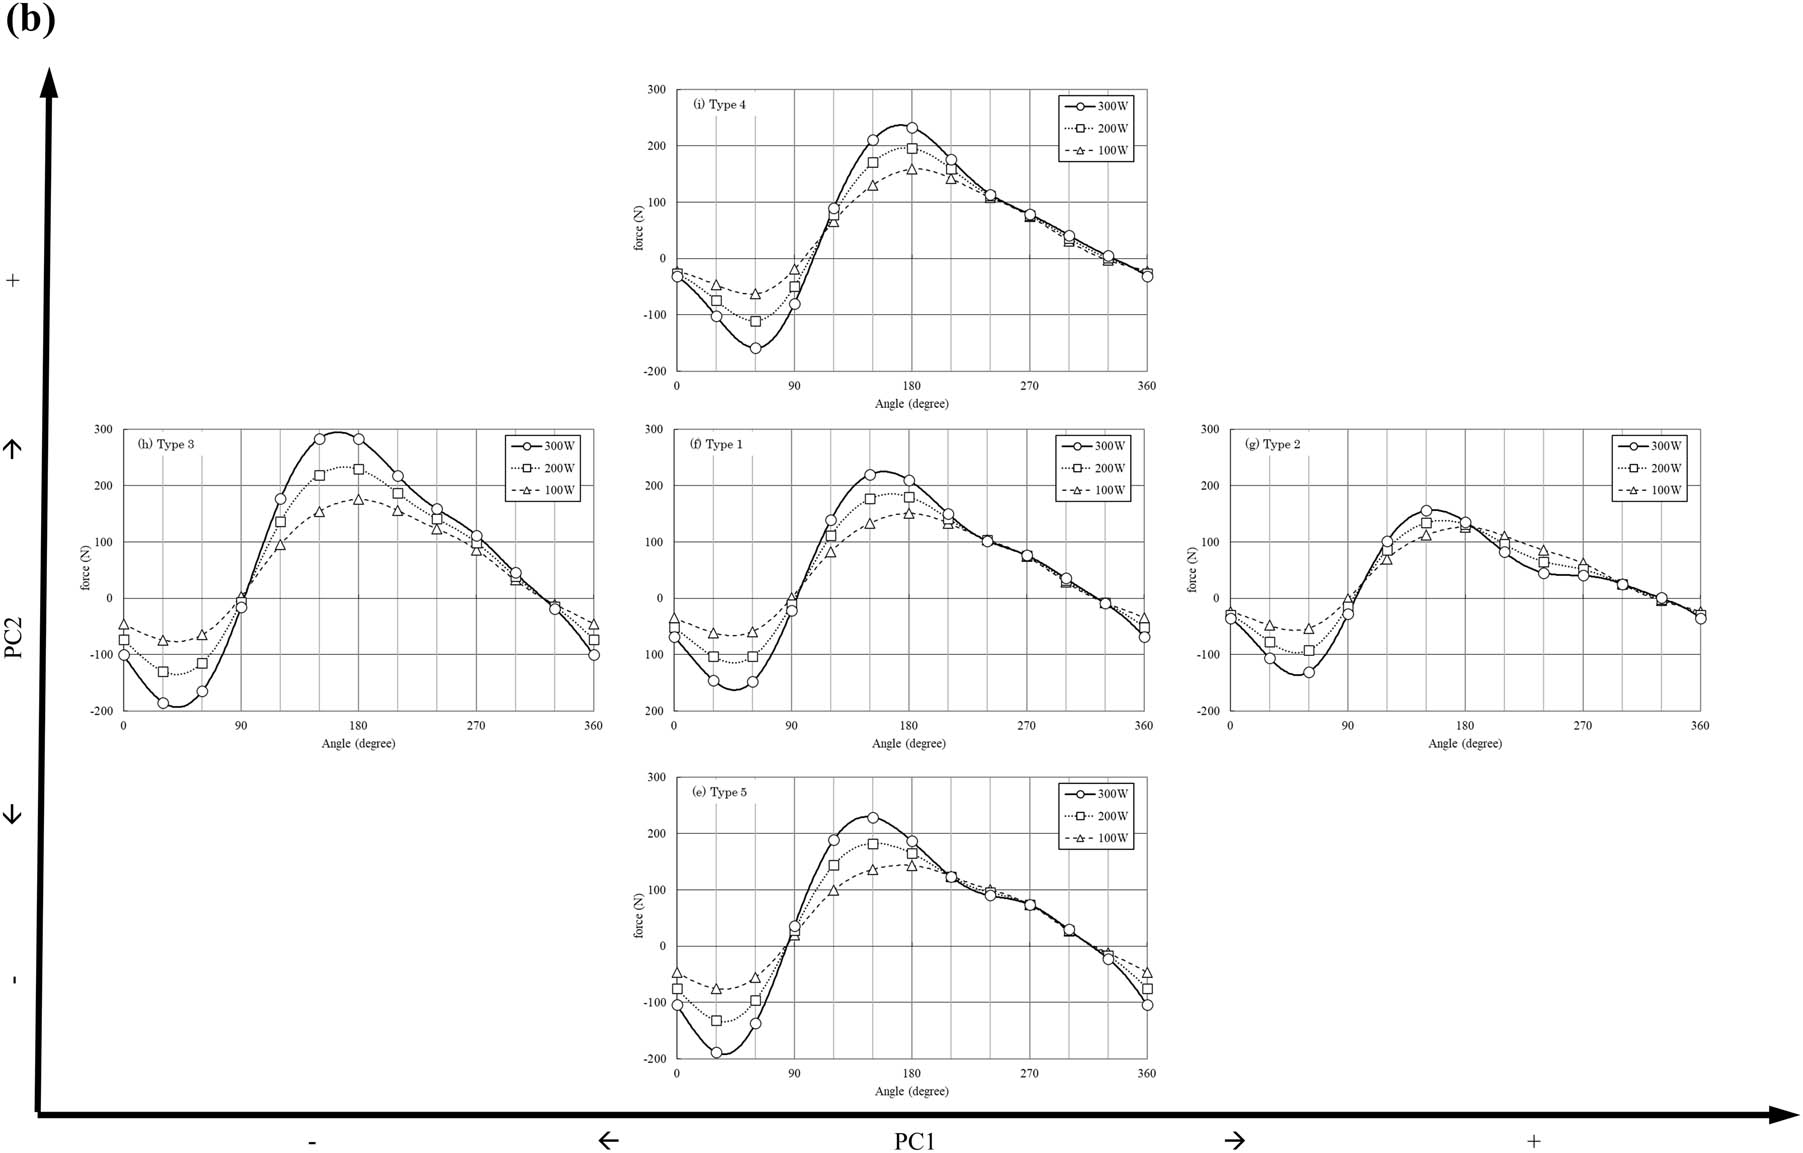
Figure 6
Changes in pedal force vector waveforms by principal component values; effects of PC1 (horizontal axis) and PC2 (vertical axis) at mean loads of 100, 200, and 300 W. (a) Tangential force. (b) Radial force.
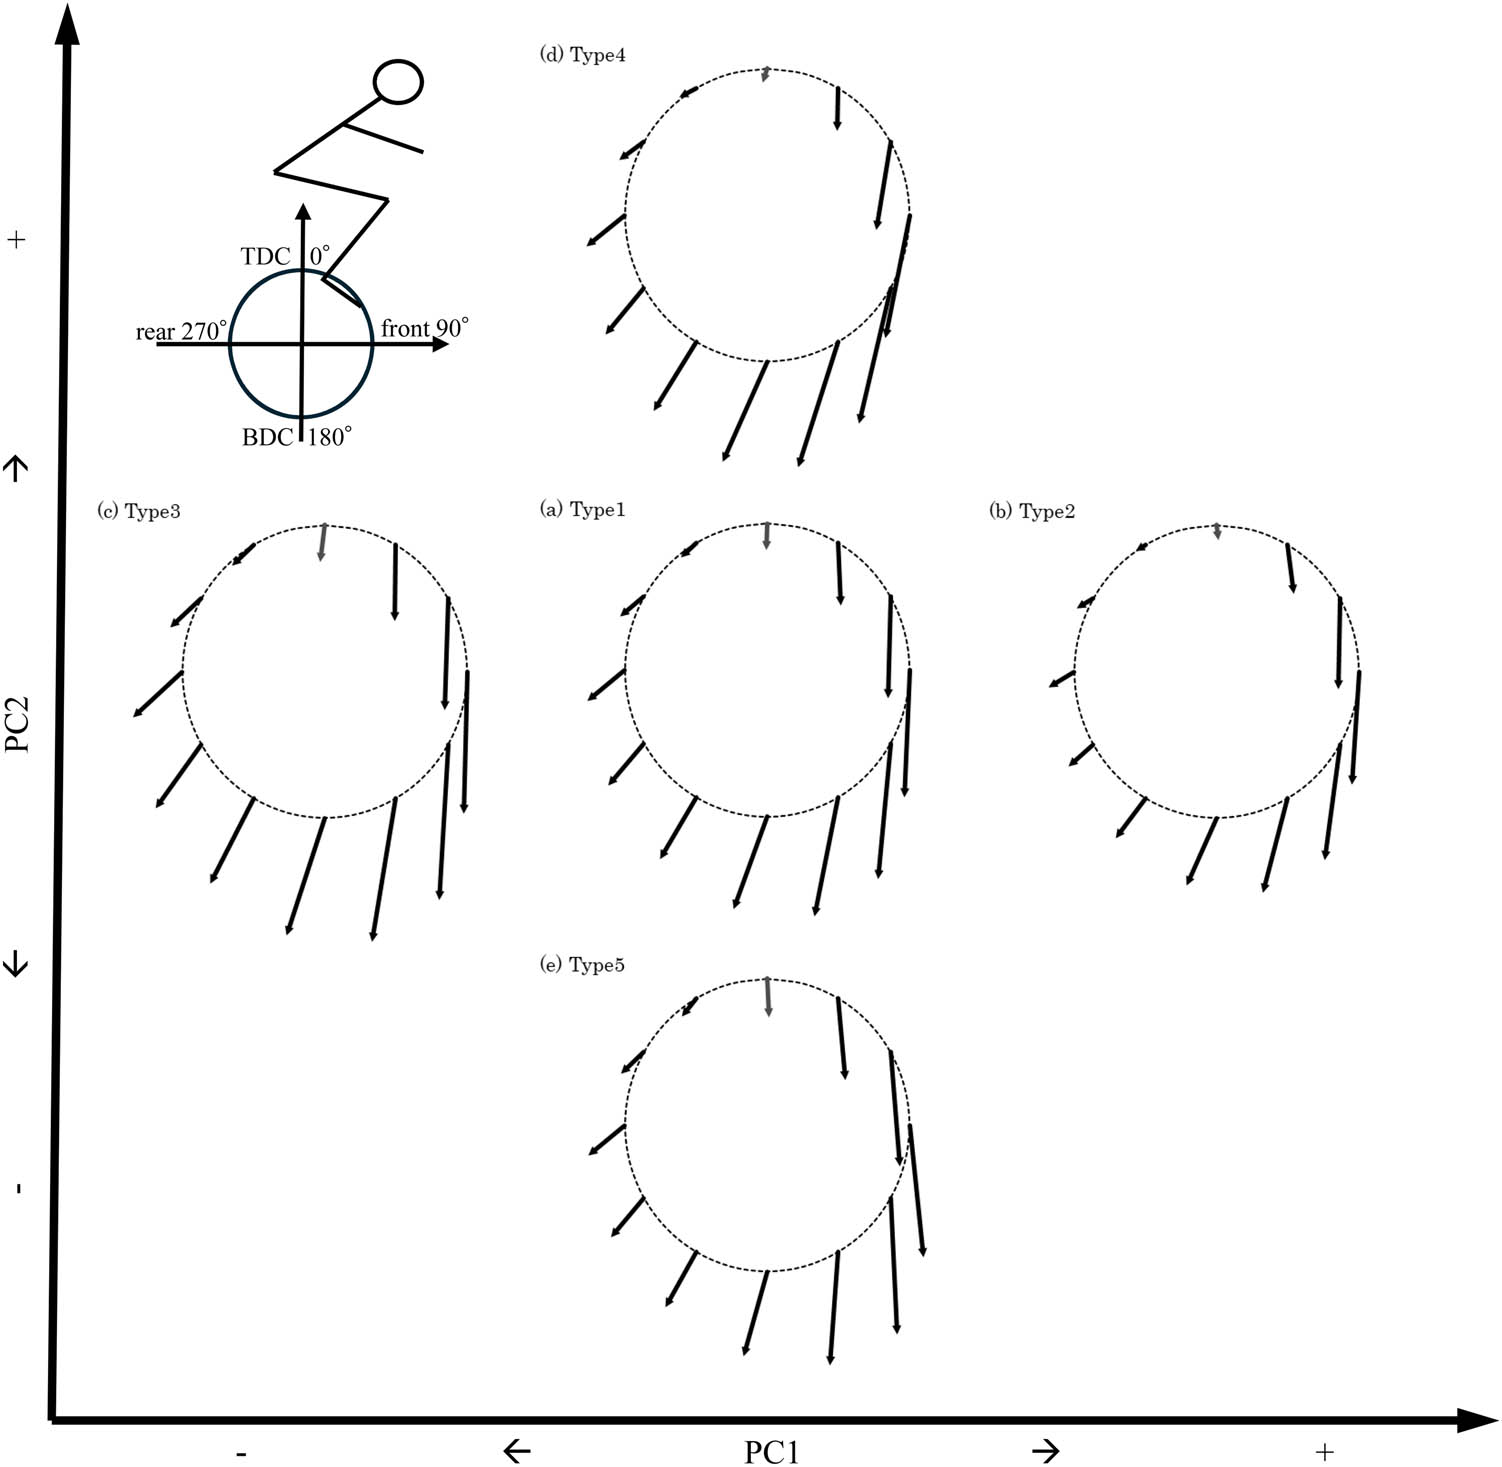
Figure 7
Changes in pedal force vector waveforms by principal component values; vector representation at 30° intervals under a mean load of 200 W.
In addition, Figure 7 presents pedal force vectors at 200 W for each type in the same arrangement as shown in Figure 6, plotted according to the pedal position at that moment in a circular representation. From these figures, it can be observed that, compared to Type 1 (average pedaling in the center), Type 2 on the right has less downstroke force and stronger upstroke force, Type 3 on the left is dominated by downstroke force, Type 4 above demonstrates delayed timing for downstroke force, and Type 5 below exhibits early timing for downstroke force.
Figure 8 shows a scatterplot of PC1 and PC2 for each participant. In the figure, participants with Pro attribute are indicated by ○ and non-Pro participants by ●. The × marks indicate the center of the two principal components and points at distances of ±σ k from the center for PC1 and PC2, representing the principal component values for the five pedaling types.
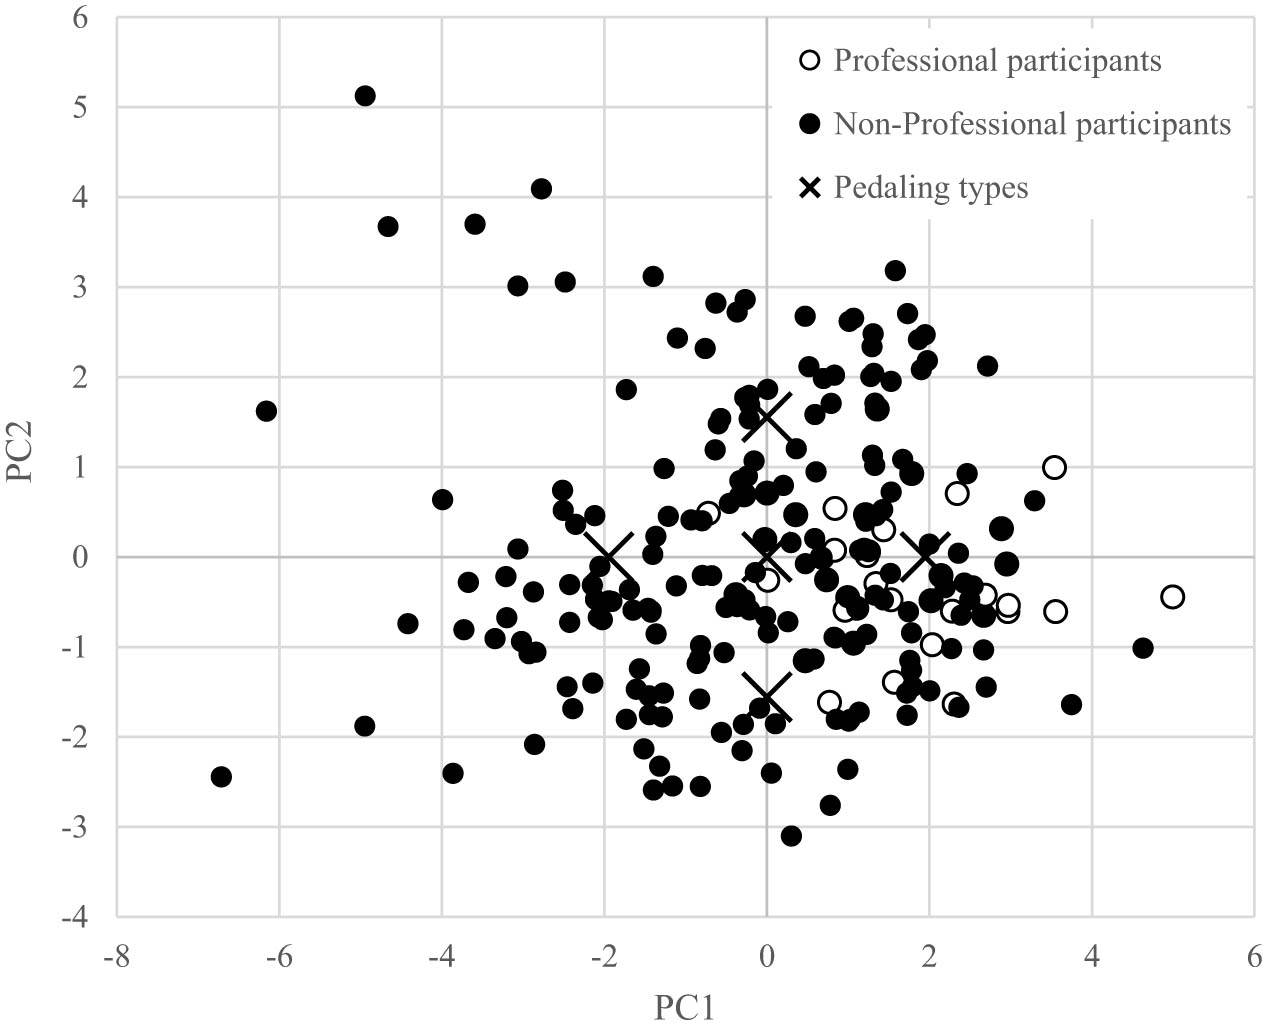
Figure 8
Scatterplot of principal components 1 and 2; professional participants (○) and nonprofessional participants (●), with × indicating the five pedaling types.
3.5. Statistical test results for principal component value differences
Statistical comparisons between Pro and non-Pro participants were performed using the Wilcoxon rank-sum test for central tendency and the Brown–Forsythe test for variability. For PC1, the median (p < 0.0001) and variability (p = 0.0007) differed significantly between the Pro and non-Pro participants. In contrast, for PC2, no significant difference was observed in the median, whereas variability differed significantly (p < 0.0001). Detailed results are presented in Table 3.
Table 3
Results of statistical tests for differences in principal component values (* p < 0.001)
| Professional participants | Nonprofessional participants | Median | Variability | |||||
|---|---|---|---|---|---|---|---|---|
| 25% quartile | Median | 75% quartile | 25% quartile | Median | 75% quartile | p | p | |
| PC1 | 0.76 | 1.30 | 2.31 | −1.59 | −0.27 | 1.29 | <0.0001* | 0.0007* |
| PC2 | −0.59 | −0.26 | 0.35 | −1.13 | −0.32 | 1.16 | 0.4238 | <0.0001* |
4. Discussion
4.1. Data conditions
The data analyzed in this study were extracted from outdoor cycling sessions. While the typical workload during outdoor activities was approximately 200 W, data of extremely high or low workloads were also included, representing a wide range of pedaling conditions. Although the RMS error values (shown in Figure 4) varied in magnitude across angles, the mean value was approximately 1–3 N (at most less than 10 N), which was sufficiently small compared with the average load of 100 W (shown in Figure 3) for regression calculations. Thus, even for outdoor cycling data measured in various outdoor environments, the linear relationship between the instantaneous pedal force variation at each angle and workload variation was well maintained, and slope calculation through linear approximation could be appropriately performed for most participants by properly extracting pedaling data during cycling.
In addition, as the present method relies on the slope of pedal force with respect to total load, systematic errors in sensor sensitivity are expected to be largely canceled out, representing an advantage of this approach.
4.2. Results of principal component analysis
PCA using all calculated slope values (24 degrees of freedom in total: 12 elements at 30° intervals for both radial and tangential directions) demonstrated that each participant’s pedaling strategy characteristics could be explained primarily by approximately four principal components based on eigenvalue magnitudes and cumulative contribution ratios (shown in Table 2). In the PCA conducted in this study, data were mean centered but not scaled. This approach was adopted because the importance of pedaling force inclination varies across crank angles; for example, angles where pedaling force is large have a high impact, while regions such as the top dead center have a low impact. Therefore, the study aimed to preserve the influence of inclination at each crank angle as is. In this study, we focused on the fact that the cumulative contribution ratio of the top two principal components (PC1 and PC2) was sufficiently large at 64.6% and conducted subsequent analyses considering that important characteristics of the pedaling strategy are contained in these principal components. Incorporating PC3 and PC4 increased the cumulative contribution ratio to 83.4%, enabling a more detailed analysis of the pedaling strategy; however, analysis of higher-order principal components remains a topic for future research.
4.3. Pedaling strategy represented by principal component values
The pedaling strategy represented by PC1 differed between Types 2 and 3, indicating a coordinated force application between the downstroke and upstroke legs.
From the changes in pedal force vector waveforms (shown in Figure 6), the increase in the tangential force during the downstroke phase (30°–150°) with increasing load was greater for Type 3 than for Type 2. Conversely, during the leg pull-up phase (210°–330°), the negative pedal force due to decreases in leg weight in Type 2 (particularly at a high load of 300 W, where the pedal force is nearly zero), whereas Type 3 shows no change in pedal forces. Similarly, in the radial direction, Type 3 generated larger pedal forces than Type 2, resulting in a greater nonpropulsive force. Furthermore, Type 2 produced a tangential component output of the pedal force vector for a prolonged duration, reflecting a pedaling strategy that effectively converts forces to propulsion. In contrast, Type 3 responded to increased load only with downstroke forces, generating downward vectors that resulted in inefficient pedaling with large pedal forces near the bottom dead center but with little propulsive component. Thus, the pedaling strategy represented by PC1 reflected the overall coordination of force application between the downstroke and upstroke legs, and higher PC1 values indicated a more effective pedaling strategy.
As shown in Figure 6, at 300 W load, the angle at which the maximum pedal force is achieved is 110° (late) for Type 4 and 90° (early) for Type 5. Additionally, as shown in Figure 7, the direction of pedal force vectors is diagonally backward near the bottom dead center for Type 4 and diagonally forward during downstroke phase for Type 5, generating a more propulsive force than Type 3 but relatively low overall efficiency. Thus, the pedaling strategy associated with PC2 manifests as differences in downstroke timing, and excessively early or late timing reflects a suboptimal pedaling strategy.
Thus, PC1, which represents coordinated force application during downstroke and upstroke, and PC2, which represents differences in downstroke timings, can be used as indicators of the pedaling strategy.
4.4. Evaluation of pedaling strategy using principal component values
Figure 8 shows a scatter plot of PC1 and PC2 values. While non-Pro participants (●) are widely distributed, participants with Pro attribute (○) are concentrated in a narrow region with positive PC1 values and PC2 values centered around zero, and the principal component values for Type 2 align with the center of this region. Table 3 shows that statistically significant differences were observed between professional and nonprofessional participants in the distribution of principal component values (PC1 and PC2). Thus, the pedaling strategy of participants with Pro attributes primarily exhibited Type 2 characteristics, which can be considered a desirable pedaling strategy that produces stable propulsion by coordinating force application between the downstroke and upstroke legs based on PC1.
Previous research has also shown that in elite cyclists’ pedaling movements, negative forces that were present at low loads increased to nearly zero as upstroke movement increased at higher loads [20]. Moreover, in the pedaling strategies of cyclists at different competitive levels, professional cyclists showed a smaller minimum downstroke force with increasing load compared to recreational cyclists [19]. These findings support Type 2 as a desirable pedaling strategy.
Conversely, when PC2 values deviate from the moderate range, the timing of the pedal downstroke under increasing load becomes either too late or too early, resulting in a pedaling strategy with poor overall efficiency that cannot be considered desirable pedaling. Previous research has reported that more experienced cyclists have more stable and relatively less variable pedal force timing and waveforms [24], and in elite cyclists’ pedaling movements, the crank angle at which the maximum load force appears gradually decreases [20]. These findings suggest that consistent control and stability are essential conditions for better pedaling.
Thus, Type 2 pedaling with positive PC1 and PC2 values near zero is considered a “desirable pedaling strategy”. Using the PCA method proposed in this study, individual cyclists’ pedaling strategies can be evaluated based on PC1 and PC2 values.
4.5. Comparison with conventional efficiency indices
Studies evaluating the IFE, which has been used as a pedaling technique indicator [16,17], focused on the leg pull-up movement and reported that while a constant pull-up movement increases the IFE, the physiological cost of the pull-up movement is high and decreases GE. In addition, the IFE does not necessarily represent effective or performant pedaling [18]. However, previous studies were conducted under artificial conditions with intentional emphasis on pull-up movements at constant load. The pedaling strategy observed in this study, “increasing pull-up movement in response to increased load”, differs from the constant pull-up movement observed in previous studies and can be interpreted as situation-adaptive motor control for maintaining power output, which is not contradictory to previous research findings. Rather, the present study findings indicate a realistic pedaling strategy: “under outdoor cycling conditions”, “with naturally varying load”, and “pull-up movement increases only to the minimum necessary level in response to increased load”. Specifically, at a low load, power was generated primarily through a downstroke movement without a significant pull-up movement; at a moderate load, the pull-up movement gradually increased in a supplementary manner; and at a high load, the pull-up movement increased while minimizing efficiency loss. This indicates that a “pedaling strategy of pulling only when and as much as necessary” is effective, representing a novel finding.
Thus, the efficiency index (IFE), which is conventionally used to evaluate pedaling techniques using values at a specific point in time, does not capture the pedaling strategy in response to varying loads. In contrast, the “principal component values calculated from slopes against load increase” proposed in this study can quantify the characteristics of the pedaling strategy and therefore represent a conceptually new type of indicator.
4.6. Limitations of the current study
This study included only 91 participants, and data of 219 cases were used in the final analysis when the left and right legs were analyzed separately. Furthermore, participant cadence was not restricted, and pedal force, rather than power values, was used directly for analysis. Moreover, outliers were excluded through data preprocessing, and mean values were divided into six levels for slope calculation. Nevertheless, linear regression performed well even with such limited pedaling data, and a wide range of pedaling strategies could be analyzed using principal component values from all calculated slope data, indicating that the analysis method proposed in this study is sufficiently robust. However, the current analysis method does not consider measurement-related issues, such as measurement variability in outdoor cycling data, inconsistent measurement conditions, and systematic errors in pedal force sensors, as well as the effects of participant saddle height, gear ratio, crank length, and cadence; furthermore, the potential confounding effects of these factors were not explicitly controlled for in this study. In addition, because the participants regularly ride bicycles equipped with pedal force vector sensors, a selection bias may be present, as such individuals are likely to be more conscious of their pedaling and may therefore represent a relatively more skilled cycling population.
Additionally, because only two principal components were used for evaluation in this study, there may be room for expressing pedaling strategies through higher-order principal component terms that were not addressed.
Furthermore, because this study was an observation-based retrospective data analysis and focused on proposing an analysis method, all obtained data were used for analysis, and validation with external data was not performed. Therefore, future research should evaluate the validity and appropriateness of the method proposed in this study by analyzing pedaling data from participants with clearly established pedaling characteristics or by comparing participant pedaling characteristics with measurement data obtained from other tools to quantify pedaling characteristics.
4.7. Possibilities for future research
As mentioned in Section 4.6, several research constraints necessitate caution when directly generalizing the findings of this study to other cyclist populations or data measured in external environments.
This study proposes the principal component values as a hypothesis. By comparing with values from other measurement devices used in laboratories, the actual meaning of principal components is expected to become clearer. Additionally, although this study limited the analysis to two principal components, further research is required for a more detailed pedaling strategy analysis by incorporating additional principal components.
Furthermore, while this study examined the analysis method using all activities as the analysis target, the SHIMANO CONNECT Lab also accumulates road gradient information and GPS information simultaneously, suggesting the possibility of evaluating pedaling movement under specific conditions, such as climbing, descending, or curved roads. Additionally, all analyses in this study used measurement data during seated pedaling and did not include out-of-saddle pedaling data. These issues should be addressed in future research.
Using the values obtained from the PCA, weight values corresponding to the current principal component values were calculated for newly measured pedal force data. In other words, because pedaling indicator values corresponding to PC1 and PC2 values can be calculated even for newly obtained measurement data, the position of participants from the PC1–PC2 scatter plot can be clearly indicated, enabling quantification of the pedaling strategy for each participant. This would enable quantification of the difference between each participant s pedaling strategy and a more desirable pedaling strategy, and could also indicate the direction for improving the participant s technique.
As a further application possibility, if weight values corresponding to principal component values could be presented to participants in real time, cyclists could receive immediate feedback for improving pedaling movements. The possibility of using such real-time analysis methods remains a topic for future research.
5. Conclusions
This study proposes a novel method for quantitatively evaluating cyclists’ pedaling strategies using pedal force vector data acquired from outdoor cycling. By numerically expressing the changes in pedal force at each crank angle in response to workload variation as slopes and applying PCA to these slope data, we confirmed that pedaling strategies across participants with different backgrounds can be represented using a small number of principal components. This method demonstrates the potential to directly evaluate individual cyclists’ pedaling strategies from actual measurement data under outdoor conditions, which cannot be fully captured using conventional efficiency indices.
Acknowledgments
The authors thank the cyclists who participated in this study for their collaboration. GPT-5.1 (OpenAI) was used to assist with literature search and obtain comments on manuscript organization. The final manuscript check was performed by Gemini and GPT5.1 on Claude Code. All scientific interpretations, analyses, and final decisions regarding the manuscript content were made solely by the authors. We would like to thank Editage (www.editage.jp) for English language editing.
Funding information
This study was supported by research funding from Shimano Inc. This study was conducted as part of a collaborative research project between Kansai Medical University and Shimano Inc. This research was supported in part by a JSPS KAKENHI Grant-in-Aid for Scientific Research (C), 19K11565.
Author contributions
M.F.: Conceptualization, Methodology, Formal analysis, Validation, Writing – original draft, Writing – review & editing. R.K.: Methodology, Data curation, Formal analysis, Validation, Writing – review & editing. T.I.: Methodology, Formal analysis, Validation, Writing – review & editing. T.K.: Conceptualization, Methodology, Formal analysis, Visualization, Validation, Writing – original draft, Writing – review & editing, Supervision, Project administration, Funding acquisition. All authors reviewed and approved the final manuscript.
Conflict of interest statement
Two authors of this study (RK and TI) are employees of Shimano Inc. One author of this study (MF) had previously received consulting fees from Shimano Inc. on bicycle pedaling motion. The authors declare no conflicts of interest related to this study.