
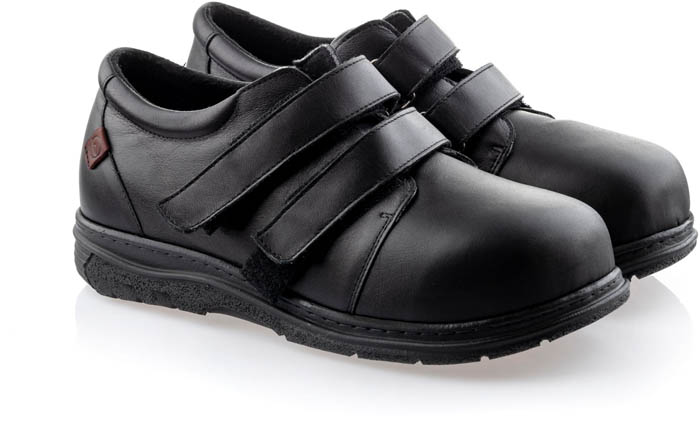
Figure 1
The PAPS® DIAB ME 8000 footwear used during data collection.
Table 1
Median (lower; upper quartile) values for dynamic balance, CoP measures, and plantar loading parameters under barefoot and inclined-shoe conditions (Shoe15 and Shoe20)
| Parameters | BF Trial | Shoe15 Trial | Shoe20 Trial | Friedman’s ANOVA and Dunn Bonferroni post-hoc |
|---|---|---|---|---|
| FRTi [−] | 11.2 (10.4; 13.5) | 13.5 (12.1; 16.7) | 13.3 (11.9; 15.1) | χ 2(40) = 7.52, p = 0.0232*; BF < Shoe20, p = 0.0261* |
| 95% Confidence ellipse area (mm²) | 847 (585; 1105) | 702 (541; 862) | 877 (811; 986) | χ 2(40) = 5.51, p = 0.0633 |
| CoP path length (mm) | 381 (350; 447) | 457 (393; 503) | 477 (443; 533) | χ 2(40) = 8, p = 0.0183*; BF < Shoe20, p = 0.0164* |
| CoP average velocity (mm/s) | 19 (17; 22) | 23 (20; 25) | 24 (22; 27) | χ 2(40) = 8.80, p = 0.0122*; BF < Shoe20, p = 0.0129* |
| Left forefoot (%) | 64 (63; 67) | 56 (54; 58) | 54 (52; 55) | χ 2(40) = 31.6, p = 0.0001*; BF > Shoe15, p = 0.0001*; BF > Shoe20, p = 0.0001* |
| Left backfoot (%) | 36 (33; 37) | 44 (42; 46) | 46 (45; 48) | χ 2(40) = 31.6, p = 0.0001*; BF < Shoe15, p = 0.0001*; BF < Shoe20, p = 0.0001* |
| Left total (%) | 91 (86; 94) | 30 (27; 32) | 31 (30; 32) | χ 2(40) = 32.76, p = 0.0001*; BF > Shoe15, p = 0.0001*; BF > Shoe20, p = 0.0001* |
| Right forefoot (%) | 58 (46; 81) | 49 (48; 50) | 50 (49; 51) | χ 2(40) = 5.07, p = 0.0791 |
| Right backfoot (%) | 42 (19; 54) | 51 (50; 52) | 50 (49; 51) | χ 2(40) = 5.07, p = 0.0791 |
| Right total (%) | 9 (6; 14) | 70 (68; 73) | 69 (68; 70) | χ 2(40) = 32.76, p = 0.0001*; BF < Shoe15, p = 0.0001*; BF < Shoe20, p = 0.0001* |
| Symmetry | ||||
| Left–right (%) | 91: 9 | 30: 70 | 31: 69 | χ 2(40) = 96.57, p = 0.0001* |
| Forefoot–Backfoot (left [%]) | 64: 36 | 56: 44 | 54: 46 | χ 2(40) = 96.11, p = 0.0001* |
| Forefoot–Backfoot (right [%]) | 58: 42 | 49: 51 | 50: 50 | χ 2(40) = 12.32, p = 0.0791 |