
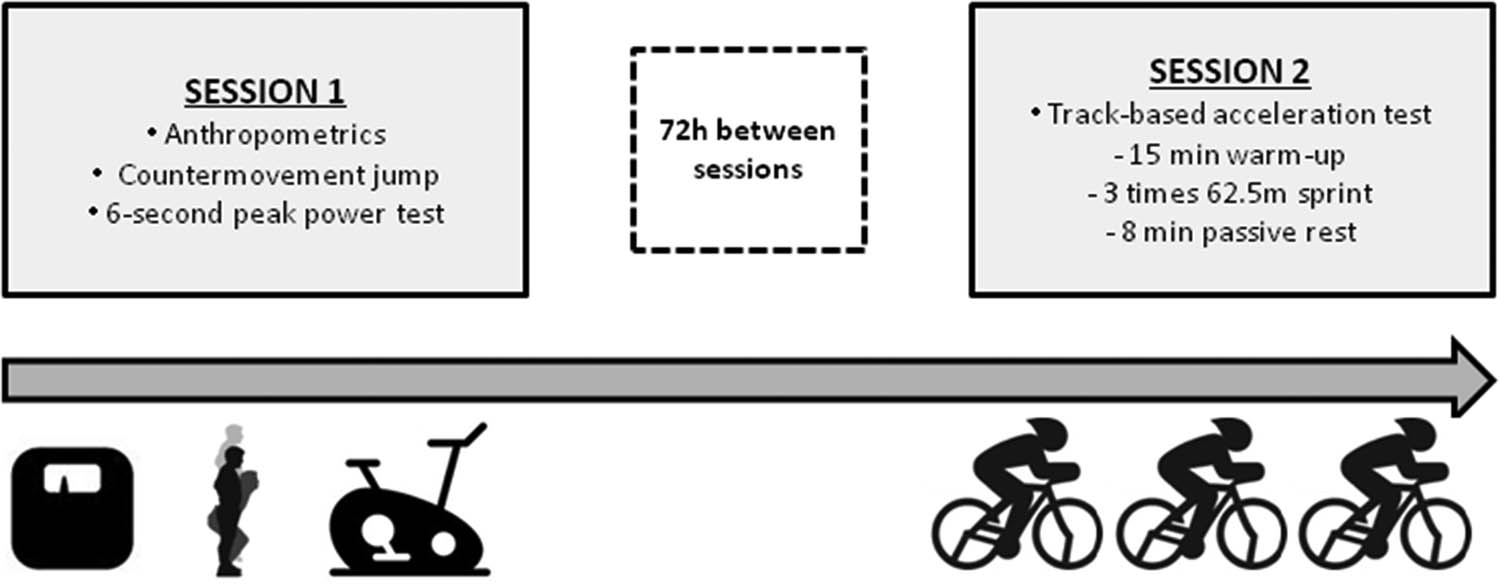
Figure 1
Study design protocol.
Table 1
Results of track-based performance test, Specific 6-second Peak Power Test and Non-specific Countermovement Jump (Mean ± SD and CV)
| Mean ± SD | CV (%) | |
|---|---|---|
| Track-based performance | ||
| TACC (s) | 6.91 ± 0.14 | 2.1 |
| Specific 6-second peak power test | ||
| PPO6s (W) | 2118 ± 245 | 11.6 |
| rPPO6s (W/kg) | 24.3 ± 2.0 | 8.2 |
| MPO6s (W) | 1934 ± 239 | 12.4 |
| rMPO6s (W/kg) | 22.2 ± 2.0 | 9.1 |
| Non-specific Countermovement Jump | ||
| CMJ (cm) | 50.8 ± 5.0 | 9.9 |
| PPOCMJ (W) | 4974 ± 480 | 9.7 |
| rPPOCMJ (W/kg) | 57.1 ± 3.4 | 5.9 |
Abbreviations: T ACC – acceleration time on 62.5 m, PPO6s – peak power output in 6 s test, rPPO6s – relative peak power output per body weight in 6 s test, MPO6s – mean power in 6 s test, relative MPO6s – relative mean power per body weight in 6 s test, CMJ – countermovement jump, PPOCMJ – peak power output calculated from CMJ, rPPOCMJ – relative peak power output per body weight calculated from CMJ.
Table 2
Matrix of Pearson’s correlation coefficients
| T ACC | PPO6s | rPPO6″ | MPO6″ | rMPO6″ | CMJ | PPOCMJ | rPPOCMJ | |
|---|---|---|---|---|---|---|---|---|
| T ACC | X | −0.73** | −0,80** | −0.78** | −0.86*** | −0.87*** | −0.72** | −0.85*** |
| PPO6s | X | 0.78** | 0.98*** | 0.77** | 0.79** | 0.94*** | 0.65* | |
| rPPO6″ | X | 0.77** | 0.96*** | 0.87*** | 0.63* | 0.88*** | ||
| MPO6″ | X | 0.82*** | 0.81*** | 0.94*** | 0.68* | |||
| rMPO6″ | X | 0.89*** | 0.66** | 0.89*** | ||||
| CMJ | X | 0.81*** | 0.97*** | |||||
| PPOCMJ | X | 0.68* | ||||||
| rPPOCMJ | X |
Abbreviations: TACC – acceleration time on 62.5 m, PPO6″ – peak power output in 6 s test, rPPO6″ – relative peak power output per body weight in 6 s test, MPO6″ – mean power in 6 s test, rMPO6″ – relative mean power per body weight in 6 s test, CMJ – countermovement jump height, PPOCMJ – peak power output calculated from CMJ, rPPOCMJ – relative peak power output per body weight calculated from CMJ. Statistically significant: * – p < 0.05, ** – p < 0.01, *** – p < 0.001.
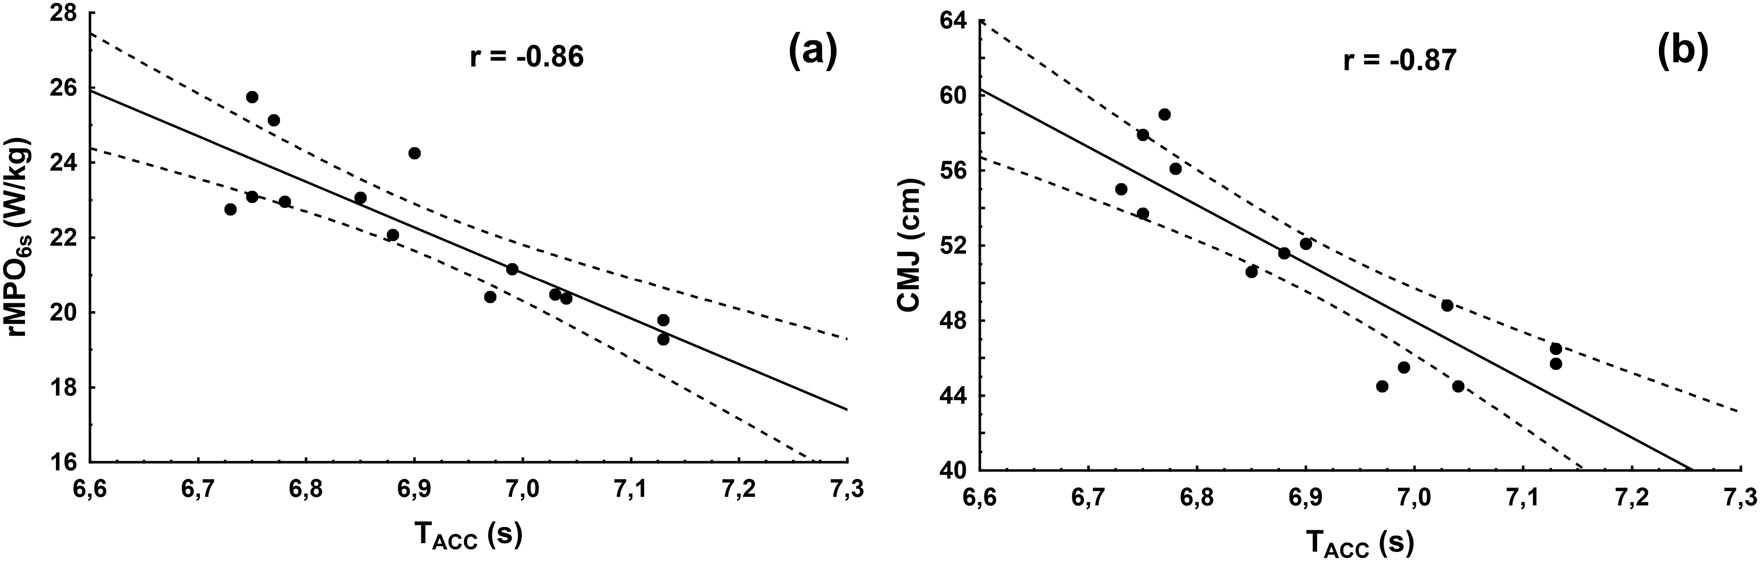
Figure 2
The Pearson’s correlation between T ACC and relative avgPO6s (a), CMJ height (b).