
1. Introduction
The initial acceleration phase is an important component of individual and team sprint events in track cycling that are included in the Olympic Games program. The acceleration phase during the first lap of sprint events is a critical determinant of overall performance. In major competitions, teams that recorded faster opening laps demonstrated a significantly higher likelihood of securing a medal [1]. Neuromuscular variables, such as maximum strength and power, remain crucial factors determining first lap performance, compared to the widely discussed metabolic approach [1,2,3]. Recent research published by Kordi and van Rijswijk [1] has shown that the 15 m, 65 m, and 125 m split times are related to peak torque and peak power output (PPO) normalized to system mass. In turn, PPO is determined by mechanical and morphological properties of muscles, such as isometric cycling torque, peak torque of knee extensors [4], quadriceps and hamstrings volume, and pennation angle of vastus lateralis [5]. Moreover, important roles of activation-relaxation kinetics and neuromuscular coordination across the continuum of possible movement frequencies were reported [6]. Additionally, Douglas et al. [6] showed that during a maximal 500 m time trial, PPO exists during the acceleration phase, that is, before achieving maximal velocity. In summary, the acceleration phase remains crucial for sprint track cycling performance and is associated with athletes’ mechanical power and lower-body muscle function.
In track cycling, various sport-specific or non-specific tests are performed to assess muscle function for athlete development [7], talent identification [8], and fatigue monitoring during training sessions [9]. A specific method for measuring peak power output in cycling is a 6-second all-out test on a cycle ergometer [10,11]. In contrast, a non-specific approach is the countermovement jump (CMJ), a feasible, common, and practical tool used in sports science and strength and conditioning [8,12]. Although both assessments are commonly used, the relationship between their results remains inconclusive [8,13]. Notably, the need for research addressing testing methods in track cycling was recently emphasized [7].
Therefore, we examined the relationship between mechanical performance from two tests: i) a specific 6-second all-out test on a cycle ergometer; ii) non-specific countermovement jump and acceleration performance in elite sprint track cyclists. We hypothesized that results derived from both tests would correlate with the acceleration performance.
2. Materials and methods
2.1. Participants
Fourteen elite male sprint track cyclists participated in this study. Their characteristic are as follows (mean ± SD): age 23.6 ± 3.3 (years), body height 177.4 ± 4.5 (cm), body weight (BW) 87.1 ± 6.5 (kg), percentage of body fat 11.8 ± 3.2 (%), training experience 9.5 ± 3.5 (years). All the participants were members of the Polish elite national team, routinely competed in sprint track cycling events, and were recruited with convenience sampling. The exclusion criteria were: any chronic medical condition, any acute medical condition within the last 3 months, lower-limb injuries within the last 6 months, and any ongoing medication intake. Each participant received written information about the benefits and risks of the experiment, and provided written informed consent. The study received approval from the Institutional Senate Research Ethics Committee (project identification code: 40/2025), and was conducted in accordance with the Declaration of Helsinki.
2.2. Study design
The experimental protocol lasted one week and included two sessions performed on an indoor cycling velodrome with 72 hours between (Figure 1). During the first day, participants performed body composition analysis, non-specific countermovement jump (CMJ), and a specific 6-second peak power test on a cycle ergometer (PPT6s). The second session consisted of track-based acceleration tests. Participants had one easy training day and one total rest day before each testing session. Both sessions were conducted at the same time of day (10:00 a.m.).
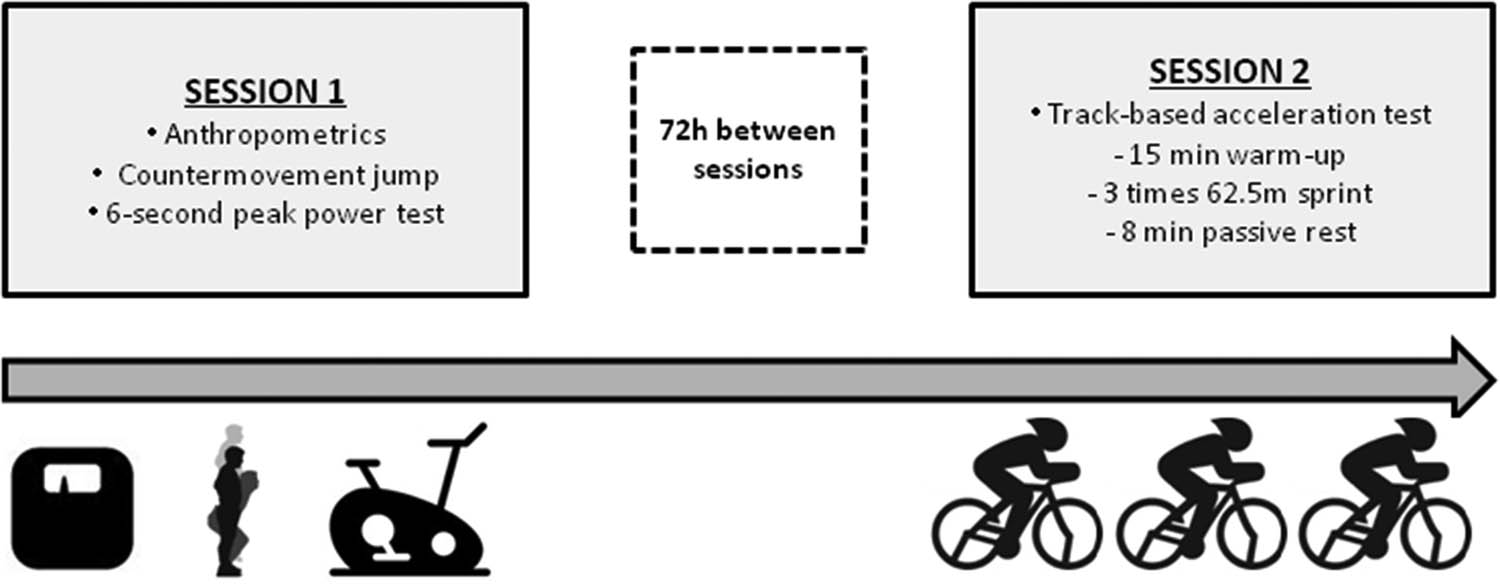
Figure 1
Study design protocol.
2.3. Anthropometry and body composition
All the anthropometric measurements were performed before breakfast, in the fasted state. The WPT 200 medical scale (RADWAG, Radom, Poland) was used to measure height and weight. The BMI–Quetelet’s index was calculated using the following formula: body weight∙body height−2. Body composition was assessed by a 2D ultrasound technology device BodyMetrix™ BX-2000 (IntelaMetrix, Livermore, United States). The device has been validated and provides a reliable measurement of the measured body fat [14]. Measurements based on the Jackson and Pollock three-point scale included the following points: on the chest, waist, and front of the thigh. Exact locations of these points were clearly shown by the computer program Body View Professional Software (IntelaMetrix, Livermore, United States). After recording subcutaneous adipose tissue thickness at each measurement, body fat and percentage of body fat in the total body weight were automatically calculated.
2.4. Countermovement jump test (CMJ)
Three maximal CMJ’s with 60 s between each jump using OptoJump (MicroGate, Bolzano, Italy). Each CMJ started with the subjects standing between two bars, with their knees fully extended and their hands on their hips to eliminate the influence of arm swing. Cyclists were then instructed to descend to a self-selected countermovement depth and to jump as high and quickly as possible. The average jump height (cm) was collected for each time point for further data evaluation. Previous research published by Glatthorn et al. [15] showed very high validity (intraclass correlation coefficients (ICCs) 0.997−0.998) and excellent test-retest reliability (ICCs ranging from 0.982 to 0.989). Peak power output from CMJ (PPOCMJ) was calculated using the Sayers et al. [16] equation:
Also, relative peak power output per body weight was calculated (rPPOCMJ).2.5. Specific 6-second peak power test (PPT6s)
The six-second all-out sprint test was performed on a Wattbike cycle ergometer (Wattbike Ltd, Nottingham, UK) to determine peak power output (PPO6s), PPO expressed per body weight (rPPO6s), mean power (MPO6s) and mean power divided per body weight (rMPO6s). The test was preceded by a warm-up, which was carried out according to Herbert et al. [11]. The warm-up consisted of 5 min moderate intensity cycling at air braking resistance level 8, where rating of perceived exertion corresponds to 11–13 (light to somewhat hard), incorporating two 3 s all-out bouts after 90 and 180 s. After that, a 5 min recovery in the seated position. The start of the test was initiated following 5 s countdown. The test was conducted with a dominant leg initiating the first down-stroke from a standing position due to the possibility of obtaining higher power [9,17]. The resistance was set at maximal load, including magnetic (level 7) and air (level 10). Participants were verbally encouraged to make maximal effort during the test.
2.6. Track-based acceleration test
This test session was carried out on an indoor 250 m length velodrome with a wood surface, with a straight inclination at 12° and a bands inclination at 42°. The Union Cycliste Internationale (UCI) approved this velodrome to organize international track cycling events. The exercise protocol started with a 15-minute track cycling warm-up using gear ratio 48:16 (chain ring: cog) with moderate intensity riding (rate of perceived exertion 3–5 on a 1–10 scale). After that, cyclists performed 5 minutes of mobility exercise and three short accelerations (12.5 m) (gear ratio 3.33). First from slow rolling and next from the starting gate, interspersed by 5 minutes of passive rest. The main part of the test consisted of three maximal start accelerations and sprints from the standing start at a distance of 1/4 lap (62.5 m) (gear ratio 3.33) with 8 min of passive rest. Acceleration time (TACC) was measured by an electronic timekeeping system based on dual-beam photocells (Witty System, Microgate, Italy) with an accuracy of 0.01 s.
2.7. Inertial load and moment of inertia calculation
The ability of acceleration of the rider-bicycle system is represented by the inertial load (IL) and was evaluated according to Gardner et al. [10]. The inertial load was calculated from the equation:
where G is the gear ratio (in m), and I is the moment of inertia for the bicycle-rider system. In turn, the moment of inertia (I) was determined as:where M is the combined mass of the rider (including full racing outfit) and the bicycle mass of two additional tires and rims (in kg), and r is the outside radius of the bicycle tire.The acceleration capacity of the rider-bicycle system was represented by inertial load (IL) and was evaluated according to Gardner et al. [10]. The inertial load was calculated using the following equation:
where G is the gear ratio (in m), and I is the moment of inertia of the rider-bicycle system. The moment of inertia (I) was estimated using the commonly applied approximation:where M is the combined mass of the rider (including full racing outfit) and the bicycle, with additional consideration of the mass of the rims and tires, and r is the external radius of the bicycle wheel. This approach is consistent with previously applied methods in cycling research, where the equivalent moment of inertia of the bicycle–rider system is approximated based on total system mass and wheel radius [18].2.8. Statistical analysis
IBM SPSS Statistics version 26 (IBM Inc., Chicago, IL, USA) and GraphPad Prism (v. 10.4.1, GraphPad Software, USA) were used for data analysis. Data were shown as (mean ± SD and coefficient of variation (CV). The Shapiro–Wilk test was used to assess the normality of the distribution of the examined variables. After testing for assumptions, a paired Student’s t-test was used to analyze differences in PPO between tests, and Pearson’s correlation coefficient was calculated to examine the relationship between the variables. The calculated threshold values of correlation coefficients 0.1, 0.3, 0.5, 0.7, and 0.9 were interpreted as small, moderate, large, very large, and extremely large correlations, respectively [19]. For all analyses, the level of p ≤ 0.05 was considered significant.
3. Results
Table 1 presents the performance variables obtained from specific PPT6s, non-specific CMJ measurements, and T ACC. PPO6s was lower than PPOCMJ (p < 0.001); similarly, rPPO6s was lower than rPPOCMJ (p < 0.001) (Table 1).
Table 1
Results of track-based performance test, Specific 6-second Peak Power Test and Non-specific Countermovement Jump (Mean ± SD and CV)
| Mean ± SD | CV (%) | |
|---|---|---|
| Track-based performance | ||
| TACC (s) | 6.91 ± 0.14 | 2.1 |
| Specific 6-second peak power test | ||
| PPO6s (W) | 2118 ± 245 | 11.6 |
| rPPO6s (W/kg) | 24.3 ± 2.0 | 8.2 |
| MPO6s (W) | 1934 ± 239 | 12.4 |
| rMPO6s (W/kg) | 22.2 ± 2.0 | 9.1 |
| Non-specific Countermovement Jump | ||
| CMJ (cm) | 50.8 ± 5.0 | 9.9 |
| PPOCMJ (W) | 4974 ± 480 | 9.7 |
| rPPOCMJ (W/kg) | 57.1 ± 3.4 | 5.9 |
Abbreviations: T ACC – acceleration time on 62.5 m, PPO6s – peak power output in 6 s test, rPPO6s – relative peak power output per body weight in 6 s test, MPO6s – mean power in 6 s test, relative MPO6s – relative mean power per body weight in 6 s test, CMJ – countermovement jump, PPOCMJ – peak power output calculated from CMJ, rPPOCMJ – relative peak power output per body weight calculated from CMJ.
The full correlation matrix is presented in Table 2. Most importantly, T ACC was very largely correlated with PPO6s (r = −0.73, p < 0.01), rPPO6s (r = −0.80, p < 0.01), MPO6s (r = −0.78, p < 0.01), and rMPO6s (r = −0.86, p < 0.001) (Figure 2). Additionally, T ACC was very largely associated with CMJ height (r = −0.87, p < 0.001) (Figure 2), absolute PPOCMJ (r = −0.72, p < 0.01), and rPPOCMJ (r = −0.85, p < 0.001).
Table 2
Matrix of Pearson’s correlation coefficients
| T ACC | PPO6s | rPPO6″ | MPO6″ | rMPO6″ | CMJ | PPOCMJ | rPPOCMJ | |
|---|---|---|---|---|---|---|---|---|
| T ACC | X | −0.73** | −0,80** | −0.78** | −0.86*** | −0.87*** | −0.72** | −0.85*** |
| PPO6s | X | 0.78** | 0.98*** | 0.77** | 0.79** | 0.94*** | 0.65* | |
| rPPO6″ | X | 0.77** | 0.96*** | 0.87*** | 0.63* | 0.88*** | ||
| MPO6″ | X | 0.82*** | 0.81*** | 0.94*** | 0.68* | |||
| rMPO6″ | X | 0.89*** | 0.66** | 0.89*** | ||||
| CMJ | X | 0.81*** | 0.97*** | |||||
| PPOCMJ | X | 0.68* | ||||||
| rPPOCMJ | X |
Abbreviations: TACC – acceleration time on 62.5 m, PPO6″ – peak power output in 6 s test, rPPO6″ – relative peak power output per body weight in 6 s test, MPO6″ – mean power in 6 s test, rMPO6″ – relative mean power per body weight in 6 s test, CMJ – countermovement jump height, PPOCMJ – peak power output calculated from CMJ, rPPOCMJ – relative peak power output per body weight calculated from CMJ. Statistically significant: * – p < 0.05, ** – p < 0.01, *** – p < 0.001.
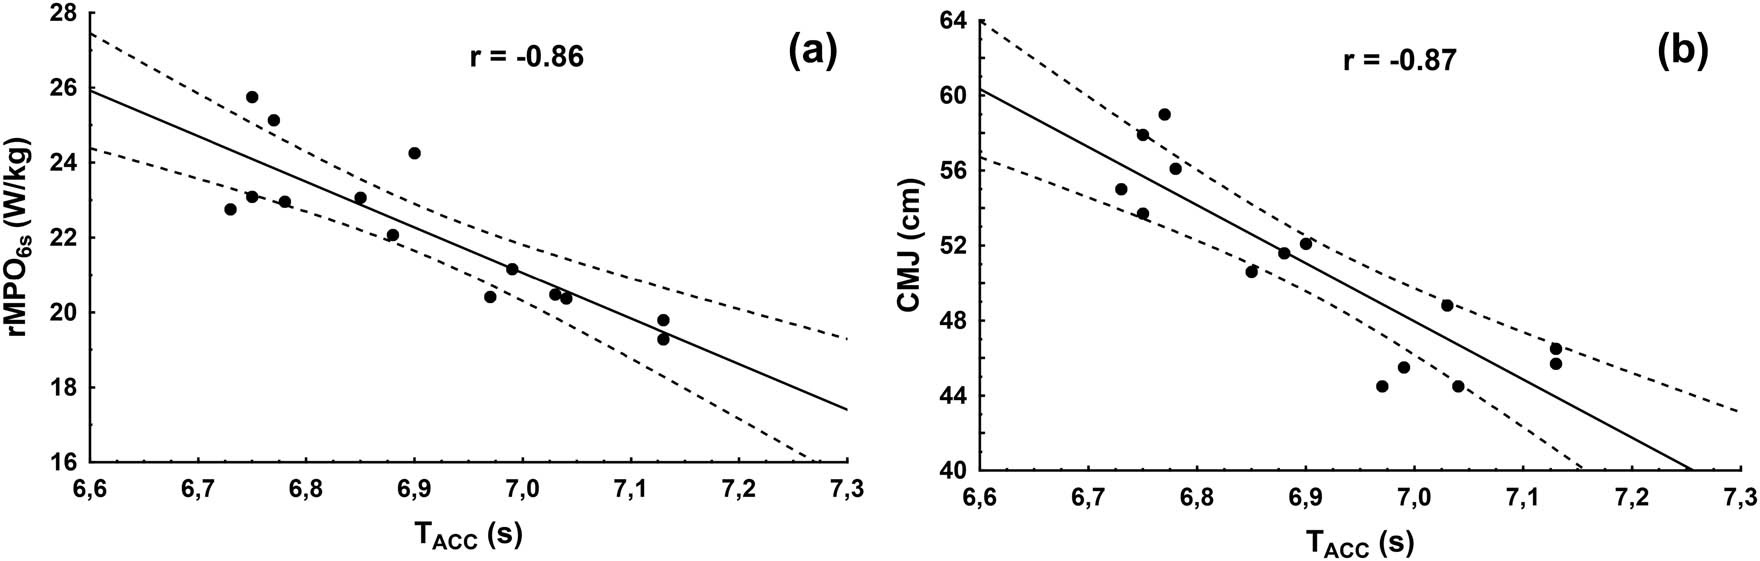
Figure 2
The Pearson’s correlation between T ACC and relative avgPO6s (a), CMJ height (b).
Moment of inertia was equal 11.0 ± 0.7 (kg m2), and inertial load was 61.1 ± 4.2 (kg·m2). Very large significant correlations were found between I and IL with PPO6s (r = 0.71, p < 0.01), and large with MPO6s (r = 0.69, p < 0.01).
4. Discussion
The study examined the relationship between mechanical performance 6-second all-out test, CMJ, and acceleration performance in elite sprint track cyclists. The results revealed very large correlations between the specific PPT6s, non-specific CMJ test results, and T ACC with minimal inter-individual variability. These findings confirm an important influence of neuromuscular capabilities on the acceleration phase in sprint track cycling and provide novel insight regarding relevant testing strategies.
The obtained absolute and relative values confirm the elite performance level of the tested athletes. Peak power output (PPO) was similar [17] or higher [5,8,9,20] compared to previous findings in elite track cyclists. Similarly, the average CMJ height without arm swing (hands-on-hips) was ∼51 cm, exceeding the values reported by Lewis et al. [8], which further indicates a high level of lower-limb explosive strength. The mean time to complete the 62.5 m acceleration sprint (∼6.8 s) closely reflects real-world conditions of the first lap in the Team Sprint event [1]. Direct comparison of PPO between the specific (cycling) and non-specific (jump) tests revealed considerably higher values during CMJ, which supports previous observations [13]. Therefore, a key strength of the present study is the inclusion of an elite athlete cohort with confirmed training and competition status, enhancing the practical relevance of the findings for high-performance sport.
Importantly, CMJ height showed the largest correlation with sprint time, exceeding the associations observed with peak and mean power from the PPT6s. This suggests that explosive lower-limb force production and the ability to overcome inertia from a stationary start are key determinants of performance over a short acceleration distance such as 62.5 m. CMJ performance may better reflect the rapid force development characteristics required in the early sprint phase before air resistance becomes the dominant constraint [21]. The very large correlation between CMJ and PPO6s confirms previous findings regarding the relationship between vertical jump performance and anaerobic power, despite their biomechanical and metabolic differences [13]. The results highlight the preliminary potential of both specific and non-specific testing in applied settings. In particular, CMJ may represent a practical alternative when ergometer testing is not feasible [5], for example in talent identification programs [22]. This contributes to a better understanding of the transferability of power capabilities to sport-specific performance, in line with the concept of “bridging the gap.”
The importance of overcoming inertia during the initial acceleration phase is further supported by the relationships observed between bike inertial characteristics and power output generated in a specific test on a cycle ergometer in the present study. Both the moment of inertia and inertial load demonstrated large to very large correlations with peak and mean power during the PPT6s. This suggests that athletes capable of generating higher power outputs are also better able to perform under higher inertial conditions, which closely resemble the mechanical demands of a standing start in track cycling. In consequence, more powerful cyclists may be able to implement a higher gear ratio, potentially, but coaches should be careful because large inertial loads may induce fatigue [10]. Previous research demonstrated a large and significant relationship between quadriceps muscle thickness and inertial load in sprint cyclists [9]. This association was interpreted as a consequence of the specific demands of a standing start, which, unlike a flying start, requires maximal isometric quadriceps force during the gate release phase to initiate movement and generate maximal power output [1,6]. Immediately after gate release, riders transition into the drive phase, during which maximal power must be produced as rapidly as possible and maintained throughout the initial acceleration [17,23]. Taken together, these findings highlight the importance of neuromuscular qualities enabling rapid dynamic force generation against high inertia as a key determinant of sprint acceleration performance.
The absence of direct on-track power measurement represents a limitation of the present study. The use of instrumented systems enabling real-time power assessment during track cycling could provide a more comprehensive characterization of the mechanical determinants of acceleration performance and help distinguish between neuromuscular and technical contributions [22]. However, time to complete the 62.5 m sprint remains a valid and ecologically relevant proxy of acceleration performance under fixed-gear conditions typical of track cycling, where gear ratio remains constant, and no shifting is possible [1]. Although OptoJump does not provide direct kinetic measurements (e.g., ground reaction force or rate of force development), it is a validated, reliable, and widely accepted tool in both laboratory and field settings [15]. The system estimates jump height based on flight time, which assumes a consistent take-off and landing technique and may not capture subtle changes in movement strategy or force-time characteristics. Consequently, it does not allow detailed analysis of the eccentric or concentric phases of the movement. It should be noted that the model of moment of inertia calculation represents a simplification, as it assumes that mass is concentrated at the wheel radius and does not fully account for the distributed mass and combined translational and rotational inertia of the system. Therefore, the calculated inertial load should be interpreted as an approximation that enables consistent comparison between conditions rather than a precise mechanical description of the system. Future research should determine whether the observed relationships remain robust over time and whether these tests can be used for longitudinal monitoring of performance adaptations or fatigue. Since such assessments are commonly used to track training responses, their validation under different environmental stressors such as hypoxia or heat would be valuable. CMJ may be particularly useful for fatigue monitoring and injury prevention in sprint-based exercise [24]. Moreover, future studies should include female athletes, individuals of different training levels, and other performance contexts to improve generalizability [25]. This appears particularly important considering the well-documented differences in absolute and relative power production between male and female athletes, which may influence the relationships between neuromuscular performance, inertial characteristics, and acceleration capabilities in sprint track cycling [26].
5. Conclusions
CMJ height and relative power from PPT6s may serve as feasible indicators of an athlete’s ability to accelerate effectively in track sprinting. Although with caution, they might be used interchangeably in an applied setting, at least in elite male cyclists. Further research, especially with a longitudinal approach that allows for tracking changes and the interplay between the analyzed variables, is warranted to validate the presented findings.
Acknowledgments
We would like to thank all track sprint cyclists who participated in this study.
Funding information
This research received no external funding.
Author contributions
K.M. wrote the original draft of the edited the manuscript, designed the study, organized resources, conducted the investigation, acquired and interpreted the data, and administered the project; T.K. interpreted the data and edited the manuscript, A.K. supervised the manuscript; D.M organized resources, interpreted the data and edited the manuscript. Each author reviewed and approved the submitted version of the manuscript and agreed to be personally accountable for their own contributions.
Conflict of interest statement
The authors declare no conflicts of interest.
Data availability statement
The datasets supporting the findings of the current study are available from the corresponding author on reasonable request.