
1. Introduction
Obstacle navigation represents a critical challenge in daily locomotion, with failed balance recovery during crossing frequently leading to falls [1,2]. Tripping over obstacles accounts for 42% of walking-related falls among young adults [3], necessitating improved understanding of adaptive locomotion – movement pattern adjustments for environmental constraints [4]. Despite existing research focusing on elderly and clinical populations [5–8], young adults experience substantial fall risks, with 48% reporting ≥1 fall over 16 weeks and 10% sustaining injuries [1]. Notably, falls account for 32.3% of adult injuries in young populations [9], incurring $7 billion annual costs in the US and contributing to 28% of traumatic brain injuries [1,9]. While possessing better physical capacity, young adults’ risk escalates through overconfidence and frequent dual-tasking(e.g., phone use [10], object carrying [11]) that impair visual monitoring [12].
Visual information acquisition, particularly lower visual field (LVF) cues about obstacle characteristics, critically informs gait planning [13–15]. Shirley and Christopher [16], through exploring the relationship between the visible structure of an obstacle and gait parameters during the process of crossing obstacles, reached the conclusion that a decrease in the visible structure of the obstacle results in an increase in gait variability and the risk of tripping. Most studies utilize stereoscopic goggles to control the gathering of visual information, thereby affecting the LVF during obstacle crossing [17]. However, Binaee and Diaz [18] found that visual guidance of the LVF prior to crossing augmented reality (AR) obstacles made subjects more cautious. Meanwhile, the research of Rania et al. [19] showed that using a Head-Mounted Display to influence vision may cause discomfort or posture changes due to added weight or device unfamiliarity. This implies that the influence on the LVF requires greater alignment with real-life situations.
Therefore, the present study introduces a novel, ecologically valid “box-carrying” paradigm to investigate LVF obstruction. We aim to (i) dissociate the independent and interactive effects of LVF obstruction and obstacle height on adaptive gait, and (ii) provide insights into sensorimotor reweighting and interlimb coordination strategies under visually challenging yet common real-world conditions. Grounded in sensorimotor integration theory [11,20], we hypothesize that lower visual field obstruction disrupts online visual exproprioception, forcing a shift to proprioceptive-dominant control and feed-forward planning. This sensorimotor reweighting will manifest as a conservative gait strategy characterized by: (i) reduced step velocity to prolong swing phase duration for error correction [20]; (ii) increased horizontal safety margins (TD and HD) to compensate for heightened spatial uncertainty; and (iii) elevated vertical toe clearance (LTC and TTC) to counteract trajectory variability induced by visual deprivation. Furthermore, consistent with interlimb visuomotor transfer [21], we predict that lead-limb visual information will be shared to calibrate trail-limb trajectories, resulting in positive coupling between LTC and TTC.
2. Materials and methods
2.1. Participants
A total of 15 healthy males (mean age, 20.9 ± 1.3 years; mean height, 178.6 ± 5.0 cm; mean weight, 71.7 ± 7.5 kg; mean leg length, 91.7 ± 5.1 cm) were recruited from Taiyuan University of Technology. A post hoc power analysis conducted with G*Power 3.1.9.2, based on a sample size of 15, an alpha level of 0.05, and an effect size of 0.25, achieved a statistical power of 0.80. Exclusion criteria included recent lumbar or lower extremity injury (past 6 months), musculoskeletal or neurological disorders affecting balance or gait, and visual deficits (detected by self-reported visual impairment) that prevented recognition of the experimental apparatus. All participants provided written informed consent prior to participation, following a detailed explanation of study procedures. The study was approved by the Institutional Review Board (IRB) of Taiyuan University of Technology (Science and Ethics Committee; Approval No. TYUT202404501) and complied with the Declaration of Helsinki throughout.
2.2. Equipment and protocol
Participants were required to wear tight-fitting laboratory attire and shoes, walking at a self-selected comfortable speed on a 6-meter walkway. They crossed an adjustable-height aluminum tube obstacle at the walkway midpoint without contact or losing balance. The leading limb, defined as the first to cross, and the trailing limb, defined as the second, were not instructed. Obstacle heights of 10, 20, and 30% of their leg length (the leg length was measured from the anterior superior iliac spine to the medial malleolus [22]) in random order were generated by a random generator, with or without carrying boxes. Obstacle heights were selected to reflect those typically encountered in daily life, as obstacles exceeding 30% of leg length are rare in everyday activities [8,23]. The boxes measured 30 × 30 × 25 cm and 30 × 30 × 35 cm in length, width, and height, respectively, which were common sizes encountered in daily life [24]. The weight of the two boxes was 375.25 ± 30 g, with no effect on LVF obstruction [25]. Participants were required to hold boxes close to their abdomen with elbows at a 90° angle [26]. In this posture, the LVF obstruction ranged from 1.54 to 2.00 m when carrying small boxes and from 2.91 to 1.82 m when carrying large boxes. This standardized posture was implemented to minimize variability in upper-body movement and compensatory arm swing, thereby helping to isolate the effect of visual obstruction from the physical constraint of holding an object. Five effective data sets were collected per participant for each condition, with data from three crossings of the obstacle with the same side leg [27]. Experiment setup and the characteristic moments of crossing obstacles are partitioned as depicted in Figure 1.
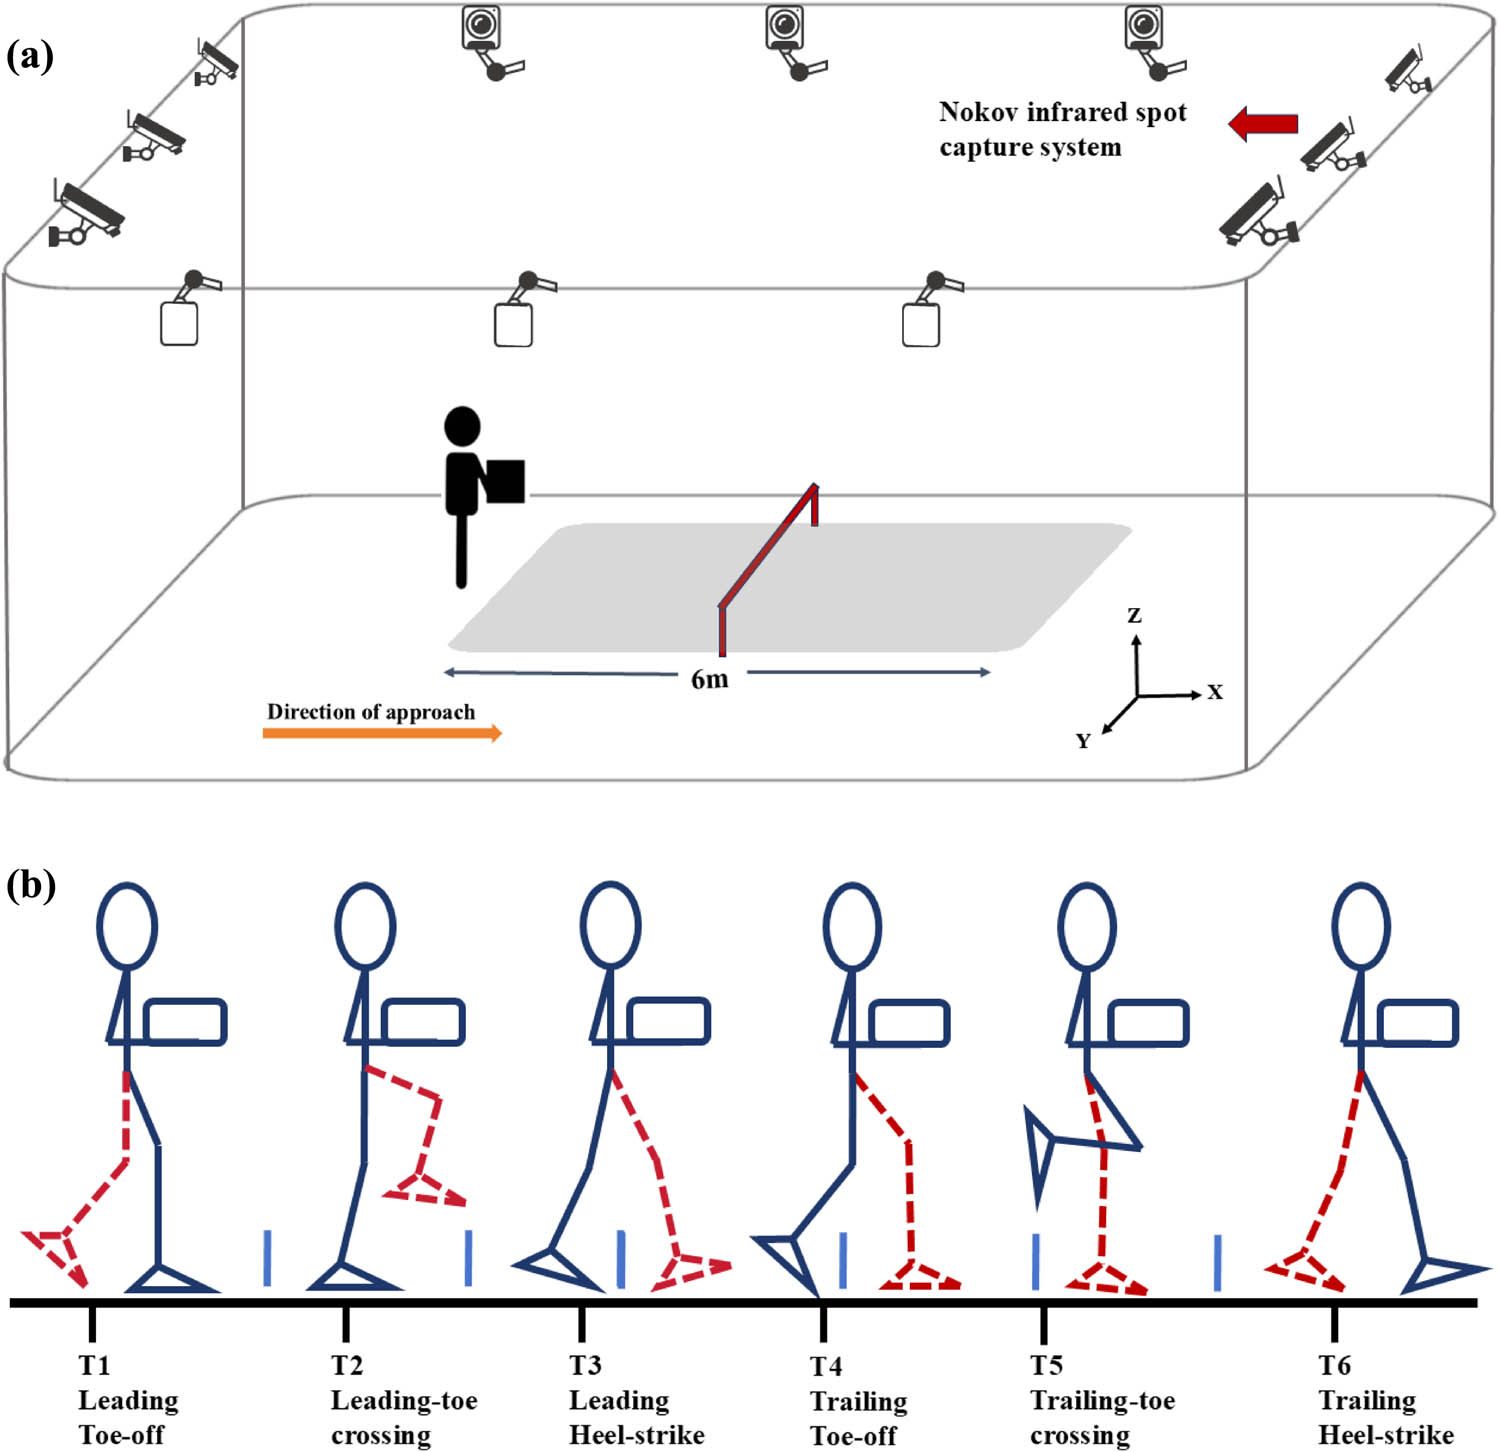
Figure 1
Diagrammatic illustration of experiment setup (a) and the events measured in the gait cycle (b). The limbs in the crossing cycle are depicted with leading (red lines) and trailing (blue lines) indicators for each occurrence: leading toe-off (T1); leading toe positioned above the obstacle (T2); leading heel strike (T3); trailing toe-off (T4); trailing toe positioned above the obstacle (T5); trailing heel strike (T6).
The kinematic data were collected using a 12-lens infrared spot 3D motion capture system synchronized (Nokov Mars2H, China), with a sampling frequency of 200 Hz. The same researcher attached 29 reflective markers to the participants based on the Helen Hayes model. The infrared reflective markers placed at both ends of the obstacles were used to define the position and height of the obstacles.
2.3. Data analysis
The kinematic data were processed with Cortex-64 2.6.2 (Motion Analysis Inc, USA) software. All the three-dimensional coordinates of the markers were smoothed using Butterworth low-pass filtering (cut-off frequency of 13 Hz [28]) to establish a multi-rigid body model of the human body segments based on the reflective markers.
Step length [29] is defined as the distance between the heels of the trailing limb and the leading leg when crossing the obstacle. Step width [20] is defined as the mediolateral distance between the heels of the trailing limb and the swinging leg when crossing the obstacle. Step velocity [30] was calculated exclusively from horizontal displacement between leading toe-off and trailing heel strike positions divided by the corresponding time interval. Toe distance (TD) [29] is defined as the horizontal distance between the toe of the trailing limb and the obstacle before crossing the obstacle. Lead and trail limb vertical toe clearance (LTC/TTC) [31,32] is defined as the vertical distance between the toe and the obstacle when crossing the obstacle. Heel distance (HD) [29] is defined as the horizontal distance between the heel of the leading limb after heel strike and the obstacle. These measures are described in Figure 2. Penultimate foot placement (PFP) [20] is defined as the horizontal distance between the toe of the leading limb and the obstacle before crossing the obstacle.
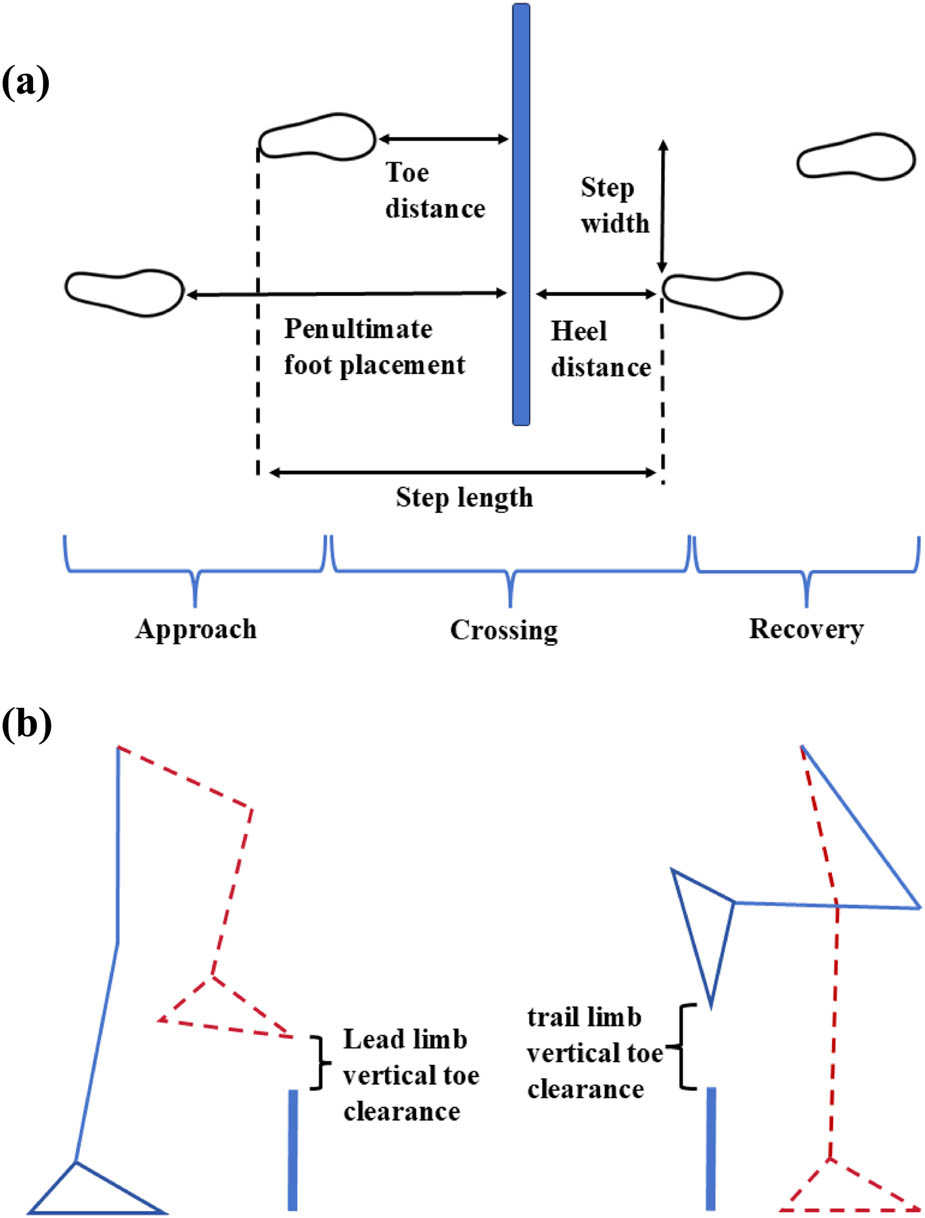
Figure 2
Diagrammatic illustration of foot placement and clearance parameters for the lead and trail feet during obstacle crossing. (a) Example of horizontal obstacle clearance parameters. (b) Example of vertical obstacle clearance parameters. The dotted lines are used to represent the leading limb, and the solid lines are employed to signify the trailing limb.
2.4. Statistical analysis
All analyses were conducted using SPSS 23.0 (SPSS Inc., IL, USA) software. Prior to conducting the statistical analyses, the dataset was examined to remove any obvious outliers (those exceeding 3 standard deviations from the group mean). For each gait parameter (averaged across the three repetitions), a repeated-measures ANOVA with a 3 × 3 design was used to determine main and interaction effects for carrying the boxes blocked by the LVF (30 × 30 × 25 cm, 30 × 30 × 35 cm, and no box) and obstacle height (10, 20, and 30% of leg length). When the interaction term was non-significant (α = 0.05), main effects were interpreted without follow-up simple-effects analyses. All primary F-tests were subjected to Holm–Bonferroni correction across the four major variables (family-wise α = 0.05). For all analyses the α-level for statistical significance was set at P < 0.05. For all significant main effects, pairwise comparisons were conducted. We report mean differences with 95% confidence intervals, Cohen’s d effect sizes (interpreted as: |d| ≥ 0.20 small, ≥0.50 medium, ≥0.80 large), and exact p-values.
To explore potential coordination strategies, we examined key relationships a priori based on previous work: (1) TD vs HD, (2) LTC vs TTC, and (3) step velocity vs TD. To control for the family-wise error rate (FWER), we applied the Bonferroni correction with an adjusted significance level of α = 0.017. Pearson correlation coefficients (r) were computed for each pair, and only correlations surviving this Bonferroni-adjusted threshold (P < 0.017) were considered statistically significant. The evaluation criteria for the magnitude of correlation were highly correlated (|r| ≥ 0.50), moderately correlated (0.50 > |r| ≥ 0.30), and lowly correlated (0.30 > |r| ≥ 0.10).
3. Results
Trunk pitch angle during the entire obstacle-crossing differed significantly when boxes were carried at leading limb heel-strike [−5.07° vs −7.13° vs −7.10°, F (2,42) = 15.29, P < 0.001, η 2 = 0.27]. A follow-up ANCOVA confirmed that lower visual field obstruction explained unique variance in Toe distance (TD), Heel distance (HD), lead-limb toe clearance (LTC), and trail-limb toe clearance (TTC) (P ≤ 0.012) after controlling for trunk angle (P ≥ 0.30), indicating that the posture adjustments caused by carrying boxes did not drive the observed gait adaptations. Detailed statistical results are provided in Supplementary Tables S1 (repeated-measures two-way ANOVA) and S2 (repeated-measures ANCOVA).
In this research, the Obstruction × Height interaction was non-significant for each variable (all P > 0.05, Table 1). Consequently, only main effects were interpreted.
Table 1
3 × 3 repeated-measures ANOVA for gait parameters
| Parameters (unit) | Unobstructed | Obstruction 25 | Obstruction 35 | Obstruction effect | Height effect | Obstruction ×Height |
|---|---|---|---|---|---|---|
| Step length (mm) | 714.3 ± 45.5 | 725.6 ± 48.7 | 731.9 ± 58.5 | F (2,74) = 2.68, P = 0.075, η 2 = 0.067 | F (2,37) = 0.19, P = 0.825, η 2 = 0.010 | F (4,74) = 0.31, p = 0.873, η 2 = 0.016 |
| Step width (mm) | 156.2 ± 35.5 | 161.8 ± 44.9 | 163.5 ± 41.9 | F (2,74) = 1.17, p = 0.316, η 2 = 0.031 | F (2,37) = 0.19, p = 0.826, η 2 = 0.010 | F (4,74) = 0.39, p = 0.813, η 2 = 0.021 |
| step velocity (mm/s) | 1.65 ± 0.19 | 1.59 ± 0.19 | 1.55 ± 0.21 | F (2,74) = 25.62, p < 0.001, η 2 = 0.409 | F (2,37) = 7.27, p = 0.002, η 2 = 0.282 | F (4,74) = 1.07, p = 0.377, η 2 = 0.055 |
| TD (mm) | 275.9 ± 44.2 | 315.7 ± 47.9 | 338.7 ± 57.5 | F (2,74) = 37.03, p < 0.001, η 2 = 0.500 | F (2,37) = 0.21, p = 0.814, η 2 = 0.011 | F (4,74) = 0.99, p = 0.418, η 2 = 0.051 |
| HD (mm) | 222.8 ± 28.7 | 194.7 ± 37.4 | 179.7 ± 46.6 | F (2,74) = 14.30, p < 0.001, η 2 = 0.279 | F (2,37) = 0.05, p = 0.949, η 2 = 0.003 | F (4,74) = 0.60, p = 0.662, η 2 = 0.032 |
| TC swing (mm) | 155.1 ± 35.2 | 187.5 ± 46.6 | 201.2 ± 49.3 | F (2,74) = 45.58, p < 0.001, η 2 = 0.552 | F (2,37) = 0.26, p = 0.776, η 2 = 0.014 | F (4,74) = 1.93, p = 0.114, η 2 = 0.094 |
| TC stance (mm) | 144.0 ± 43.2 | 171.3 ± 46.0 | 184.5 ± 53.6 | F (2,74) = 23.58, p < 0.001, η 2 = 0.389 | F (2,37) = 0.27, p = 0.763, η 2 = 0.015 | F (4,74) = 0.58, p = 0.676, η 2 = 0.031 |
| Penultimate (mm) | 967.8 ± 78.0 | 973.7 ± 70.3 | 982.1 ± 82.6 | F (2,74) = 2.06, p = 0.134, η 2 = 0.053 | F (2,37) = 0.21, p = 0.809, η 2 = 0.011 | F (4,74) = 2.35, p = 0.062, η 2 = 0.113 |
3.1. Evaluating the association between obstacle heights and gait parameters
No significant height × obstruction interactions were found for any parameter (P > 0.05), thus simple effects analyses were omitted. Pairwise comparisons across obstacle-height conditions (Supplementary Table S4) revealed significant, height-dependent reductions in step velocity (Table 2).
Table 2
Comparisons of Step velocity across different height conditions (between-subject effects)
| Parameter | Comparison | Mean ± SD (I) | Mean ± SD (J) | Mean Difference [95% CI] (mm/mm/s) | Cohen’s d | p-Value |
|---|---|---|---|---|---|---|
| Step velocity (mm/s) | 10% vs 20% | 1745.0 ± 176.7 | 1676.4 ± 165.6 | 68.6 [−19.8, 157.0] | 0.41 | 0.126 |
| 10% vs 30% | 1745.0 ± 176.7 | 1513.7 ± 159.1 | 231.3* [114.5, 348.1] | 1.39 | 0.001* | |
| 20% vs 30% | 1676.4 ± 165.6 | 1513.7 ± 159.1 | 162.7* [11.1, 314.3] | 0.99 | 0.034* |
[i] Mean differences (Mean Diff) with 95% confidence intervals (95% CI) were derived from pairwise comparisons. Cohen’s d was calculated as the standardized effect size (|d| ≥ 0.20: small; ≥0.50: medium; ≥0.80: large). Values with asterisks * indicate statistically significant differences (P < 0.05). Values are mean ± standard deviation (Mean ± SD). Negative mean differences indicate lower values in the first condition (I) compared to the second (J).
Relative to the 10% height condition, velocity was markedly lower at 30% (Mean Diff = 231.3 mm/s, 95% CI [114.5, 348.1], d = 1.39, P = 0.001), while the 20 versus 10% difference did not survive correction (Mean Diff = 68.6 mm/s, 95% CI [–19.8, 157.0], d = 0.41, P = 0.126). Between the two obstruction heights, 30% elicited a substantially slower gait than 20% (Mean Diff = 162.7 mm/s, 95% CI [11.1, 314.3], d = 0.99, P = 0.034). Thus, increasing obstacle height from 20 to 30% produced the largest decrement in step velocity, with a large effect size.
3.2. Evaluating the association between obstruction of the lower visual field and gait parameters
Pairwise comparisons across the three visual-field obstruction conditions (Supplementary Table S3) revealed significant, stepwise modulations in all spatial gait parameters, with large-to-medium effect sizes (Figure 3).
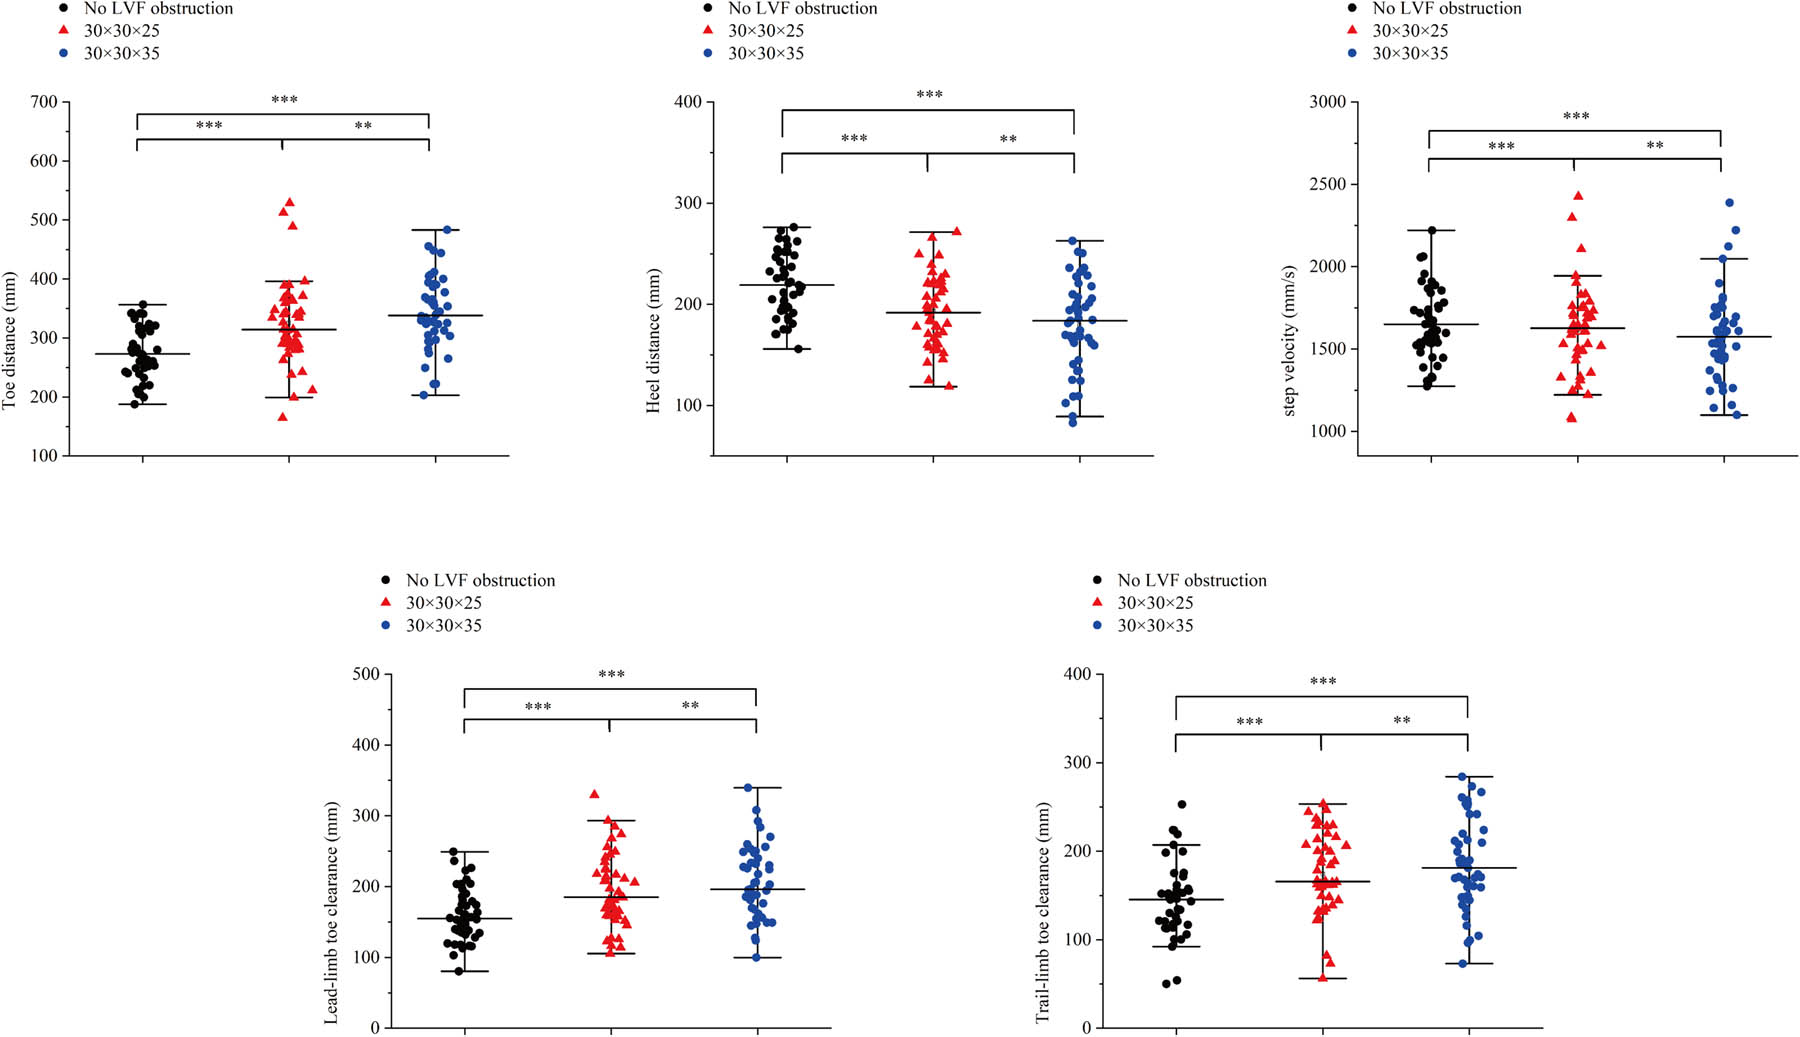
Figure 3
Each gait parameter under the condition of without carrying boxes, and carrying boxes of 30 × 30 × 25 cm and 30 × 30 × 35 cm that occlude the lower visual field (LVF). Error bars show the mean ± SD, * P < 0.05,** P < 0.01,***P < 0.001.
Step velocity decreased monotonically as obstruction depth increased: compared with no obstruction, velocity was lower in the 25 cm condition (Mean Diff = 61.7 mm/s, 95% CI [31.0, 93.0], d = 0.32, P < 0.001) and further reduced in the 35 cm condition (Mean Diff = 94.6 mm/s, 95% CI [69.0, 122.0], d = 0.48, P < 0.001); the 35 cm condition was also slower than 25 cm (Mean Diff = 32.9 mm/s, 95% CI [10.0, 57.0], d = 0.16, P = 0.006).
Toe distance (TD) increased systematically: relative to no obstruction, TD was greater with 25 cm obstruction (Mean Diff = –39.8 mm, 95% CI [–54.0, –25.0], d = –0.86, P < 0.001) and even greater with 35 cm obstruction (Mean Diff = –62.8 mm, 95% CI [–80.0, –46.0], d = –1.25, P < 0.001); the 35 cm condition also exceeded the 25 cm condition (Mean Diff = –23.0 mm, 95% CI [–36.0, –10.0], d = –0.44, P = 0.001).
Heel distance (HD) showed the opposite trend, decreasing with deeper obstruction: HD was shorter with 25 cm (Mean Diff = 28.1 mm, 95% CI [12.0, 44.0], d = 0.84, P = 0.001) and 35 cm (Mean Diff = 43.1 mm, 95% CI [25.0, 62.0], d = 1.14, P < 0.001) compared with no obstruction; the 35 cm versus 25 cm difference did not reach significance (Mean Diff = 15.0 mm, 95% CI [0.0, 31.0], d = 0.35, P = 0.053).
Lead-limb toe clearance (LTC) increased with obstruction depth: elevations were higher at 25 cm (Mean Diff = –32.4 mm, 95% CI [–43.0, –22.0], d = –0.78, P < 0.001) and 35 cm (Mean Diff = –46.1 mm, 95% CI [–57.0, –36.0], d = –1.05, P < 0.001) relative to no obstruction, and the 35 cm condition was higher than 25 cm (Mean Diff = –13.7 mm, 95% CI [–23.0, –5.0], d = –0.29, P = 0.004).
Trail-limb toe clearance (TTC) followed the same pattern: compared with no obstruction, clearance rose at 25 cm (Mean Diff = –27.3 mm, 95% CI [–38.0, –17.0], d = –0.62, P < 0.001) and further at 35 cm (Mean Diff = –40.5 mm, 95% CI [–55.0, –26.0], d = –0.83, P < 0.001); clearance was also higher at 35 cm than at 25 cm (Mean Diff = –13.2 mm, 95% CI [–25.0, –2.0], d = –0.26, P = 0.021).
3.3. Relationship among Gait parameters
After Bonferroni correction for pairwise tests (α = 0.017), five correlations remained significant. Toe distance increased linearly with step velocity (r = 0.548, P < 0.001). Heel distance and toe distance were negatively coupled (r = –0.463, P < 0.001). Lead-limb toe clearance and trail-limb toe clearance rose in tandem (r = 0.600, P < 0.001). Both clearances decreased as step velocity increased (LTC: r = –0.275, P= 0.006; TTC: r = –0.269, P = 0.007). Correlation outcomes are graphically summarized in Figure 4.
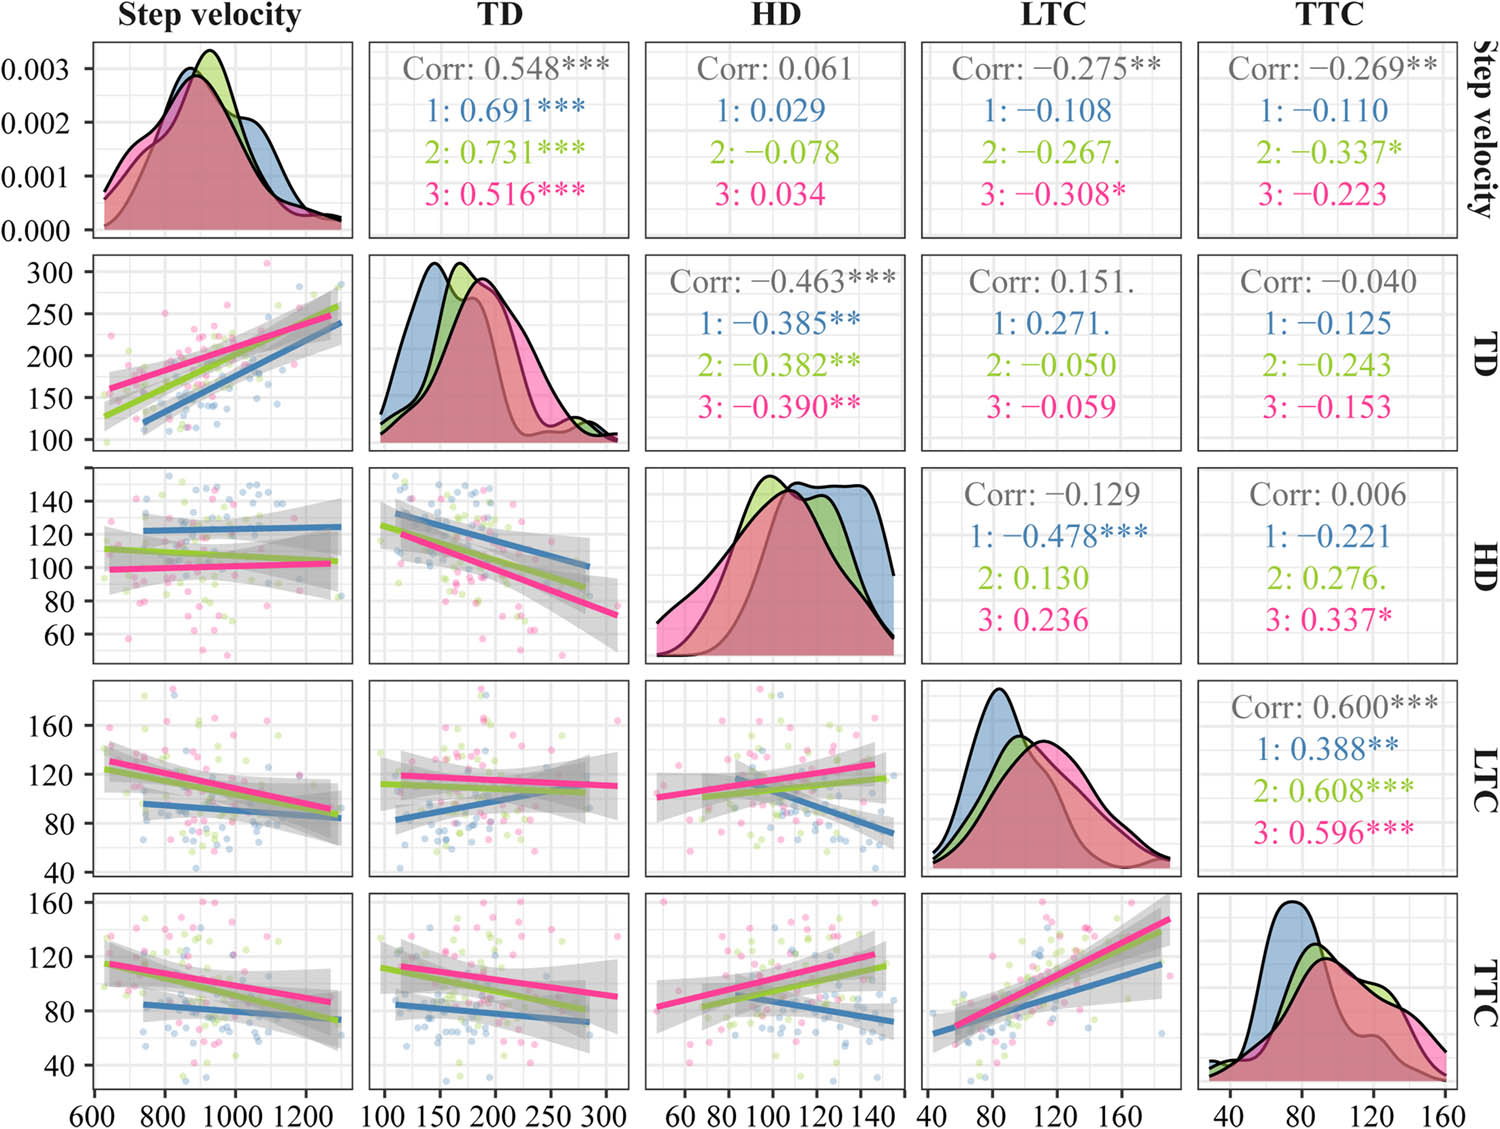
Figure 4
A priori correlation matrix between key gait parameters under lower-visual-field (LVF) obstruction. Each point represents one obstacle-crossing trial; solid lines denote Pearson regression fits with 95% confidence bands (shaded). Correlation coefficients (r) and Bonferroni-corrected p-values (α = 0.017) are inset. Only correlations surviving correction are reported. *: P < 0.017, **: P < 0.01, ***: P < 0.001. (1) Unobstructed (LVF) (2) Obstruction 25 (3) Obstruction 35. Only correlations surviving Bonferroni correction (α = 0.017) are reported. Values shown in original measurement units (mm/mm/s).
4. Discussion
This study found that the LVF obstruction and obstacle heights significantly impacted multiple gait parameters, but no interaction effect was observed between them. More specifically, the height of obstacles only significantly influenced the step velocity, while the LVF obstruction mainly affected the four gait indicators of toe distance (TD), heel distance (HD), Lead-limb toe clearance (LTC), and Trail-limb toe clearance (TTC). The following will have an in-depth discussion of these results. Consistent with our pre-registered analytical plan, step length, step width, and Penultimate foot placement showed neither significant main nor interaction effects (Table 1) and were therefore not interpreted further.
4.1. Effects of increases in obstacle height
The observed decrease in step velocity with increasing obstacle height reflects a deliberate adaptive strategy employed by participants to enhance stability and control during obstacle crossing. This finding is consistent with previous research demonstrating that individuals tend to slow down when navigating higher obstacles to ensure safe and controlled movement. As shown by da Silva et al. [33], who claimed that the increased height of obstacles makes gait adjustments more difficult, thus reducing step velocity to enhance stability when crossing obstacles. The reduction in step velocity is not merely a trivial consequence of changes in foot trajectory but rather a meaningful adjustment to ensure safe obstacle crossing, particularly when visual information from the lower visual field is partially obstructed. While the current study did not directly test the mechanism underlying this change, the observed decrease in step velocity with increasing obstacle height aligns with previous findings suggesting that individuals may prioritize stability over speed when negotiating taller obstacles [11]. Additionally, the influence of obstacle height on gait might originate from an individual’s fear of crossing obstacles and the instinctive response to safety [34]. The correlation analysis revealed that slower step velocity was associated with larger Toe distance and toe clearance values. Although these relationships are cross-sectional and do not imply causation, they further illustrate that the visual information provided by the obstacle offered feedback to the individual. Higher obstacles require an augmented collection of visual exteroceptive information related to the obstacle, and sacrificing a certain step velocity enhances safety and control during the crossing process. One unanticipated result was that irrespective of the LVF obstruction, although the height of obstacles significantly influenced step velocity but had no impact on other gait parameters, such as step width or step length, suggesting that individuals primarily adjust step speed when confronted with varying obstacle heights rather than altering other gait parameters.
4.2. Effects of obstruction in the lower visual field
The present study found that as the extent of LVF obstruction increased, TD increased while HD decreased, and both LTC and TTC increased. These directional changes are consistent with previous findings under visual deprivation. Timmis et al. [35] observed that during continuous lower visual field obstruction using goggles, participants exhibited increased horizontal foot-placement distance and toe clearance, suggesting an association between LVF deprivation and altered obstacle-crossing behavior.
Previous studies on obstacle avoidance had suggested that the lead and trail limb were controlled independently based on visual input regarding properties [36]. However, Miura and Shinya [37] compared the lower limb movement trajectories of the leading limb and the trailing limb while crossing side-by-side obstacles of different heights; they found that the movement trajectories of both limbs were not solely determined by the height of the unilateral obstacle. Shota and Motoki [38] further inferred that both limbs share visual input information related to the characteristics of the obstacle by using a visual guidance task for crossing virtual obstacles. This is also consistent with our earlier observations, which indicated that in the approach phase, when visual information was lacking, individuals might adopt a more conservative strategy by increasing TD to enhance crossing safety. Once the trailing limb’s toe was safely positioned, motion information was transferred to the leading limb, thus reducing HD. This implies that precise coordination between both limbs is necessary for gait adjustment. LVF obstruction during crossing not only affects the leading limb but also the trailing limb, which indicated that sensory feedback from one limb can modify the movement of the other in a task-dependent manner. In this regard, the movement information learned with one limb is transferred to the same movements made with the other in a task-dependent fashion. The significant positive correlation between the lead and trail limb vertical toe clearance also validates this point. Surprisingly, LVF obstruction exerts no significant influence on the penultimate foot placement. Nevertheless, previous studies have demonstrated [39] that visual information must be obtained at least two steps before reaching the obstacle for proper toe clearance, suggesting that LVF obstruction via box carrying can be essentially feasible to guarantee the acquisition of visual information regarding the obstacle within two steps before crossing it.
4.3. Considering the dual nature of the box-carrying paradigm
The present study employed a “box-carrying” task to obstruct the lower visual field (LVF). It is acknowledged that this paradigm concurrently introduces a restriction of upper limb mobility, which is a valid consideration given the established role of the upper body in locomotor control. Literature indicates that free arm swing contributes to dynamic stability, particularly during reactive balance recovery from unexpected perturbations [40,41]. Moreover, restriction or absence of upper limb function can lead to increased whole-body angular momentum and pose a greater challenge to balance maintenance during walking disturbances [42].
However, the specific context of our experiment is crucial for interpretation. The aforementioned effects of arm restriction are most pronounced during reactive, perturbation-driven tasks where rapid compensatory movements are required [40]. In contrast, our study involved a self-paced, anticipated obstacle-crossing task. In this context, the primary demand shifts from reactive balance recovery to precise, feed-forward planning of foot trajectory, for which online visual exproprioception from the LVF is paramount [40]. Our statistical analysis supports this distinction: when trunk flexion angle (a biomechanical proxy for the postural effect of box-carrying) was entered as a covariate in ANCOVAs, the main effects of LVF obstruction level on all key spatial gait parameters (TD, HD, LTC, and TTC) remained highly significant, while the covariate itself was non-significant. This indicates that the variance explained by the graded visual obstruction was independent of the variance associated with the postural adjustment to the physical constraint.
Therefore, while the dual nature of our paradigm is recognized, the evidence suggests that under the controlled conditions of a planned obstacle negotiation, the visual-deprivation component was the predominant driver of the observed, dose-dependent adaptations in foot placement and clearance. The upper limb restriction likely presented a secondary, compounded challenge, but did not account for the systematic effects of LVF obstruction.
4.4. Limitations
Several limitations should be acknowledged concerning the present study. First, the participants were predominantly healthy young men, which potentially restricts the broad application of the research outcomes. Future research could enhance the sample size and incorporate participants of diverse ages, genders, and health statuses to further validate the universality of these findings. Second, although the design of this experiment stems from the common problems people encounter in daily life, the considered environmental setting is relatively elementary, with the main focus being on successful obstacle-crossing experiments. Future studies might consider enhancing the complexity of walking environments, such as dynamic or different material obstacles, and also increasing the research on gait strategies related to tripping and colliding with obstacles. In addition, the present study did not analyze upper body kinematics, such as trunk or head movements. While our primary focus was on lower limb gait parameters – which are most directly related to obstacle negotiation and tripping risk – we acknowledge that upper body postural adjustments could influence gait patterns.
5. Conclusions
In summary, this study provides three key advancements to the field of locomotor control. Methodologically, it establishes a novel and ecologically valid “box-carrying” paradigm to study lower visual field obstruction, effectively simulating a common real-world dual-task constraint. Empirically, it delineates the distinct roles of visual information and obstacle scaling: while obstacle height primarily modulates global gait speed (a temporal strategy), LVF obstruction exerts a more profound and independent influence on the fine-tuned, spatial planning of foot placement and trajectory (e.g., toe distance, heel distance, and vertical clearances). This conclusion is reinforced by our ANCOVA controlling for trunk kinematics, which statistically isolates the sensory-driven nature of these adaptations. Theoretically, the strong interlimb coupling in toe clearances extends the sensorimotor integration framework by revealing a coordinated, bilateral strategy for managing degraded visual feedforward information during obstacle negotiation.
Acknowledgments
We thank You-jia Zhang and Chao Yin for their assistance with data collection. In addition, we appreciate the cooperation of the participants in this study.
Funding informatiom
The article is supported by the First Batch of New Liberal Arts Research and Reform Practice Project (2021050026), and 2024 Provincial Association for Science and Technology Innovation Think Tank Construction Research Project (Category A) (KXKT202410).
Author contributions
Jingjing Guo: conceptualization, methodology, investigation, formal analysis, writing – original draft, writing – review & editing. Meizhen Wei: investigation, data curation, writing – review & editing. Zisheng Peng: formal analysis, software, validation, writing – review & editing. Meizhen Zhang: conceptualization, methodology, supervision, project administration, funding acquisition, writing – review & editing.
Conflict of interest statement
Authors state no conflict of interest.
Data availability statement
The datasets generated and analyzed during the current study are available from the corresponding author upon reasonable request.