
Figure 1
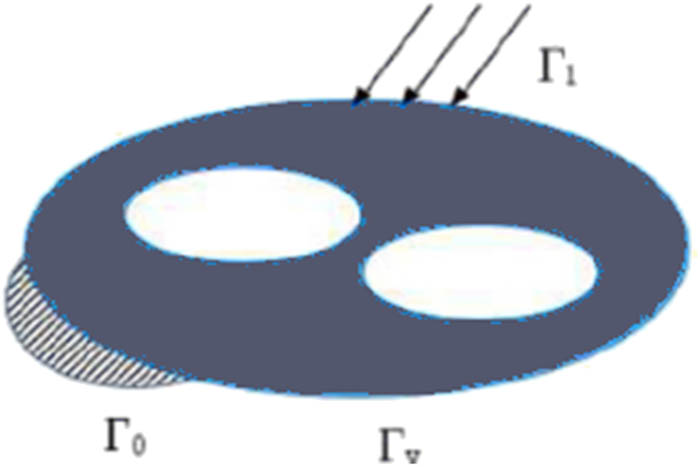
The stiffest design problem description: t applied forces, u displacement, Ω the domain of the elasticity system, Γ 0 part of the boundary with Dirichlet condition, Γ 1 part of the boundary loaded by traction forces, and Γ v part of the boundary subjected to modification.
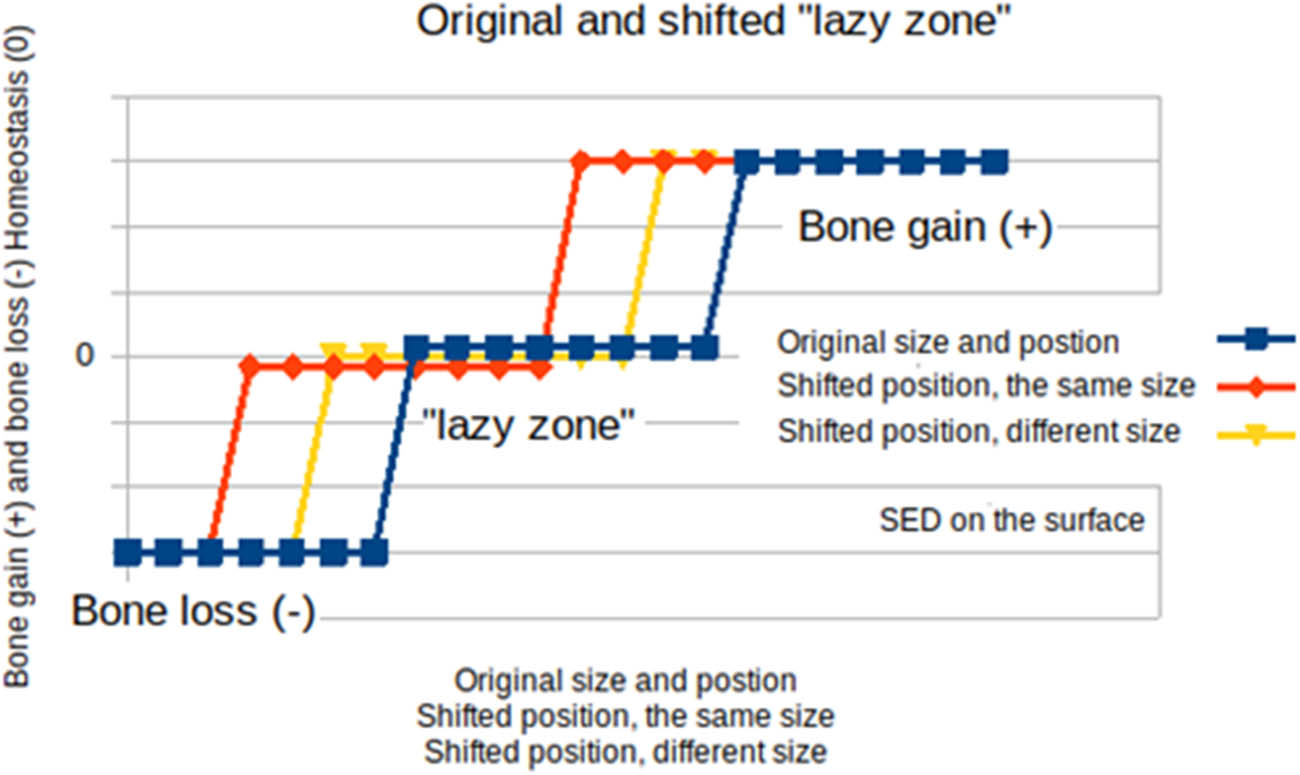
Figure 2
“Lazy zone” size and position – blue: the starting configuration, red: shifted position of the zone with the same size, yellow: shifted position and different size of the lazy zone.
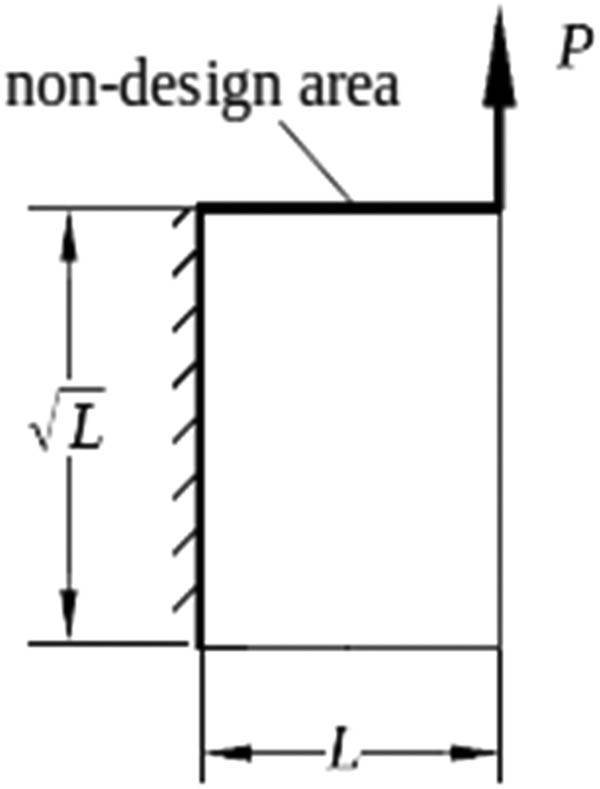
Figure 3
The numerical example: scheme of the topology design problem with a nondesign area – L = 50 mm, P = 1,000 N.
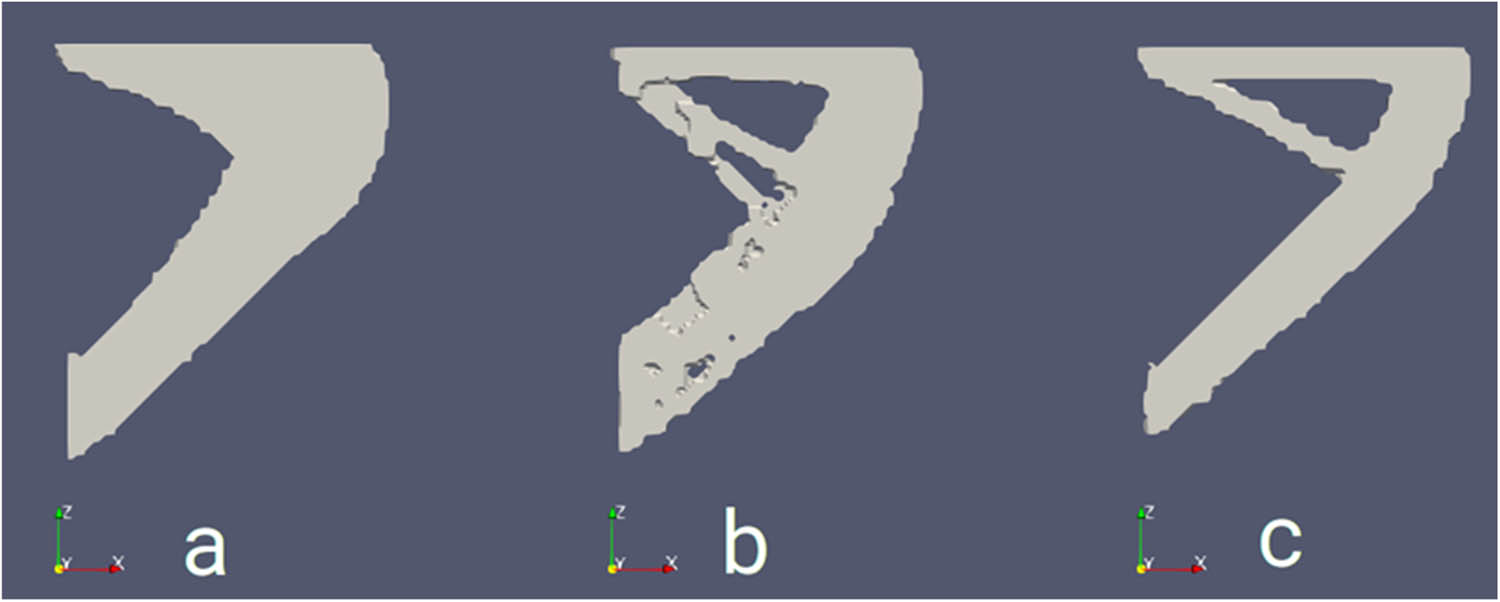
Figure 4
The numerical example, solutions: a – solution for the “lazy zone” range 8.00 × 10³–1.28 × 10⁵ Pa (which corresponds to red curve shown in Figure 2), b – solution for the “lazy zone” range 2.45 × 10⁴–8.45 × 10⁴ Pa (which corresponds to yellow curve shown in Figure 2), solution for the “lazy zone” range 3.20 × 10⁴–2.00 × 10⁵ Pa (which corresponds to blue curve shown in Figure 2).
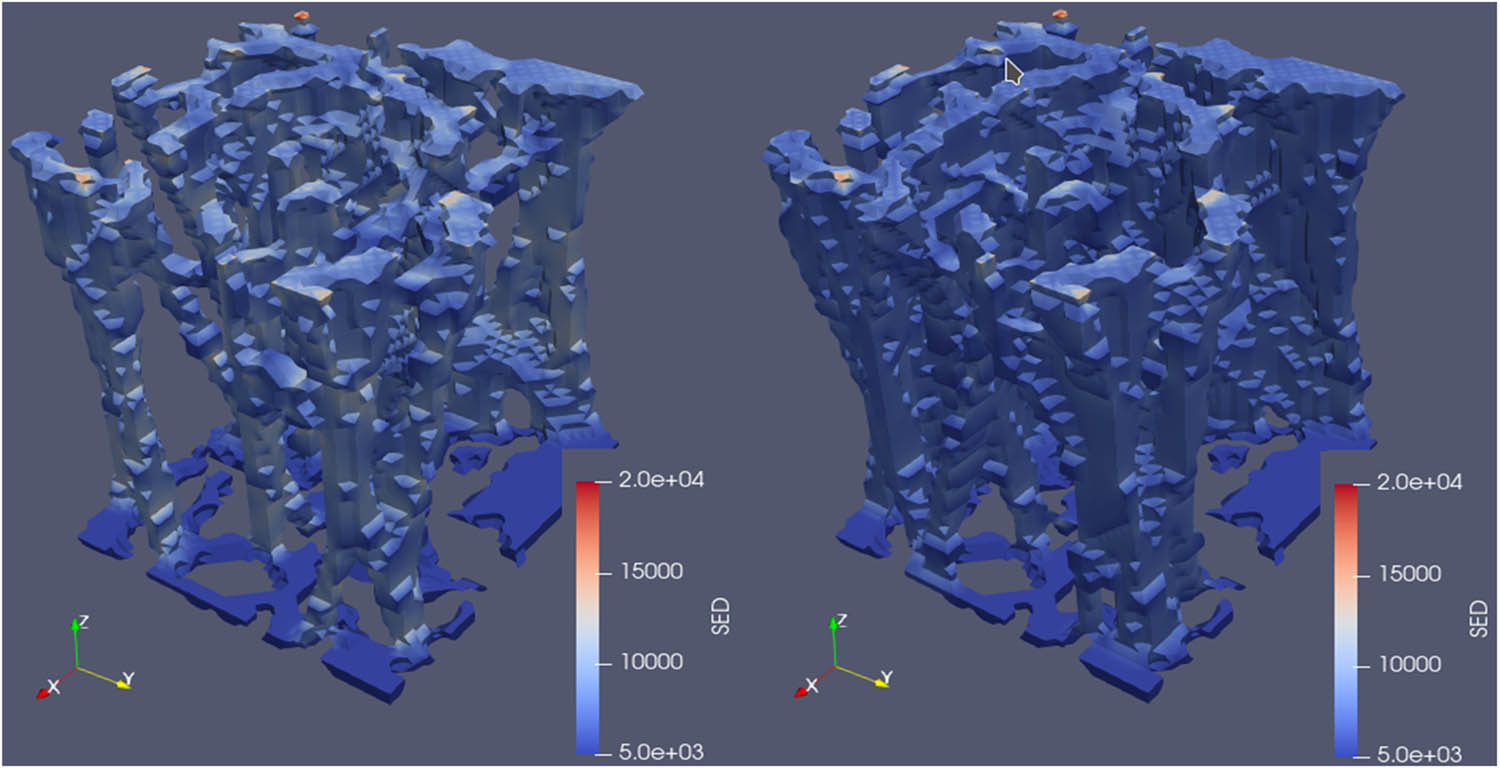
Figure 5
The numerical example, solutions: left – solution for the original “lazy zone” position and range (which corresponds to the blue curve in Figure 2), right – solution for the shifted “lazy zone” position and range (which corresponds to the red curve in Figure 2.).